

RAND ANALYSIS
- Hawkish comments halt ZAR strength.
- USD/ZAR downside move could be tiring.
ZAR FUNDAMENTAL BACKDROP
IS THE RALLY OVER?
The South African rand has flourished against the U.S. dollar since late November 2021 but this may be coming to an end with the Federal Reserve adding to its alreadyhawkish narrative.With such high expectations of the greenback late last year, markets flooded into dollar longs and unfortunately price action did not follow suit. With the traditional dollar fade over the December/January festive period repeating itself, the rand latched on and enjoyed the ride.
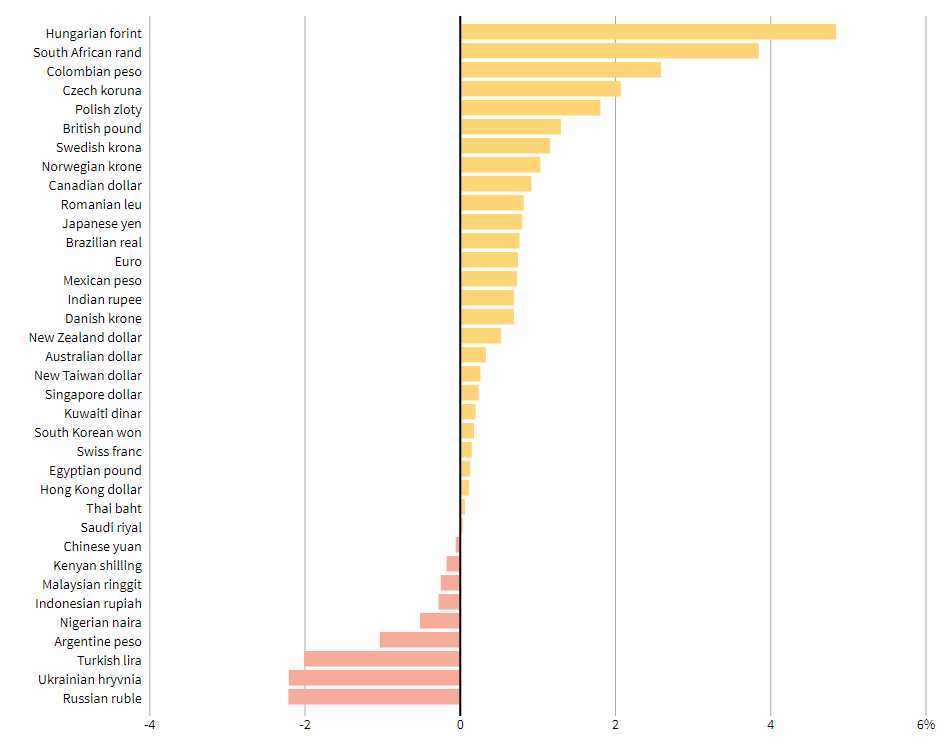
Remaining as the second best performing currency against the U.S. dollar year-to-date (see graphic below), the tide may be changing as the weak South African economic and political backdrop endures.
Source: Reuters
Yesterday, the Fed’s Daly mentioned the potential for rate hikes to begin in March which sent the dollar higher despite initial jobless claims data disappointing.
Later today, U.S. retail sales and consumer sentiment are the two high impact events on the economic calendar. Both prints are expected lower than prior but emphasis will be given to the inflationary components of the release in prices and inflation expectations respectively.
USD/ZAR ECONOMIC CALENDAR
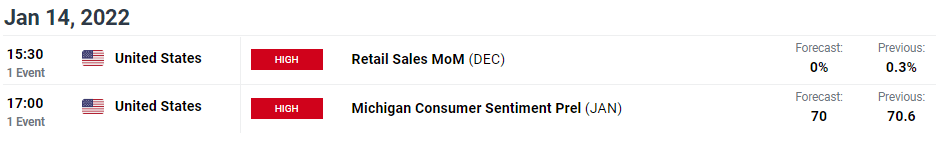
Source: DailyFX economic calendar
TECHNICAL ANALYSIS
USD/ZAR DAILY CHART
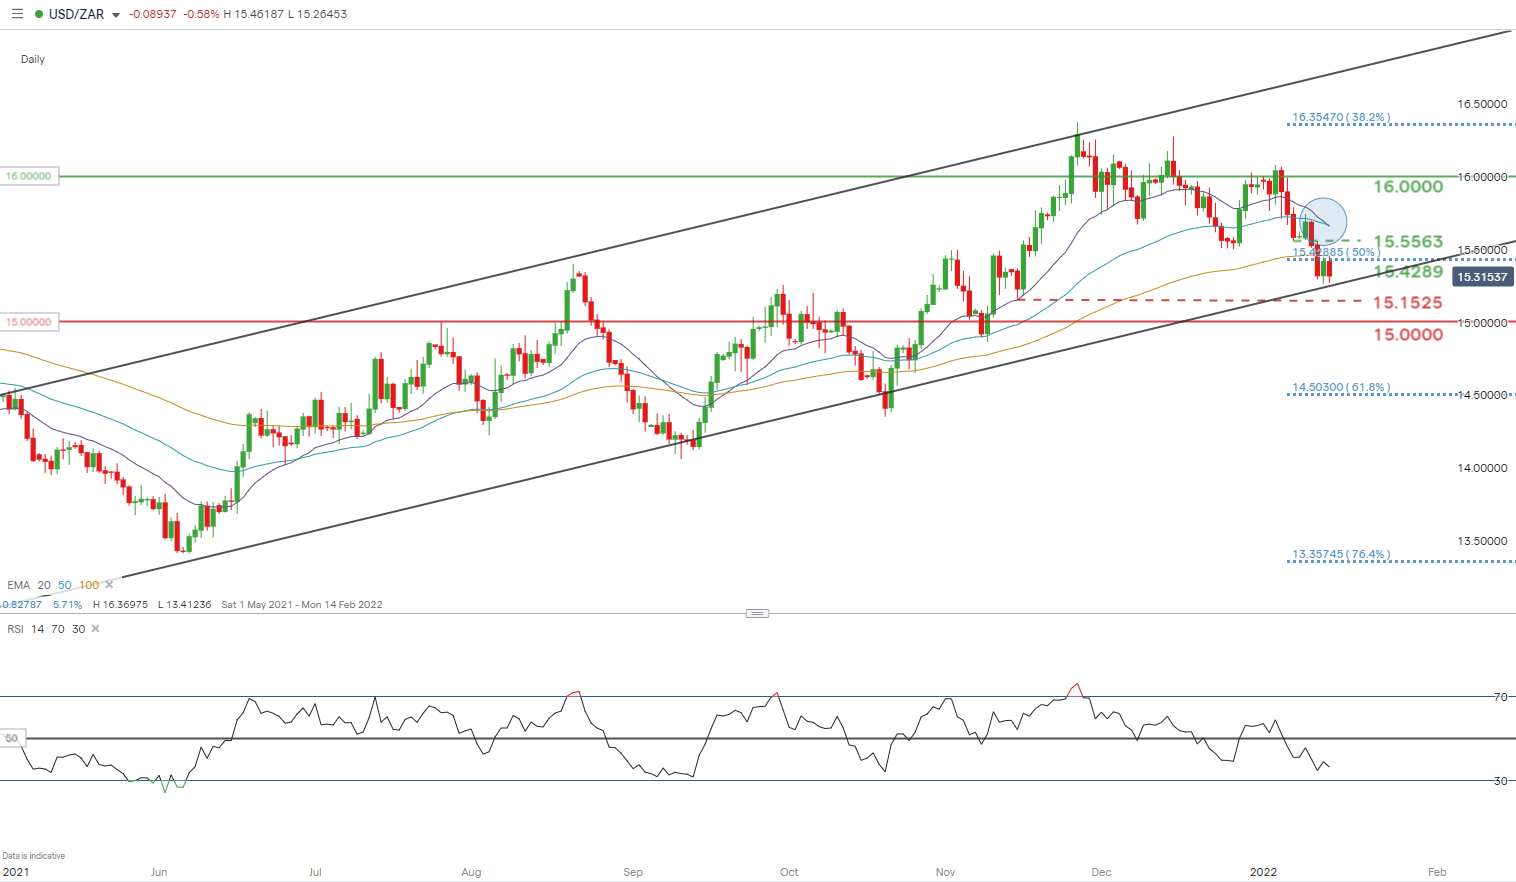
Chart prepared by Warren Venketas, IG
From a technical analysis point of view, the daily chart reads quite clean with the pullback in USD/ZAR price action approaching the medium-term channel support (black). While there is still room for further downside, I believe this will only be marginal at best. The Relative Strength Index (RSI) currently sits close to oversold territory, bouncing up off the October support reading around 34. While the growing threat of a bearish crossover on the 20 and 50-day EMA respectively, could suggest further rand strength to come (short-term).
Resistance levels:
- 16.0000
- 20 and 50-day EMA’s
- 15.5563 (January swing low)
- 15.4289 (50% Fibonacci)
Support levels:
Contact and follow Warren on Twitter: @WVenketas
Be the first to comment