

Dow Jones, Nasdaq 100, S&P 500 Price Outlook:
- After falling more than 1,000 points (-3.1%) on Monday, the Dow Jones continued lower Tuesday
- The Nasdaq blew through the psychologically significant 9,000 mark as it aimed lower
- Meanwhile, the S&P 500 is on pace for its worst 3-day stretch since August 2015
- Will the Stock Market Crash in 2020?
Dow Jones, Nasdaq 100, S&P 500 Extend Declines as Rout Deepens
After stumbling into the weekend, stocks suffered a massive gap lower to start the week with the Nasdaq plummeting more than -4% at the open. Opening price action was some of the most volatile in history for the Dow Jones and S&P 500 as each posted their largest lower gaps in over 20 years. Tuesday trading began with a slight recovery early in the session, followed by attempted jawboning from White House Economic Advisor Larry Kudlow.
The optimistic commentary was soon undone as the Center for Disease Control (CDC) released a report that warned of a possible widespread coronavirus outbreak in the United States and likely pandemic. Elsewhere, a survey from IPC offered insight on the viral outbreak’s impact on technology supply chains – with delays expected to be up to five weeks.Consequently, stocks continued lower as weeks of gains were erased in just four days.
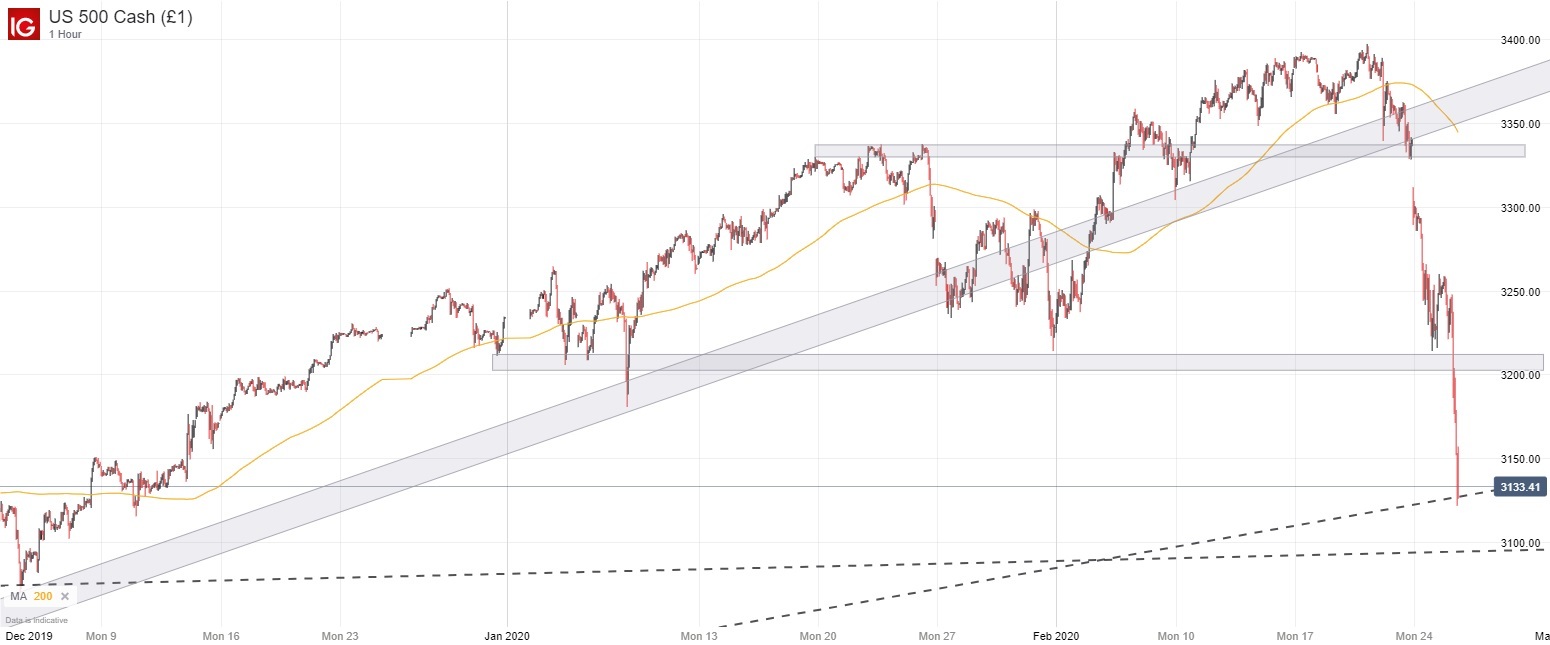
S&P 500 Price Chart: 1 – Hour Time Frame (December 2019 – February 2020)
S&P 500 Technical Forecast
In total, the S&P 500 has fallen nearly -8% from its record high on February 18 – just seven days ago – and has erased gains back to early December. Meanwhile, US yields dove as recession fears were ignited and growth-sensitive investments like the Australian Dollar and crude oil declined in lockstep. With moves of this magnitude across a variety of asset classes at both ends of the risk spectrum, it appears euphoria has been exchanged for panic as some investors begin to question the appropriate valuation given the shifting outlook.

Recommended by Peter Hanks
Traits of Successful Traders
Because the main catalyst for the declines has so few precedents, it is incredibly difficult to judge what the wider economic impact will be, and more importantly, when the virus will stop spreading. With that in mind, sound fundamental analysis is relatively difficult to conduct in my opinion so technical levels may gain more importance as major zones are tested.
S&P 500 Price Chart: Daily Time Frame (January 2018 – February 2020)
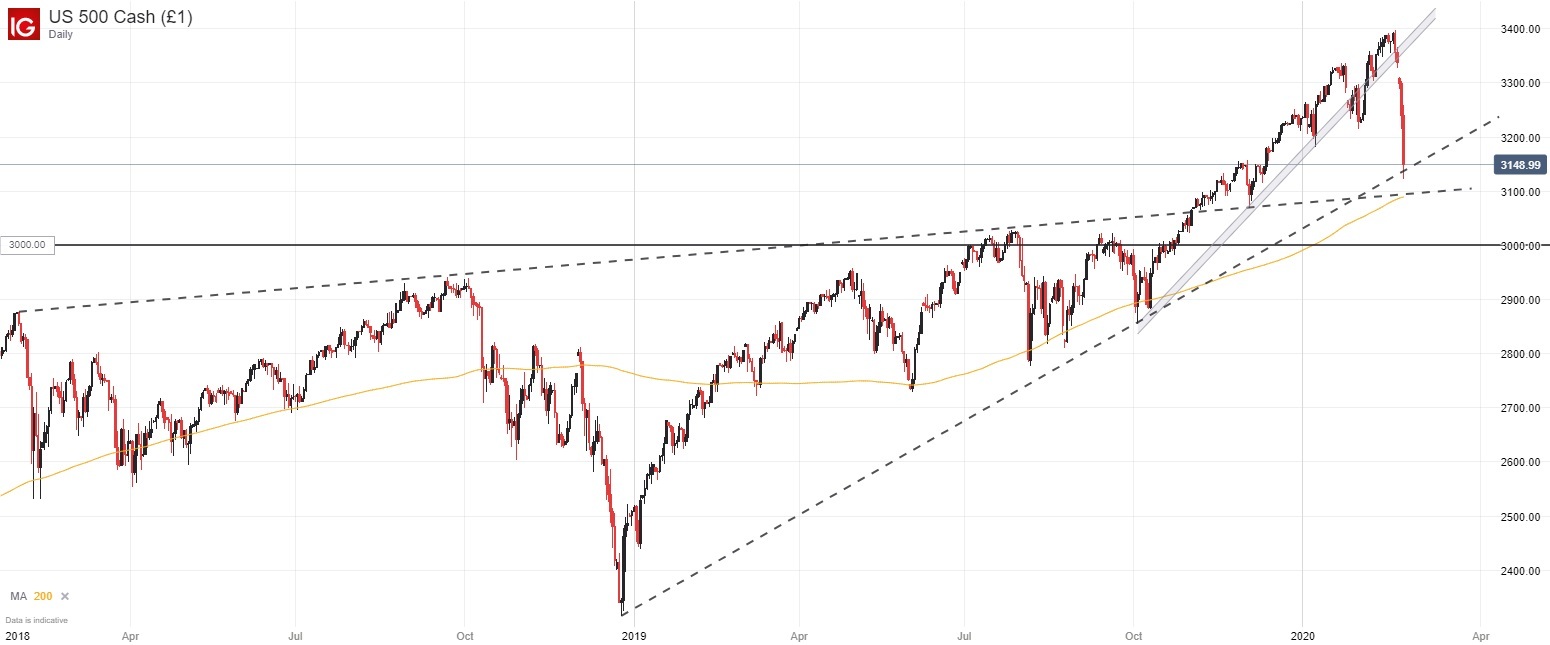
To that end, the S&P 500 finds itself threatening an ascending trendline from December 2018. Thankfully for bulls, subsequent support may exist slightly underneath around the 200-day simple moving average which coincides with a trendline drawn across various swing highs dating back to January 2018.
Dow Jones, Nasdaq 100, DAX 30, Nikkei 225 Forecasts for the Week Ahead
Therefore, the levels at 3,145 and 3,092 may be the next major opportunities for buyers to try and stall declines. Should the area fail to buoy price, it would likely open the door for further losses and bring the 3,000 mark into view. A move to 3,000 would erase another 3.5% of the index’s value.
Nasdaq 100 Technical Forecast
In the case of the Nasdaq 100, declines have been more severe – as is to be expected of the tech-heavy index. Consequently, the 9,000 level was readily cast aside as stocks plunged to subsequent support around the 8,890 level that I outlined yesterday.
Nasdaq 100 Price Chart: 4 – Hour Time Frame (November 2019 – February 2020)
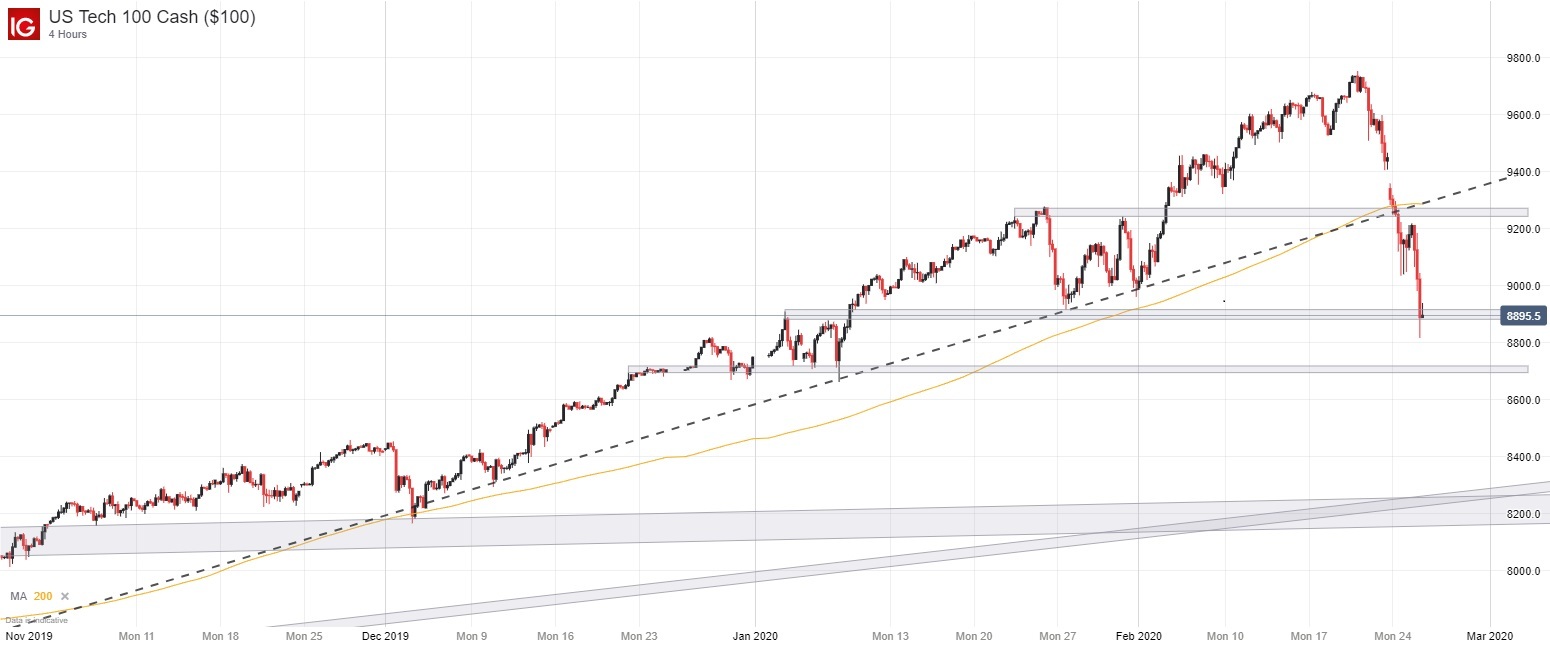
Should selling continue, another horizontal band around 8,700 may provide a modicum of support but the current pace of price action could easily dispel the level. Therefore, confluent support around 8,250 may be called into play should bears continue to drive prices lower.
Starts in:
Live now:
Feb 26
( 16:02 GMT )

Recommended by Peter Hanks
Weekly Stock Market Outlook
A break beneath 8,250 would leave the Nasdaq vulnerable to further declines. For a deeper look at the equity market decline, themes to track and levels to watch, sign up for my weekly equity webinar.
–Written by Peter Hanks, Junior Analyst for DailyFX.com
Contact and follow Peter on Twitter @PeterHanksFX
Be the first to comment