

The US stock market is finally reacting to the coronavirus situation as it becomes more acute. Up until the past few days US indices remained suspended in record territory, but that is changing now with long-term trend support via the 200-day MAs coming under fire. The Dow Jones is already below the threshold (27230 on cash index), while the S&P is another down-day away (3044 on cash index).
For the Dow there is also trend-line support from June to watch around the 200-day, we may see a day this week result into a volatile turnabout as often times happens upon the first test of major long-term support. Trying to catch a bounce isn’t for the faint of heart. Shorts, however, at this juncture do appear to be at high risk of a sharp snapback.
Recommended by Paul Robinson
Check out the Q1 Stock Market Forecast for Our Insights.
Dow Jones Daily Chart (around significant support)
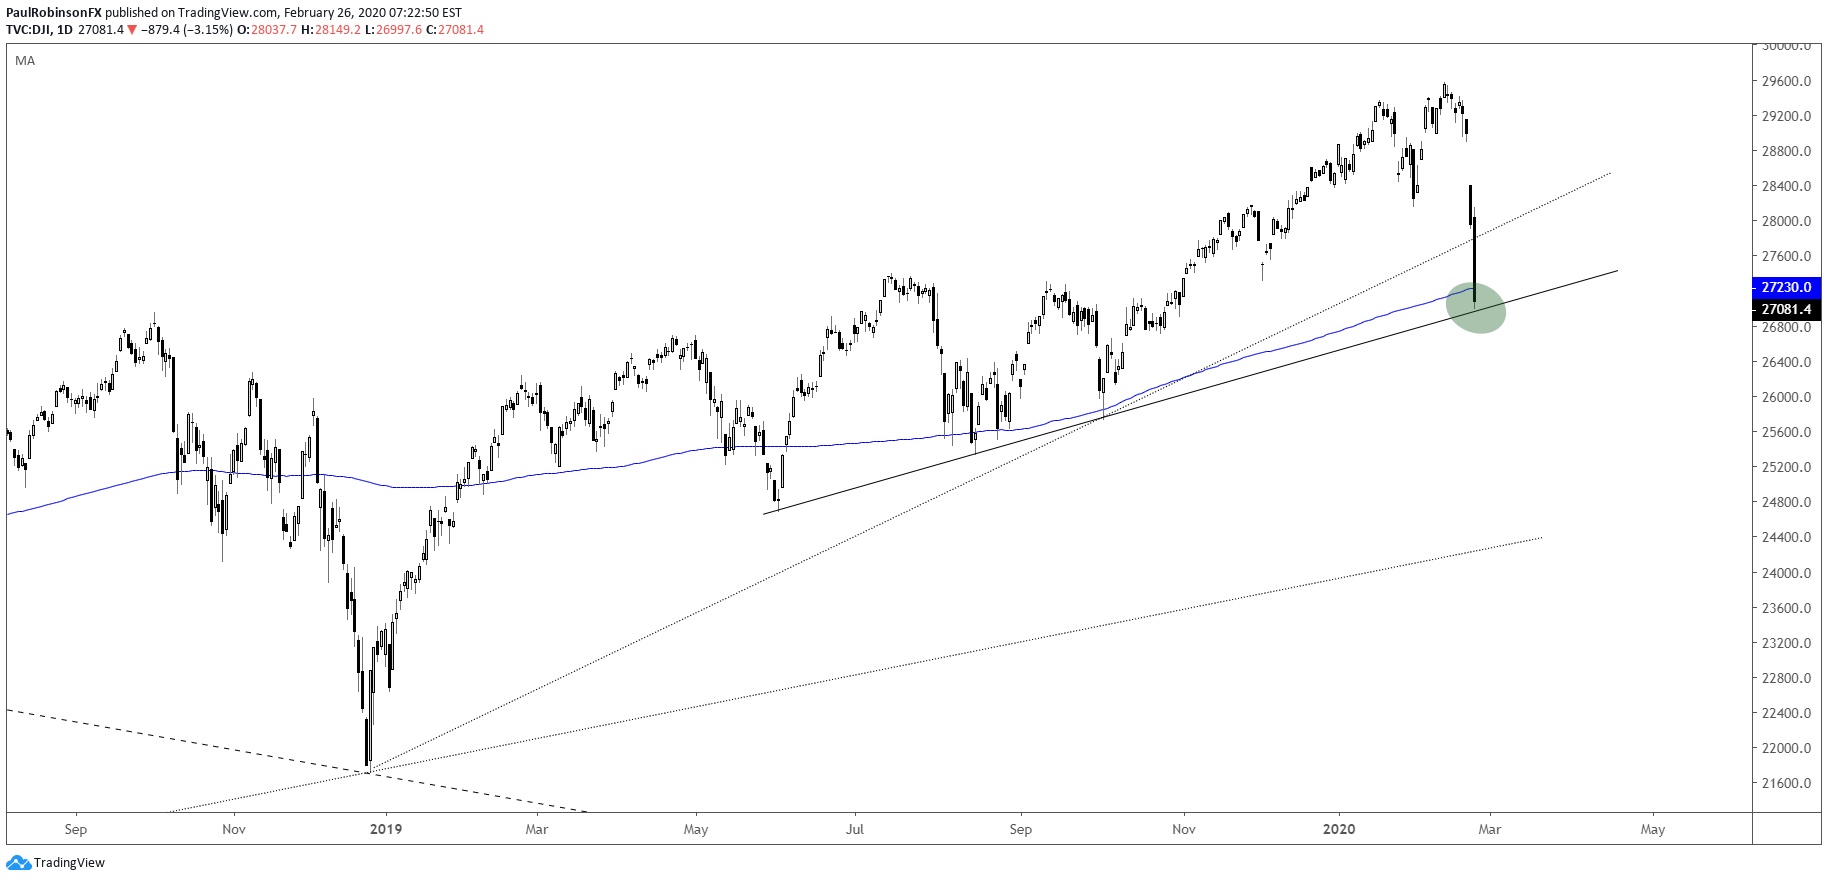
Dow Jones Chart by TradingView
Crude oil is rolling over again following a temporary reprieve. The trend-line from 2016 is getting tested at the moment and could mark an important event. A hold keeps a floor in oil for now, but a breakdown could spell trouble as the next significant level of support isn’t until the December low at 42.20. If we have indeed hit a bit of a panic-point with equities, then look for oil to hold support.
Recommended by Paul Robinson
See what our analysts are watching in Crude Oil.
Crude Oil Daily Chart (trading at 2016 trend-line)
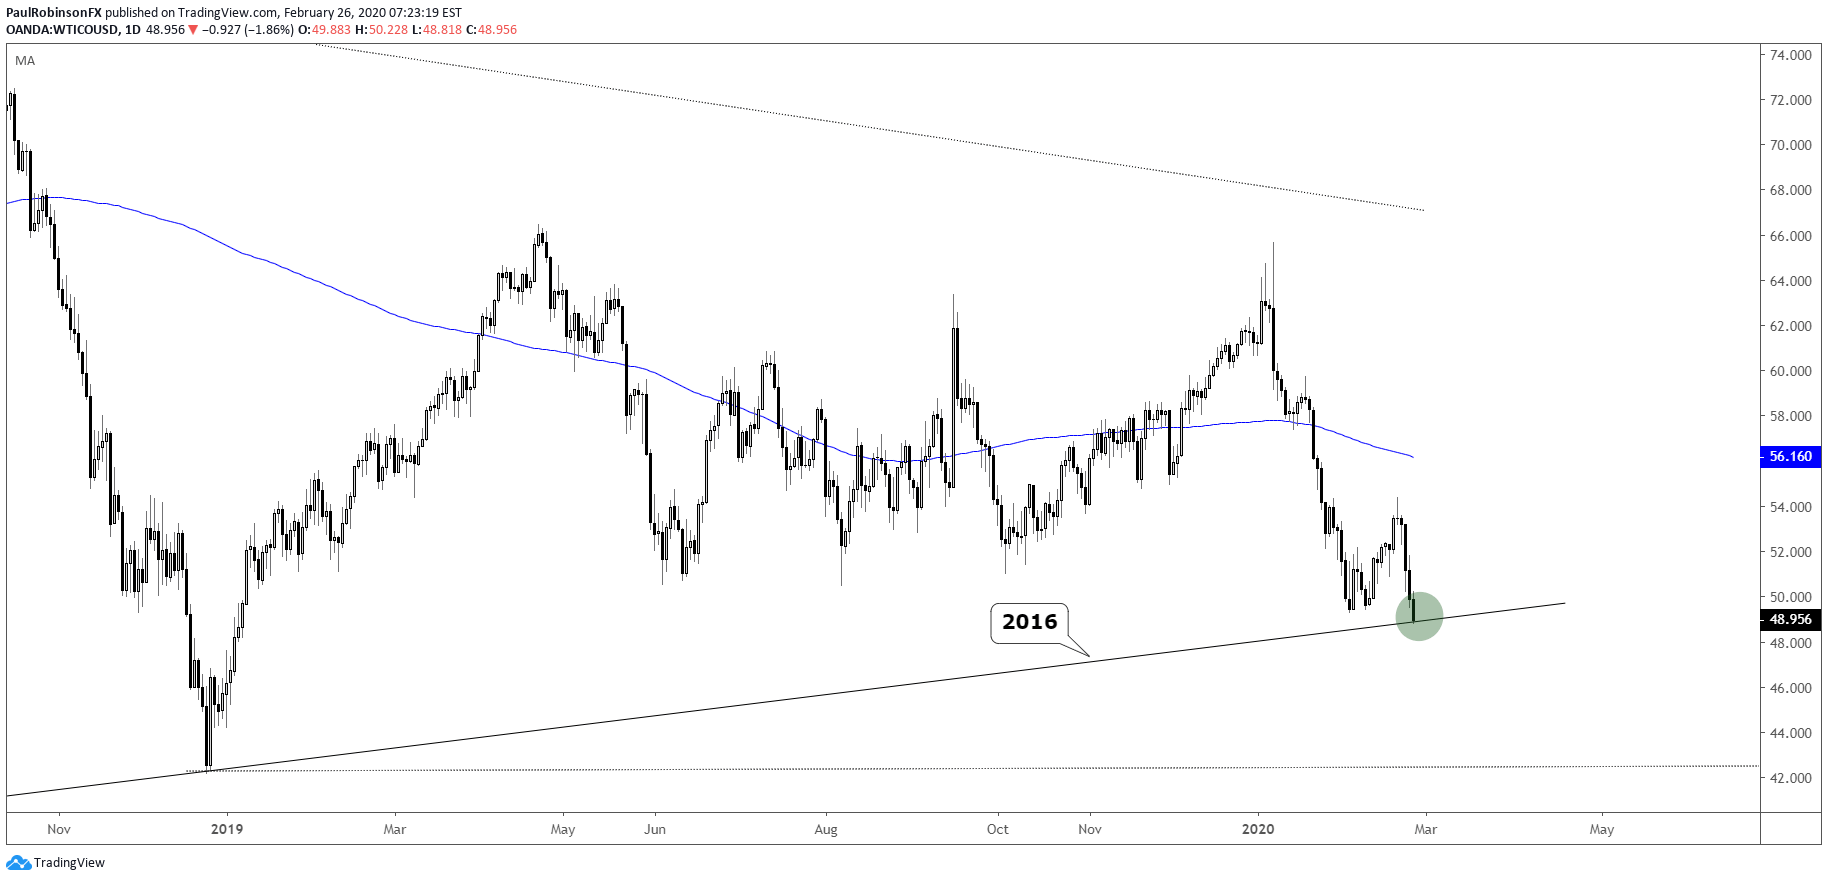
Crude Oil Chart by TradingView
Gold was ramping up on haven flows, but has run out of steam the past couple of days. If we see even a minor bounce in the risk-trade, then look for gold to trade off as fear abates. Overall, though, gold is still sitting bullish in the big-picture. There may be an upper hand here soon for short-term, nimble traders to establish shorts, but broadly the bias is towards weakness becoming buying opportunities.
Recommended by Paul Robinson
Do you trade gold? Check out our forecast.
Gold Daily Chart (may retreat a bit)

To see all the charts we looked at, check out the video above…
Resources for Index & Commodity Traders
Whether you are a new or an experienced trader, DailyFX has several resources available to help you; indicator for tracking trader sentiment, quarterly trading forecasts, analytical and educational webinars held daily, and trading guides to help you improve trading performance.
We also have a series of guides for those looking to trade specific markets, such as the S&P 500, Dow, DAX, gold, silver, crude oil, and copper.
—Written by Paul Robinson, Market Analyst
You can follow Paul on Twitter at @PaulRobinsonFX
Be the first to comment