

Chainarong Prasertthai/iStock via Getty Images
This dividend ETF (exchange-traded fund) article series aims at evaluating products regarding the relative past performance of their strategies and quality metrics of their current portfolios. Holdings and their weights change over time: reviews are updated when necessary.
DON strategy and portfolio
The WisdomTree MidCap Dividend Fund (NYSEARCA:DON) has 342 holdings, a distribution yield of 2.64%, and an expense ratio of 0.38%. Distributions are monthly. It has been tracking the WisdomTree U.S. MidCap Dividend Index since 06/16/2006.
As described in the prospectus by WisdomTree, the underlying index selects companies in the top 75% of the market capitalization of the WisdomTree U.S. Dividend Index after the 300 largest companies have been removed. They are weighted annually based on paid dividends (not yields). The fund invests exclusively in U.S. companies, about 71% mid-caps and 29% small-caps.
The portfolio is well diversified: less than 12% is in the top 10 holdings, listed below with some basic ratios.
|
Ticker |
Name |
Weight % |
EPS growth % ttm |
P/E ttm |
P/E fwd |
Yield % |
|
Evergy, Inc. |
1.47% |
8.27 |
17.37 |
17.28 |
3.74 |
|
|
Continental Resources, Inc. |
1.33% |
1401.87 |
11.83 |
5.57 |
1.72 |
|
|
Conagra Brands, Inc. |
1.25% |
-11.44 |
15.07 |
13.84 |
3.85 |
|
|
Cardinal Health, Inc. |
1.25% |
-190.92 |
N/A |
10.13 |
3.77 |
|
|
Coterra Energy Inc. |
1.18% |
213.07 |
12.67 |
5.71 |
2.22 |
|
|
Omnicom Group Inc. |
1.11% |
33.83 |
10.47 |
9.39 |
4.43 |
|
|
Fidelity National Financial, Inc. FNF Group |
1.07% |
7.60 |
4.63 |
5.92 |
4.90 |
|
|
Campbell Soup Co. |
1.01% |
19.18 |
15.00 |
16.58 |
3.15 |
|
|
Organon & Co. |
0.99% |
-30.09 |
6.56 |
6.27 |
3.33 |
|
|
OGE Energy Corp. |
0.96% |
159.85 |
7.47 |
17.50 |
4.56 |
Ratios from Portfolio123
The top sector is financials with 23% of asset value. Compared to the SPDR S&P MidCap 400 ETF (MDY), DON overweights not only financials but also utilities, materials and energy. It underweights technology, industrials and healthcare. Sector composition may change over time.
Sector weights (chart: author; data: Fidelity)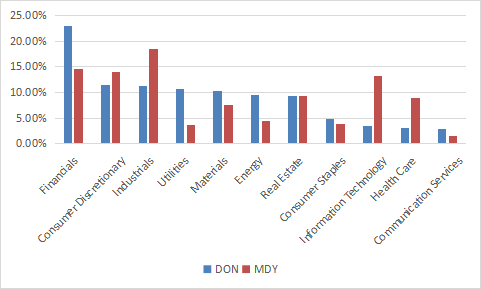
Past performance
Since inception in Jun 2006, DON is very close to MDY in return and risk metrics. Both funds have the same Sharpe ratio, a measure of risk-adjusted performance. They underperform the S&P 500 (SPY) by less than 1 percentage point in annualized return. The next table shows detailed data.
|
Total Return |
Annual.Return |
Drawdown |
Sharpe Ratio |
Volatility |
|
|
DON |
264.37% |
8.42% |
-62.08% |
0.52 |
18.55% |
|
MDY |
271.97% |
8.56% |
-55.37% |
0.52 |
18.73% |
|
SPY |
312.23% |
9.26% |
-55.42% |
0.62 |
15.48% |
*rebalanced annually. Data calculated with Portfolio123
The next chart compares DON and SPY in the last 10 years. Both ETFs were on par until Q1 2019, then DON started underperforming.
DON vs. SPY (Portfolio123)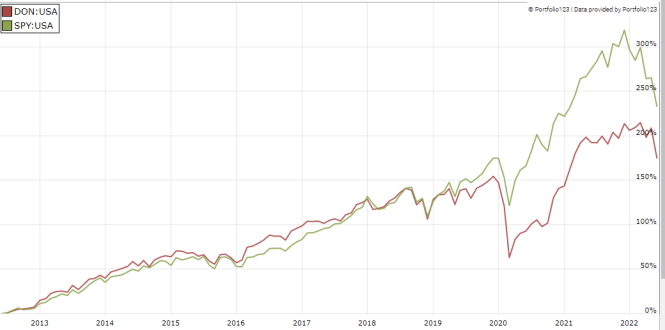
In previous articles, I have shown how three factors may help cut the risk in a dividend portfolio: Return on Assets, Piotroski F-score, and Altman Z-score.
The next table compares DON with a subset of the S&P 500: stocks with an above-average dividend yield, an above-average ROA, a good Altman Z-score, a good Piotroski F-score and a sustainable payout ratio. The subset is rebalanced quarterly to make it comparable with a passive index.
|
Since Inception |
Total Return |
Annual.Return |
Drawdown |
Sharpe Ratio |
Volatility |
|
DON |
264.37% |
8.42% |
-62.08% |
0.52 |
18.55% |
|
Dividend quality subset |
540.17% |
12.30% |
-41.51% |
0.83 |
14.84% |
Past performance is not a guarantee of future returns. Data Source: Portfolio123
DON underperforms the dividend quality subset by 3.88 percentage points in annualized return. However, the ETF performance is real, and this subset is hypothetical. My core portfolio holds 14 stocks selected in this subset (more info at the end of this post).
Scanning DON portfolio
Valuation metrics are a bit cheaper than for MDY, but the difference is not very significant (see next table).
|
DON |
MDY |
|
|
Price/Earnings TTM |
12.43 |
13.61 |
|
Price/Book |
2.17 |
2.27 |
|
Price/Sales |
1.22 |
1.29 |
|
Price/Cash Flow |
10.08 |
11.71 |
I have scanned holdings with the quality metrics described in the previous paragraph. I consider that risky stocks are companies with at least 2 red flags among: bad Piotroski score, negative ROA, unsustainable payout ratio, bad or dubious Altman Z-score, excluding financials and real estate where these metrics are less relevant. With these assumptions, 27 stocks out of 342 are risky, and they weigh less than 9% of asset value, which is acceptable.
Based on my calculation, the aggregate return on assets is superior to MDY’s aggregate value. Altman Z-score Piotroski F-score are not significantly different. These metrics point to a portfolio quality slightly superior to the mid-cap benchmark.
|
DON |
MDY |
|
|
Altman Z-score |
2.54 |
2.79 |
|
Piotroski F-score |
5.8 |
5.7 |
|
ROA% TTM |
6.83 |
5.43 |
Takeaway
DON holds over 300 U.S. dividend stocks in the mid-cap and small-cap segments. Constituents are weighted based on paid dividends. No holding weights more than 1.5%, so the risk related to individual stocks is very low. However, exposure to financials is high: 23% of asset value. Valuation ratios are a bit cheaper than for the mid-cap benchmark S&P 400 index, and quality metrics are a bit better. DON is very close to the S&P 400 in past performance since inception and behind the large-cap S&P 500.
In summary, DON is close to the mid-cap benchmark on many points. It is not a bad product, but it doesn’t seem to have an edge over a simpler and broader index in the same size segment. For transparency, a dividend-oriented part of my equity investments is split between a passive ETF allocation (DON is not part of it) and my actively managed Stability portfolio (14 stocks), disclosed and updated in Quantitative Risk & Value.
Be the first to comment