Mexican Peso Technical Price Outlook: USD/MXN Near-term Trade Levels
- Mexican Peso updated technical trade levels – Weekly & 240min Charts
- USD/MXN recovery responding to confluence resistance
- Risk for a deeper correction while below 25.3556.
The US Dollar rallied more than 8.6% off the April lows against the Mexican Peso with USD/MXN responding to key downtrend resistance late-last week. While the broader outlook remains constructive, the recent advance remains vulnerable while below this threshold as we head into the close of the month. These are the updated targets and invalidation levels that matter on the USD/MXN technical price charts. Review my latest Strategy Webinar for an in-depth breakdown of the setupswe’re tracking this week.
Starts in:
Live now:
May 04
( 12:05 GMT )
Live Weekly Strategy Webinars on Mondays at 12:30GMT
Weekly Scalping Webinar
Mexican Peso Price Chart – USD/MXN Weekly
Chart Prepared by Michael Boutros, Technical Strategist; USD/MXN on Tradingview
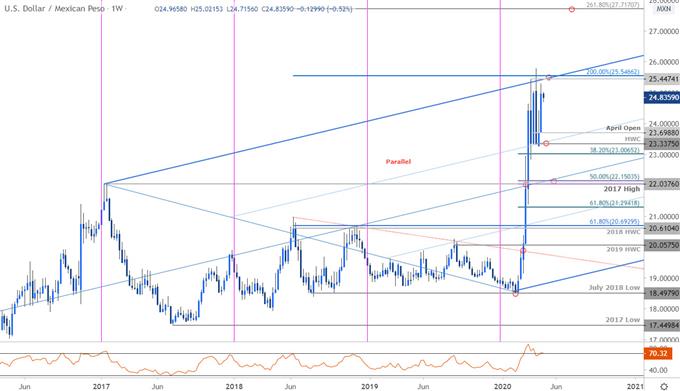
Technical Outlook:In my last Mexican Peso Price Outlook we noted that USD/MXN remained vulnerable after responding to multi-year uptrend resistance at “25.4474/5466 – a region defined by pitchfork resistance, the March high and the 200% extension of the 2017 advance.” The threat of a deeper setback remains while below this threshold with Peso continuing to trade within the confines of a massive range over the past three weeks.
Monthly open support rests at 23.6988 with a break below the record high-week close at 23.3375 needed to shift the broader focus lower- subsequent support objectives eyed at the 38.2% retracement at 23.0065 and the 2017 high / 50% retracement at 22.0376/1503– look for a bigger reaction there IF reached. A topside breach / close above the upper parallel would be needed to validate a breakout to fresh record highs with the 2.618% ext eyed at 27.7170.
Mexican Peso Price Chart – USD/MXN 240min
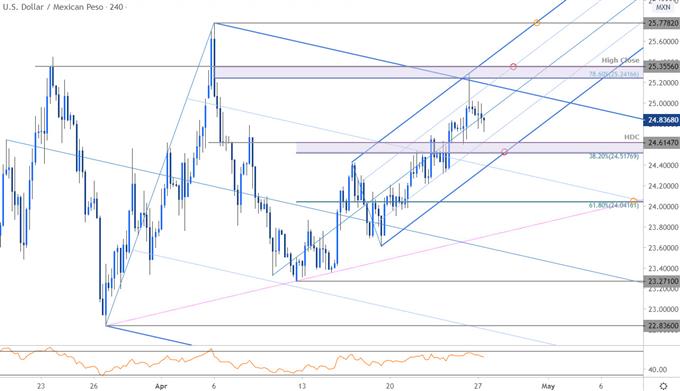
Notes: A closer look at Peso price action shows USD/MXN trading within the confines of a descending pitchfork formation extending off the monthly high with an embedded ascending formation guiding this recent advance. Note that price stretched into confluence resistance at 25.2416/3556 on Friday before reversing sharply with the immediate advance at risk while below the high close / 78.6% retracement. Interim support rests at 24.5177/6147 – look for a reaction there IF reached with a break lower needed to shift the focus lower towards the 61.8% retracement at 24.0416.


Recommended by Michael Boutros
Download Our Latest Quarterly US Dollar Price Forecasts!
Bottom line: The recent USD/MXN recovery remains vulnerable while within this descending formation. Form at trading standpoint, the immediate focus is on a break of the 24.5177–25.3556 range for guidance. Be on the lookout for topside exhaustion while below the upper parallel with a break below up-slope support needed to shift the focus lower.
For a complete breakdown of Michael’s trading strategy, review his Foundations of Technical Analysis series on Building a Trading Strategy
—
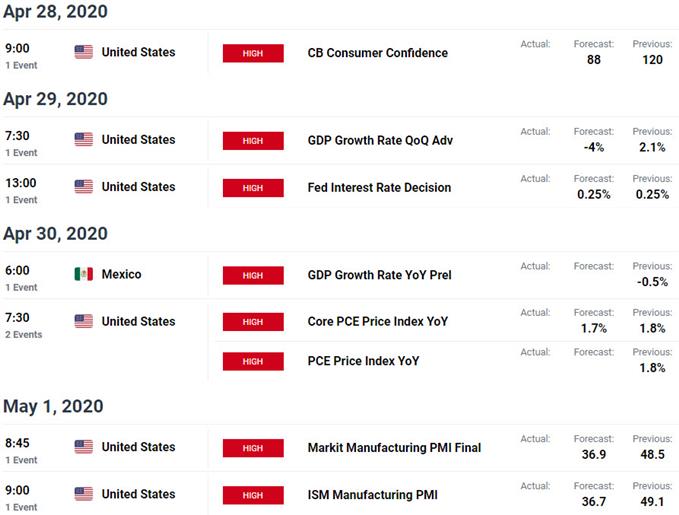
Key US / Mexico Data Releases
Economic Calendar – latest economic developments and upcoming event risk.
Previous Weekly Technical Charts
— Written by Michael Boutros, Technical Strategist with DailyFX
Follow Michael on Twitter @MBForex


Be the first to comment