

Michael Vi
Thesis
We present an update on DocuSign, Inc. (NASDAQ:DOCU), as there have been significant updates to our thesis over the past month. Notably, the company delivered another quarter of disappointing guidance, culminating with ex-CEO Dan Springer leaving the company shortly after its Q1 card.
Q1’s weak guidance also invalidated our previous Buy thesis, as the market justifiably battered DOCU. Given the developments, we have also revised our model and believe that the slowdown could be longer than expected.
DOCU has also significantly underperformed its broad software peers and the Invesco QQQ ETF (QQQ) from its May bottom. Our price action analysis indicates a near-term bottom. However, we need DOCU to demonstrate more constructive signals to indicate accumulation, given its current bearish bias.
As a result, we revise our rating from Buy to Hold as we bide our time for the price action to play out.
Why Did DOCU Stock Dip?
Under Springer’s leadership, DocuSign’s execution over the past year has been very poor. As a result, it didn’t prepare well enough for the reopening phase, as the unprecedented surge in its pandemic-induced growth overstated the strength and resilience of its underlying drivers.
Furthermore, DOCU has had significant challenges keeping its sales force, as it also succumbed to The Great Resignation, as Springer accentuated: “We’ve had to retool the field organization. That’s been a challenge.”
DocuSign remaining purchase obligations [RPO] (Company filings)![DocuSign remaining purchase obligations [RPO]](https://static.seekingalpha.com/uploads/2022/7/16/51630113-16580271735307267_origin.png)
As a result, several of its underlying metrics continued to weaken significantly. As seen above, DocuSign’s remaining purchase obligations (RPO) growth fell to 33.3% in FQ1’23, down markedly from FQ4’s 45.5%. It was also a significant decline from FQ1’22’s 52.9% growth.
DocuSign billings (Company filings)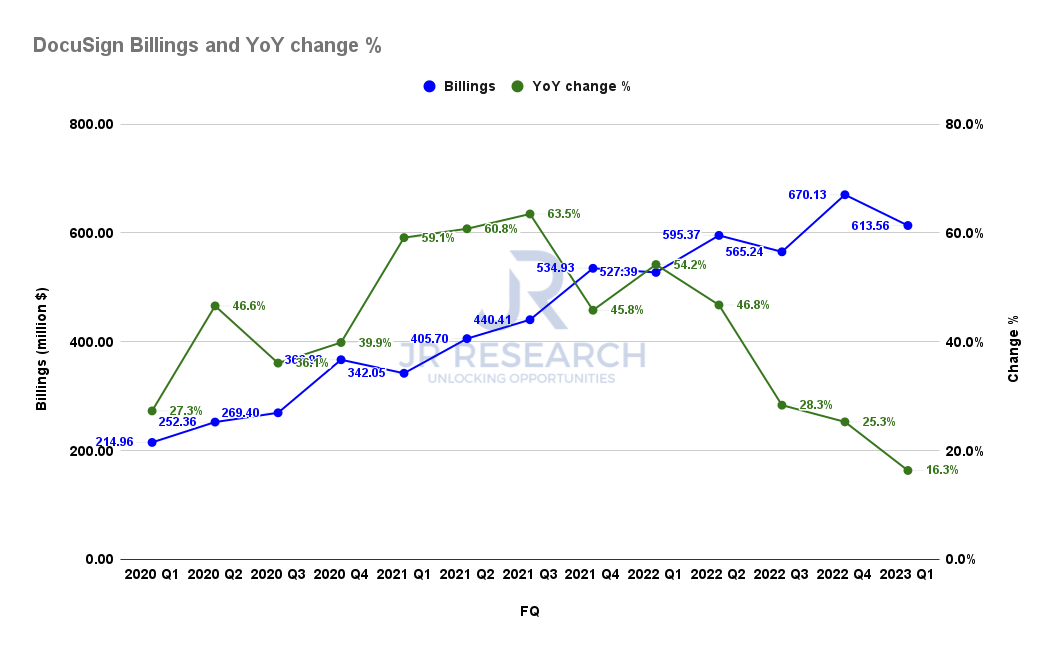
Moreover, DocuSign’s billings health has also suffered tremendously, as its growth slowed to 16.3% in FQ1. It was also down substantially from Q4’s 25.3% increase and FQ1’22’s 54.2% growth. For a high-growth stock, such growth normalization will not be welcomed by the market.
Furthermore, DocuSign revised its billings guidance for Q2’23 and FY23. Management guided billings growth of 14.5% YoY (mid-point) in FQ2 and 7.3% (mid-point) for FY23. Therefore, DocuSign’s billings growth deceleration is expected to continue through FY23 as the market adjusts to its new realities.
Is DocuSign Going To Go Back Up?
DocuSign revenue change % and adjusted EBIT change % consensus estimates (S&P Cap IQ)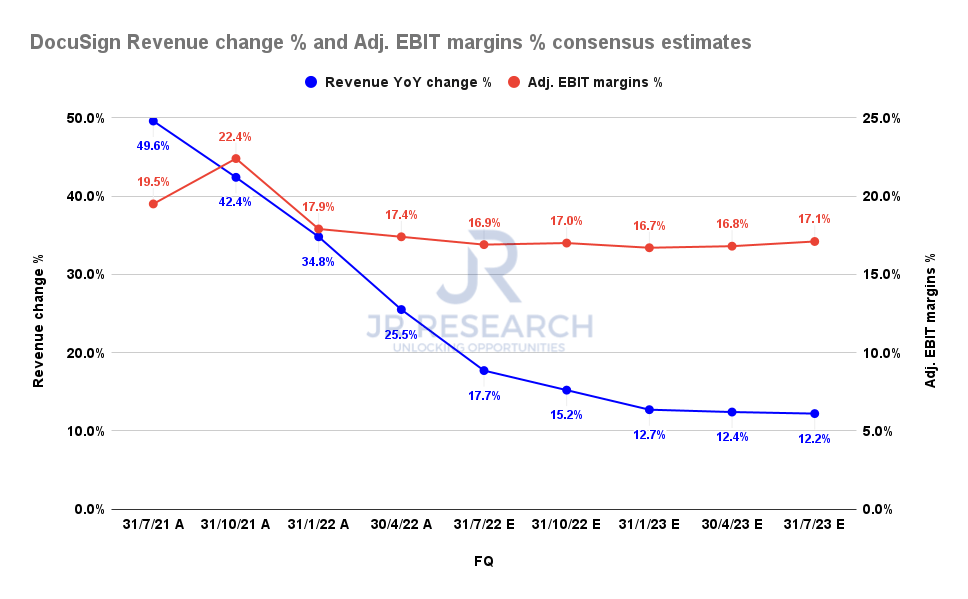
The revised consensus estimates (neutral) point to a continued slowdown in its revenue growth through FQ2’24. Therefore, investors should not expect the turnaround to come anytime soon.
DocuSign revenue change % and adjusted EBITDA change % consensus estimates (By FY) (S&P Cap IQ)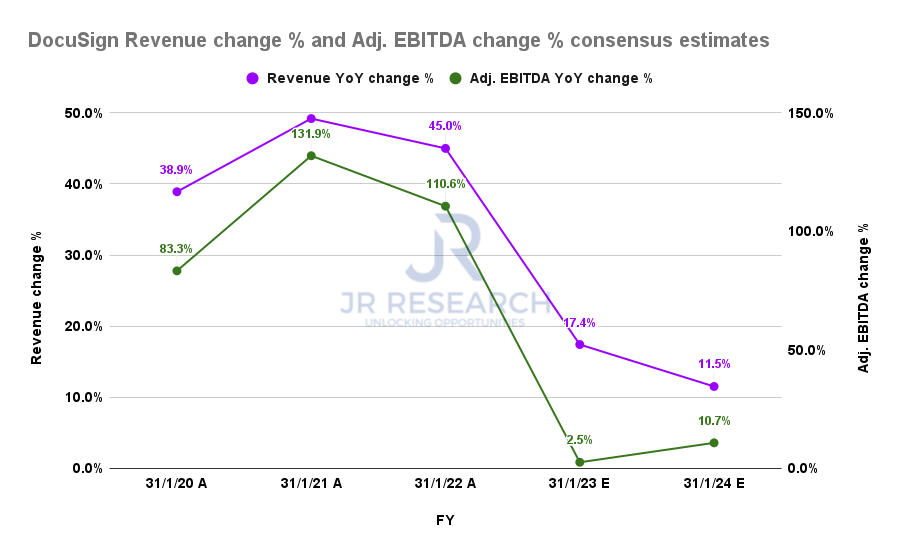
Notwithstanding, given the massive deceleration expected in FY23, DocuSign’s revenue growth is expected to reach a nadir before recovering in FY24. However, it’s not likely to be a spectacular recovery but a somewhat tepid one.
The Street’s consensus suggests that DocuSign could post revenue growth of 11.5% in FY24. Furthermore, its adjusted EBITDA profitability growth is also expected to be impacted by the deceleration in its revenue profile.
Consequently, we believe investors need to model DocuSign’s much slower growth profile accordingly in their valuation models.
Is Now A Good Time To Buy DocuSign?
| Stock | DOCU |
| Current market cap | $12.68B |
| Hurdle rate [CAGR] | 12% |
| Projection through | CQ4’26 |
| Required FCF yield in CQ4’26 | 4.5% |
| Assumed TTM FCF margin in CQ4’26 | 19% |
| Implied TTM revenue by CQ4’26 | $4.98B |
DOCU reverse cash flow valuation model. Data source: S&P Cap IQ, author
Given DOCU’s revised growth profile, we don’t think it’s appropriate to accord it as a “high-growth” stock any longer until the new management can prove its execution moving forward.
As a result, we believe the market correctly de-rated DOCU to adjust for a slower-growth trajectory, requiring much higher free cash flow (FCF) yields accordingly.
We applied a market-perform hurdle rate of 12% in our model, with a 4.5% FCF yield. DOCU last traded at an FY25 FCF yield of 5.06%. We also used a more conservative blended FCF margin of 19% and derived a TTM revenue target of $4.98B by CQ4’26.
We believe that DocuSign could struggle to meet our revenue target at the hurdle rate we applied. Therefore, the market could expect DOCU to continue underperforming, moving ahead.
DOCU Needs To Base Constructively
DOCU price chart (monthly) (TradingView)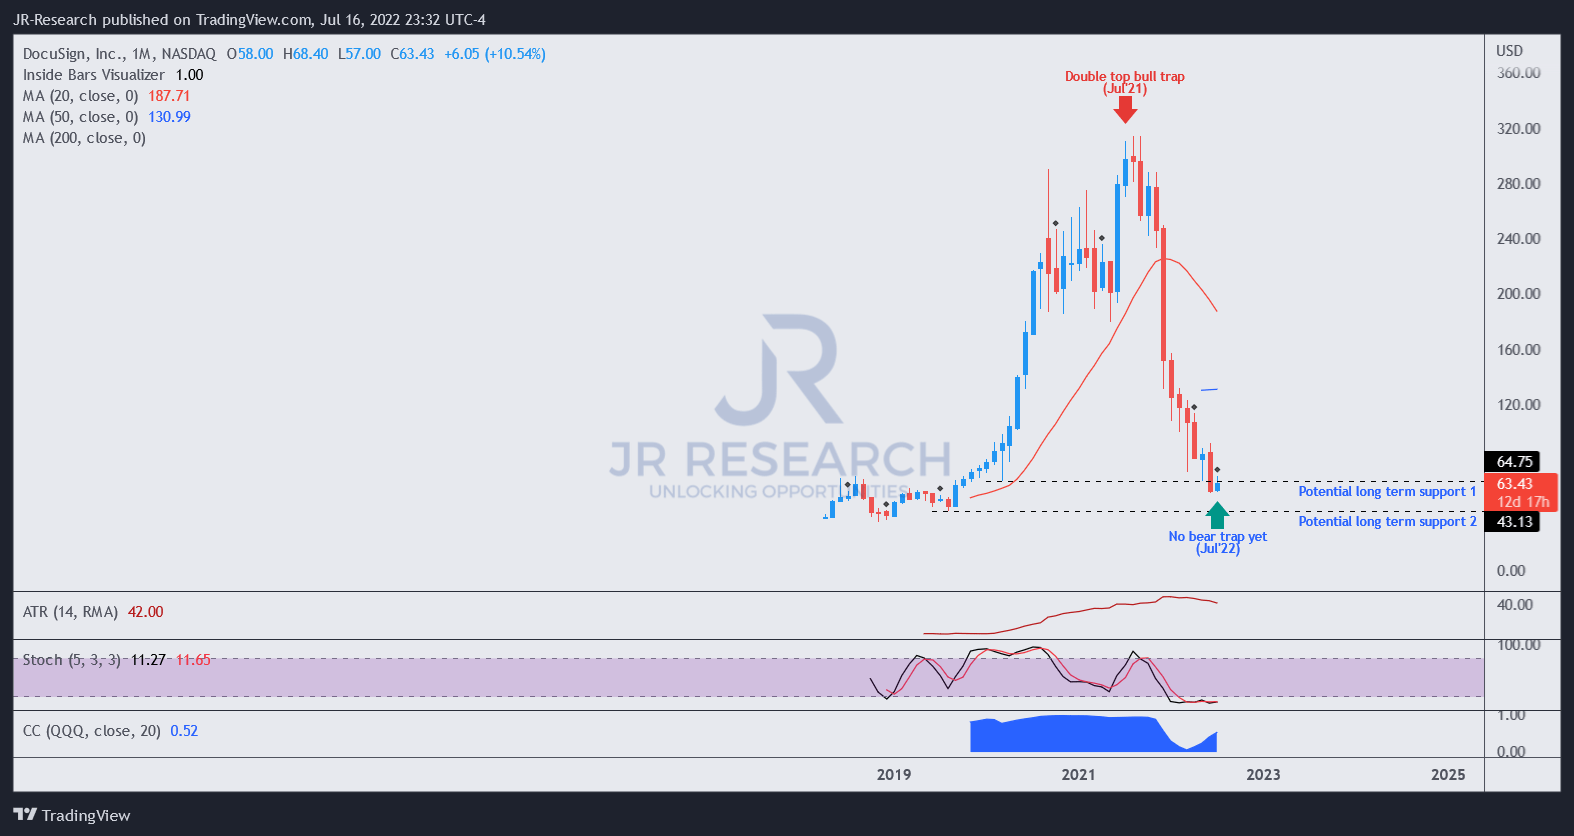
As seen above, DOCU is likely at a near-term bottom and could be undergirded by its long-term support 1 zone. However, the lower lows in June invalidated our May Buy thesis. Consequently, we require DOCU to demonstrate more constructive signals to suggest that the market intends to hold its current support zone.
Even though its long-term technicals are oversold, we urge investors to give higher precedence to price action. Stocks can remain oversold for an extended period in a downtrend.
DOCU price chart (weekly) (TradingView)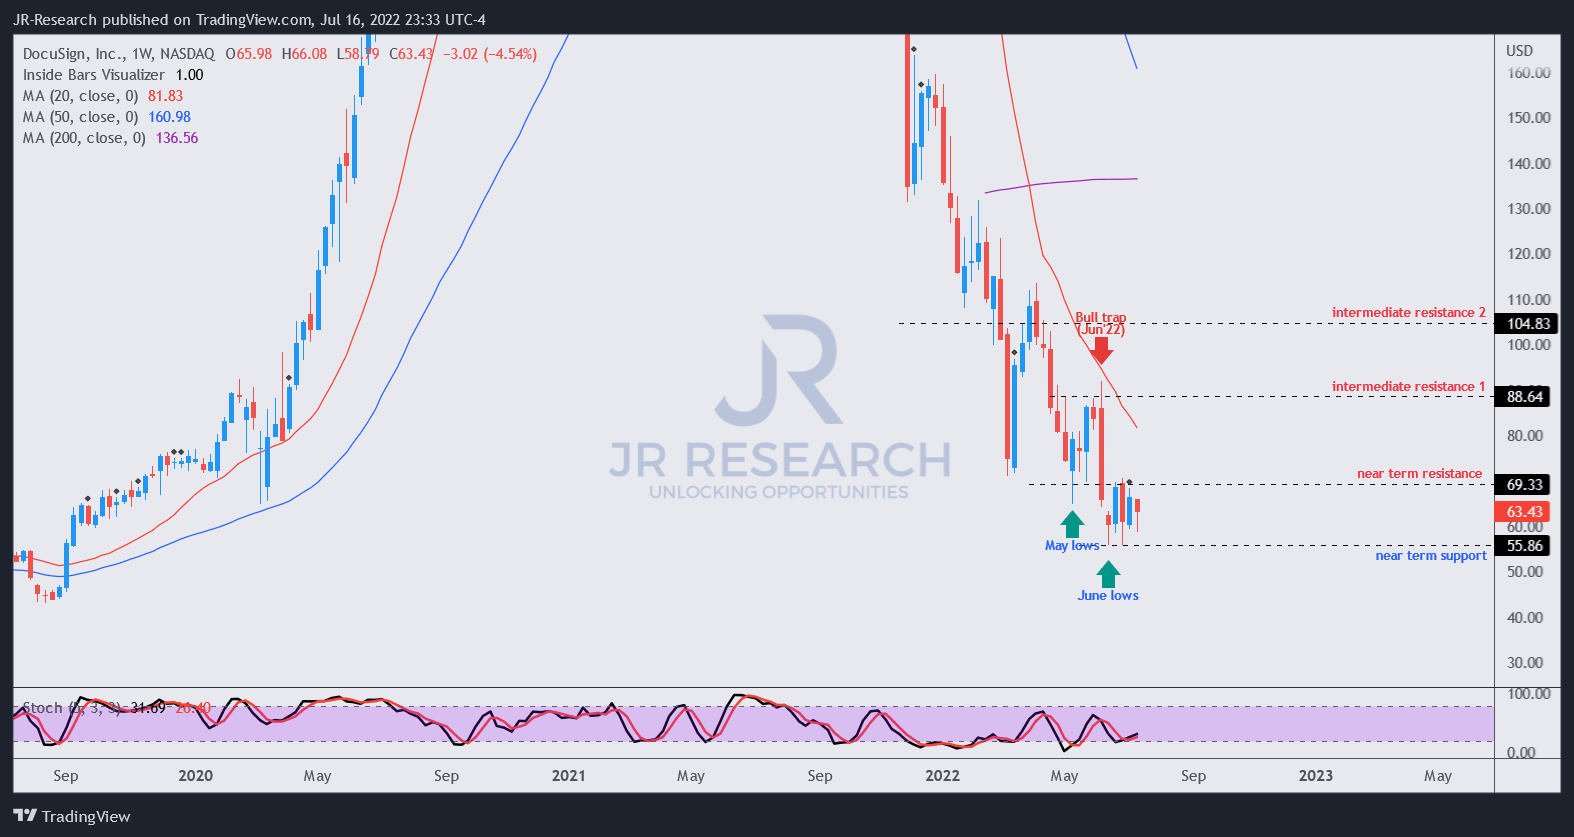
In DOCU’s medium-term chart, we observed a newly formed resistance zone that supported DOCU’s bottom in May. Therefore, we also don’t observe any constructive signals to suggest that the risk/reward profile is favorable in DOCU, even though there’s a bullish divergence signal on its stochastic.
We also have not observed a bear trap (significant rejection of selling momentum) in DOCU’s medium- and long-term charts.
Is DOCU Stock A Buy, Sell, Or Hold?
We revise our rating on DOCU from Buy to Hold for now.
DocuSign could be entering a new phase of much slower growth. Therefore, we believe it’s appropriate for investors to adjust their valuation models to account for stocks with a slower-growth profile. As a result, we think it’s apt for the market to demand higher FCF yields to compensate for the potential risk of weak execution and slower growth.
Our price action analysis suggests a near-term bottom. However, we have not yet observed a sustained bottoming on its long-term chart. Also, we have not seen any bear trap price action that can help reverse its bearish bias.
Be the first to comment