


Adrian Vidal
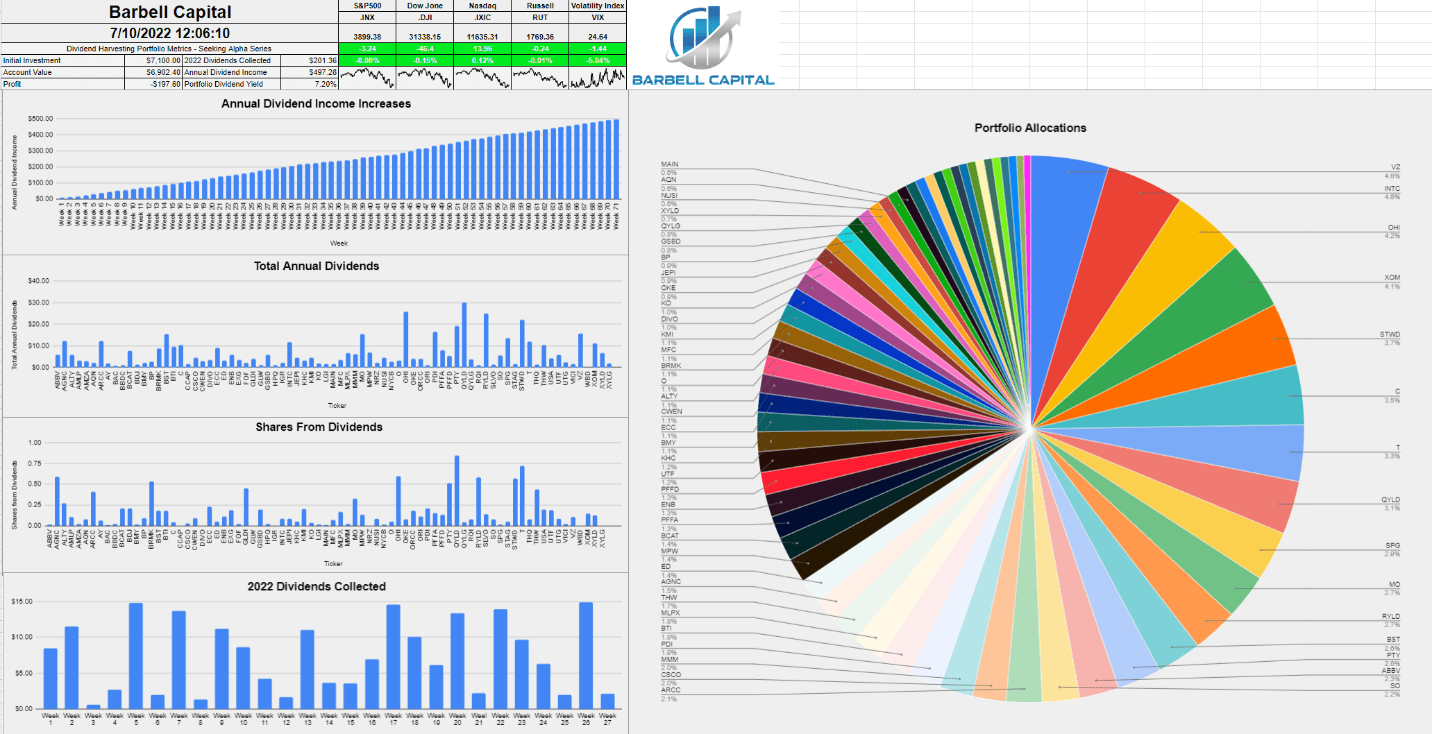
The Dividend Harvesting portfolio couldn’t snap the 3-week losing streak in week 71. The Dividend Harvesting portfolio finished in the red once again, extending its streak of finishing in the red to 4 consecutive weeks. I have allocated $7,100 over 71 weeks to the Dividend Harvesting portfolio, and at the close of week 71, I was down -$197.60 or -2.78%. I feel it’s important to emphasize that this style of investing isn’t impervious to market dynamics or seeing negative returns. The Dividend Harvesting portfolio has now finished 65/71 weeks in the black with a 91.55% positive weekly track record. I am not unhappy with the results, and while it was nice having a long-running record of positive weeks, being down -2.78% while the market has had its worst first half in 50 years is perfectly acceptable to me. Eventually, the tide will turn, and the Dividend Harvesting portfolio will be back to forming a string of positive weeks. I am looking at weeks like these as opportunities to add at lower valuations on positions I want to hold for the long term.
There are now 77 individual positions in the Dividend Harvesting portfolio, of which 76 positions pay a dividend or distribution. I am still sitting on my shares of Warner Bros Discovery (WBD) from the AT&T (T) spinoff, which is the only position that does not have an income component to it. The total positions are producing a projected $497.28 in annual dividends, which is a forward yield of 7.2%. At this rate, I believe I will close out 2022 with $9,600 allocated to the Dividend Harvesting portfolio, and it will be generating roughly $700 in annual dividends.
On Monday, when the market was crashing, I added to my position in Citigroup (C), and Intel Corporation (INTC), while adding a new position to the Dividend Harvesting portfolio. I had written a dedicated article on the CBRE Global Real Estate Income Fund (IGR) (can be read here) and felt it would be a good addition as it provides global exposure to real estate, managed by the largest commercial real estate firm. My laundry list continues to grow, and I find myself constantly thinking about which companies I want to add in the following week. The hardest thing has been keeping the weekly allocation amount at $100 in this series as there are so many positions that I believe are on sale. I did make the decision that I would keep the allocation amount at $100 because that was the premise of this series. While it’s not always fun seeing positions lower than they previously were, I am enjoying these opportunities as I continue to allocate capital in the Dividend Harvesting portfolio and in my other accounts. Regardless if the market turns in the fall, in 2023, or 2024, this bear market will end, and eventually, this period will be looked at as a great buying opportunity.
I allocate capital toward big tech, funds, dividends, and growth outside of my retirement accounts. These are not my only investments, but I did open a separate account, so I could easily track and document this series. I intentionally created broad diversification throughout the Dividend Harvesting portfolio so I could benefit from sector rotations and mitigate my downside risk. Investors who are too exposed to growth companies or large-cap tech have gotten crushed as the investment landscape changes. On the growth and tech side of my investments, I am feeling the pain as some of my favorite companies, including Alphabet (GOOGL) (GOOG), Amazon (AMZN), and Meta Platforms (META), have been taken to the woodshed.
This series has never been about hitting a target yield, generating a certain amount of profit, or beating the market. I had two specific goals with this series. The first was to create a blueprint for constructing a dividend portfolio by documenting the journey starting from the beginning. The second goal was to illustrate how allocating capital each week toward investing, regardless of the amount, would be beneficial in the long run.
Too many people are under the illusion that you need tens of thousands or even hundreds of thousands to benefit from investing. Instead of using my real dividend portfolio as an example, I decided to start a new account, fund it with $100, and add $100 weekly, providing a step-by-step guide to dividend investing. This methodology doesn’t have to be used for dividend investing, and it could be as simple as an S&P index fund or a Total Market fund. Hopefully, this series is inspiring people to invest in their future to attain financial freedom.
Steven Fiorillo
A Historical Recap Of The Dividend Harvesting Portfolio’s Investment Principles And Historical Performance
Below are the fundamental rules I have put in place for this portfolio:
- Allocate $100 weekly to this portfolio
- Only invest in dividend-producing investments
- No position can exceed 5% of the portfolio
- No sector can exceed 20% of the portfolio
- All dividends & distributions are to be reinvested
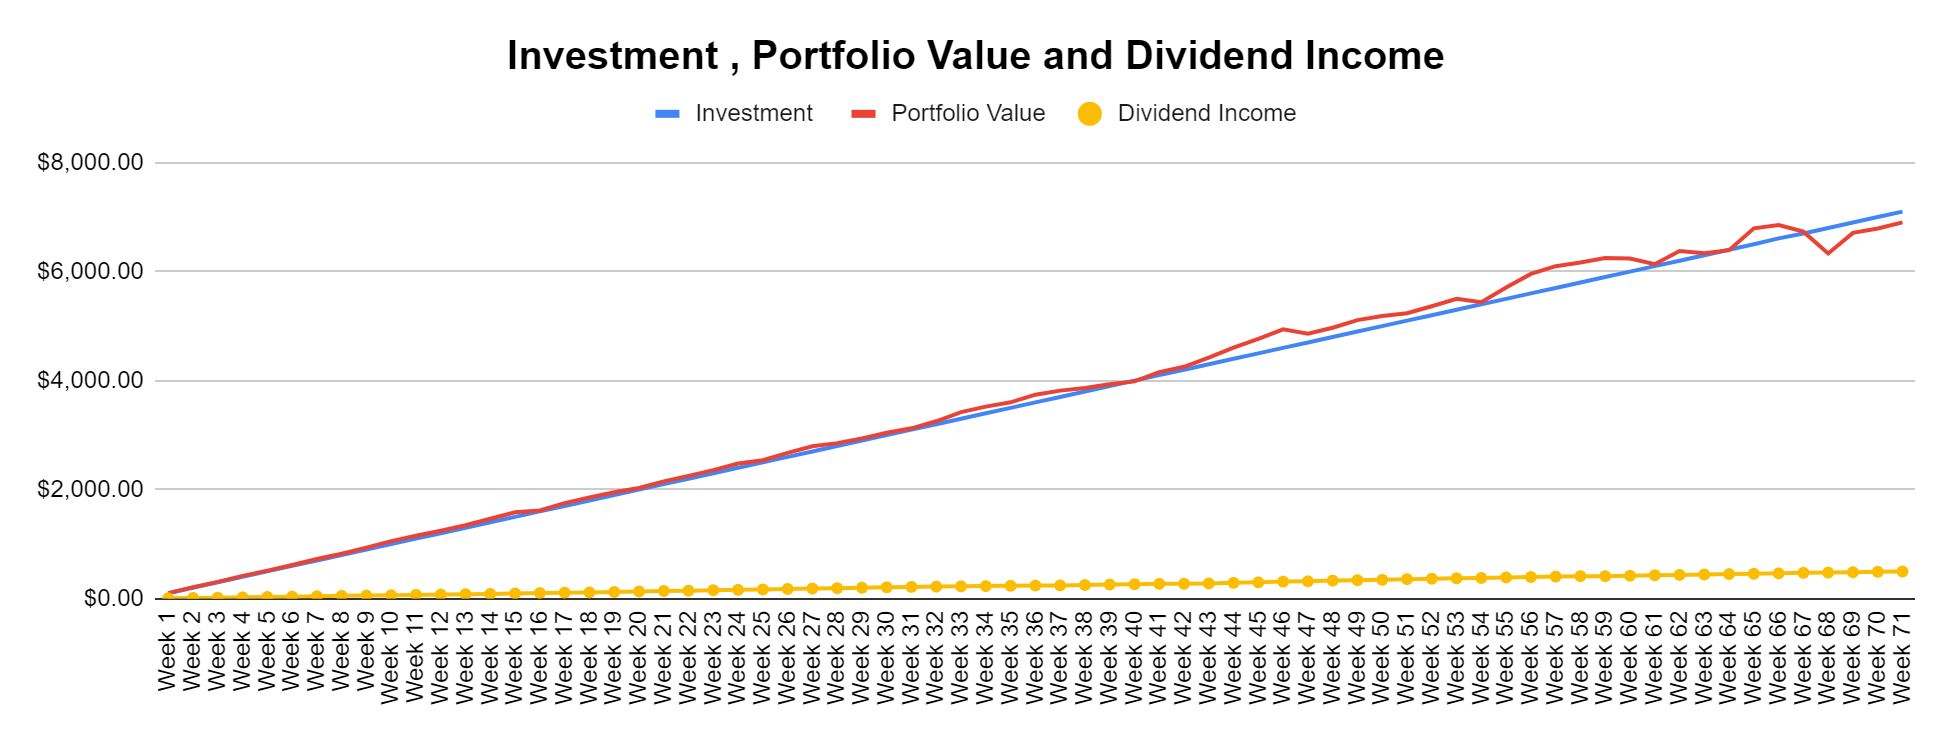
Below is a chart that extends from week 1 through the current week to illustrate the Dividend Harvesting Portfolio’s Progression
- Blue line is my initial investment $100 in week 1, $1000 in week 10, etc.
- Red line is the account value at the end of each week
- Yellow line is the annual dividend income the Dividend Harvesting Portfolio was projected to generate after that week’s investments and dividends reinvested
Steven Fiorillo
The Dividend Harvesting Portfolio Dividend Section
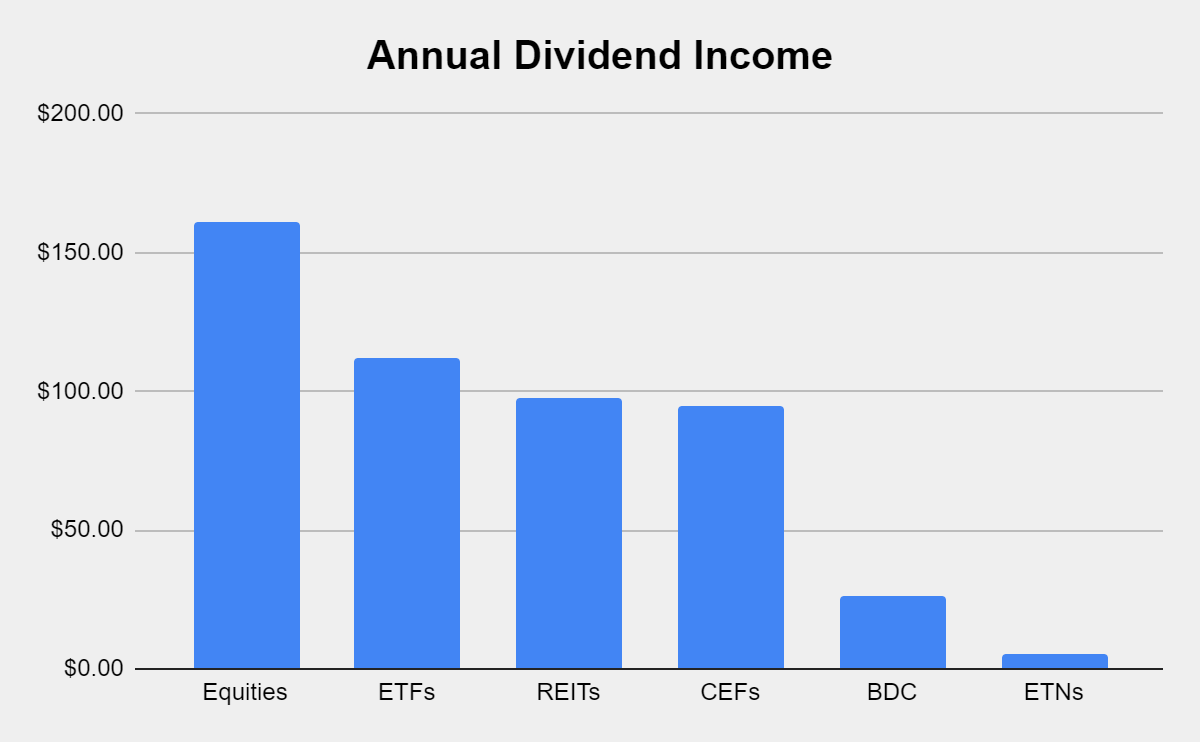
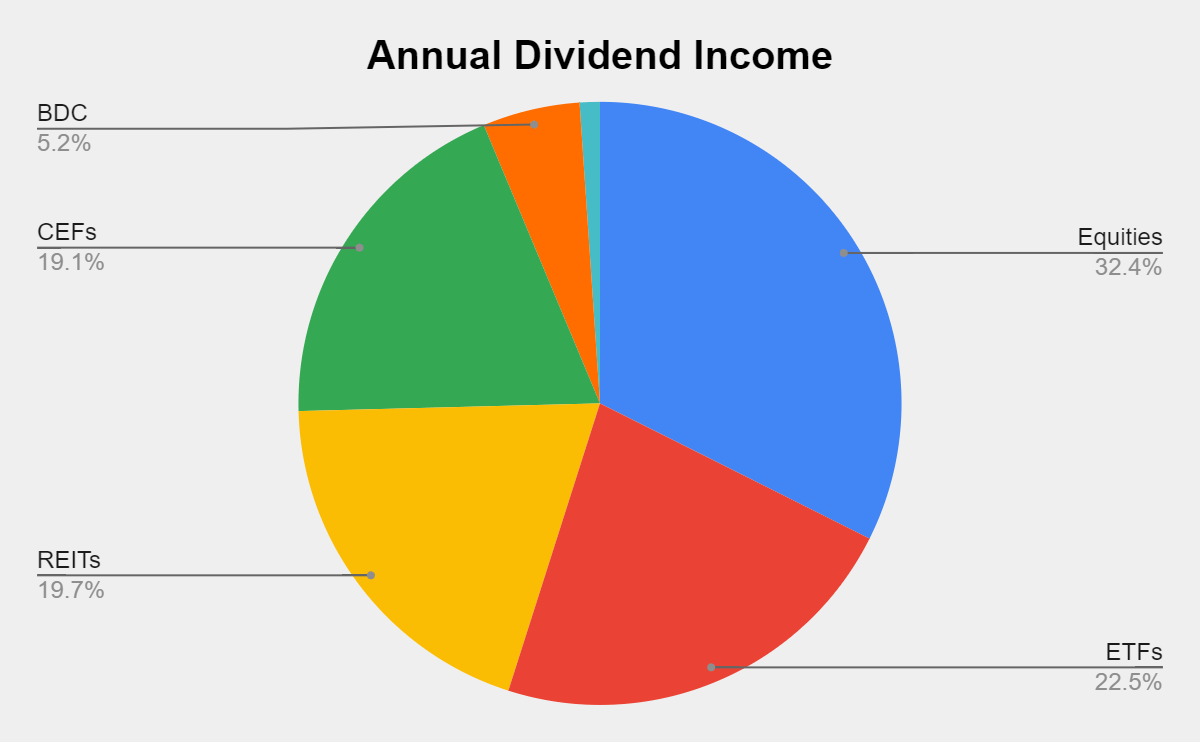
Here is how much dividend income is generated per investment basket:
- Equities $161.12 (32.40%)
- ETFs $111.95 (22.51%)
- REITs $97.85 (19.68%)
- CEFs $95.03 (19.11%)
- BDC $25.94 (5.22%)
- ETNs $5.38 (1.08%)
Steven Fiorillo
Steven Fiorillo
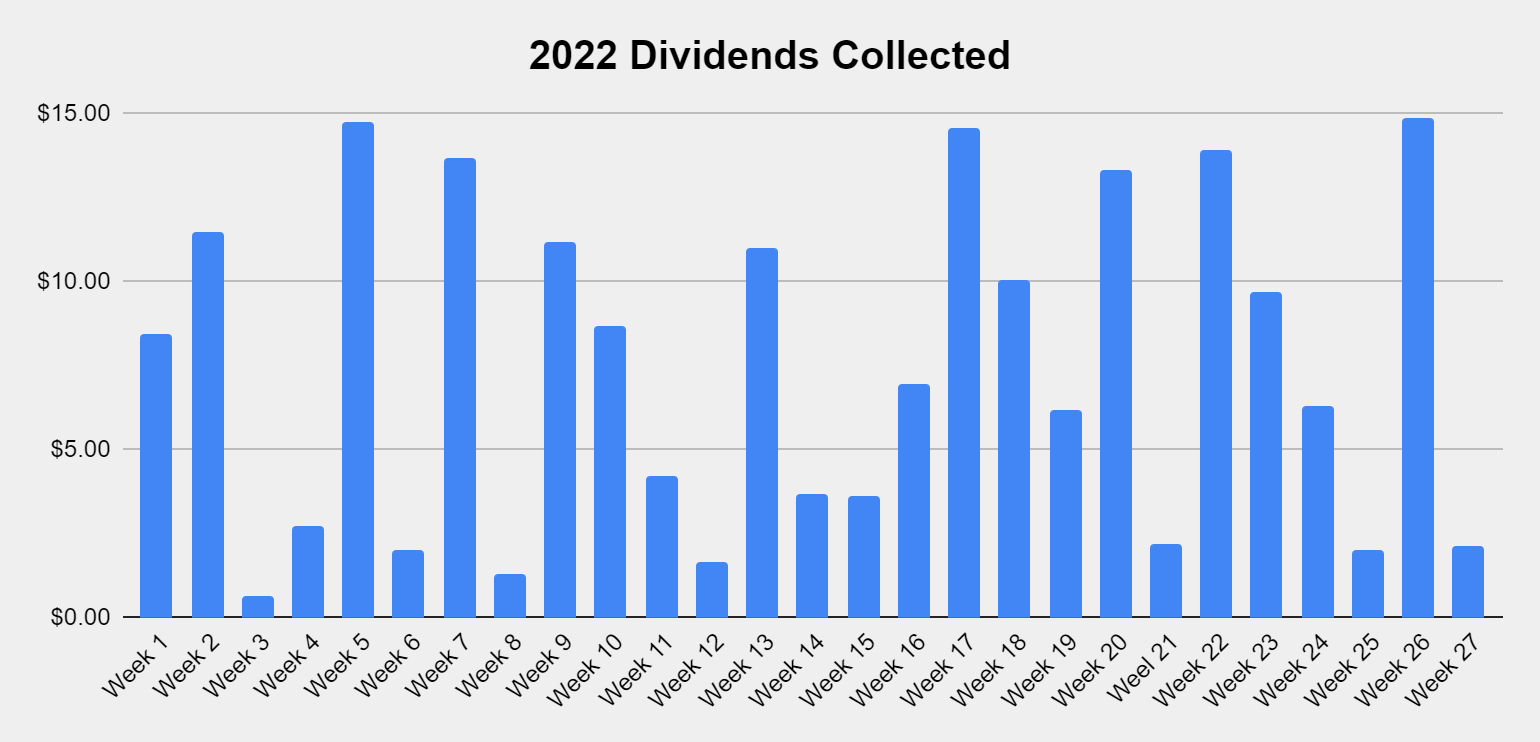
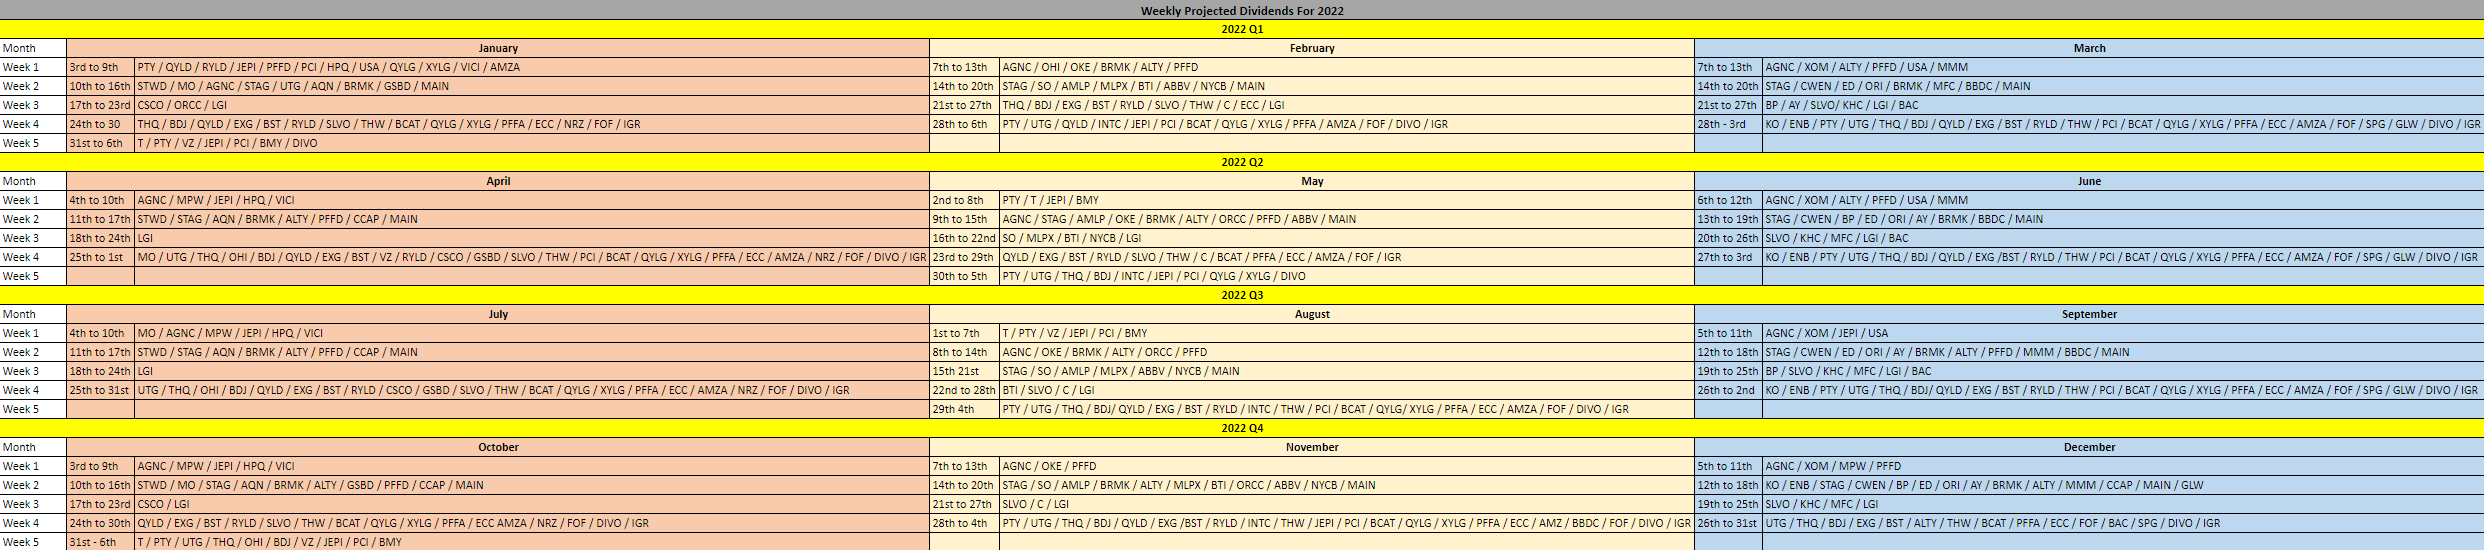
Collecting dividends can serve many functions in a portfolio. Some investors utilize dividends to supplement their income and live off. I am building a dividend portfolio for myself 30 years into the future. Since I am reinvesting every dividend, they serve multiple purposes today. In 2022 alone, I have collected $201.36 in dividend income from 264 dividends across 27 weeks. This has allowed the Dividend Harvesting portfolio to stay in the black while growing the snowball effect.
These dividends allow me to gain additional equity in my investments while increasing my future cash flow in down markets. This style of investing isn’t for everyone, but if you’re looking to generate consistent cash flow while mitigating downside risk, this method has worked for me. I am hoping to collect between $450-$500 in dividends in 2022, which will be reinvested, and finish the year generating >$700 in annual dividends.
Steven Fiorillo
The never-ending stream of dividend income keeps growing. There are now 576 annual dividends being produced after adding IGR in week 70. Dividend income is being produced every week, and I think 600 annual dividends will be here before labor day. It’s going to be very interesting to see what these numbers look like several years from now.
Steven Fiorillo
The goal of generating enough income from the dividends to purchase an additional share per year has been the never-ending project of this portfolio. There are now 6 positions that are generating at least 1 share annually through their dividends, which include Starwood Property Trust (STWD), PIMCO Corporate & Income Opportunity Fund (PTY), Broadmark Realty Capital (BRMK), AGNC Investment Corp. (AGNC), the Global X Russell 2000 Covered Call ETF (RYLD), and the Global X NASDAQ 100 Covered Call ETF (QYLD). I am trying to get more of the current positions over the finish line. Eventually, more positions will generate one share per year in dividend income.
|
Shares from Dividends Annually |
||||||||||
|
0-9.9% |
10-19.99% |
20-29.99% |
30-39.99% |
40-49.99% |
50-59.99% |
60-69.99% |
70-79.99% |
80-89.99% |
90-100% |
Generating > 1 share |
|
LGI |
FOF |
NYCB |
MO |
ALTY |
T |
USA |
PDI |
OHI |
QYLD |
|
|
BBDC |
MLPX |
KMI |
PFFA |
BST |
BCAT |
ARCC |
ECC |
PTY |
||
|
BP |
XYLD |
PFFD |
SLVO |
EXG |
GLDI |
THW |
BRMK |
|||
|
AMLP |
AQN |
BTI |
GSBD |
MPW |
RYLD |
|||||
|
KHC |
QYLG |
UTF |
INTC |
AGNC |
||||||
|
JEPI |
BDJ |
NUSI |
ORCC |
STWD |
||||||
|
CWEN |
SPG |
C |
VZ |
|||||||
|
UTG |
ENB |
NRZ |
IGR |
|||||||
|
SO |
XOM |
MFC |
||||||||
|
RQI |
AMZA |
|||||||||
|
OKE |
DIVO |
|||||||||
|
THQ |
CSCO |
|||||||||
|
AY |
CCAP |
|||||||||
|
STAG |
||||||||||
|
VICI |
||||||||||
|
MMM |
||||||||||
|
O |
||||||||||
|
ORI |
||||||||||
|
ABBV |
||||||||||
|
MAIN |
||||||||||
|
ED |
||||||||||
|
GLW |
||||||||||
|
HPQ |
||||||||||
|
BMY |
||||||||||
|
KO |
||||||||||
|
BAC |
||||||||||
|
WBD |
||||||||||
|
XYLG |
||||||||||
The Dividend Harvesting Portfolio Composition
REITs finished week 71 in the top spot, but they are neck and neck with ETFs. REITs represent 16.66% of the Dividend Harvesting portfolio, while ETFs account for 16.27%. Individual equities make up 45.50% of the portfolio and generate 32.40% of the dividend income, while ETFs, CEFs, REITs, BDCs, and ETNs represent 54.50% of the portfolio and generate 67.60% of the dividend income. I have a 20% maximum sector weight, so when a singular sector gets close to that level, I make sure capital is allocated away from that area to balance things out. In 2022, I will make an effort to even out these portfolio percentages. As more capital is deployed, the bottom half of the portfolio weighting will increase.
|
Industry |
Investment |
Portfolio Total |
% of Portfolio |
|
REIT |
$1,150.10 |
$6,902.40 |
16.66% |
|
ETFs |
$1,123.14 |
$6,902.40 |
16.27% |
|
Closed End Funds |
$984.38 |
$6,902.40 |
14.26% |
|
Oil, Gas & Consumable Fuels |
$551.15 |
$6,902.40 |
7.98% |
|
Communication Services |
$531.14 |
$6,902.40 |
7.69% |
|
Financials |
$477.74 |
$6,902.40 |
6.92% |
|
Consumer Staples |
$452.79 |
$6,902.40 |
6.56% |
|
Technology |
$367.78 |
$6,902.40 |
5.33% |
|
BDC |
$301.83 |
$6,902.40 |
4.37% |
|
Utility |
$285.82 |
$6,902.40 |
4.14% |
|
Pharmaceuticals |
$232.26 |
$6,902.40 |
3.36% |
|
Industrials |
$131.42 |
$6,902.40 |
1.90% |
|
Independent Power & Renewable Electricity Producers |
$110.36 |
$6,902.40 |
1.60% |
|
ETN |
$38.07 |
$6,902.40 |
0.55% |
|
Cash |
$2.82 |
$6,902.40 |
0.04% |
INTC has moved to the 2nd largest holding in the Dividend Harvesting portfolio and is right behind Verizon (VZ). There are 3 positions that exceed 4%, and I will continue to watch VZ and INTC to make sure they don’t exceed 5%.
|
Week 71 Top 10 By % |
|
|
VZ |
4.46% |
|
INTC |
4.45% |
|
OHI |
4.10% |
|
XOM |
3.93% |
|
STWD |
3.61% |
|
C |
3.42% |
|
T |
3.23% |
|
QYLD |
3.05% |
|
SPG |
2.86% |
|
MO |
2.60% |
Week 71 Additions
In week 71 I allocated capital toward:
Citigroup
Right before Berkshire Hathaway (BRK.A) took a position in C, I had written a dedicated article on them (can be read here). C remains undervalued by many metrics used to evaluate banks, and its dividend yield is roughly 4.36%. I am in the red on my investment in C, so I decided to add another share. If you look at its balance sheet, C has a tangible book value of $79.74 per share and a book value of $92.03, yet its shares trade at $46.82. Shares are trading at a steep discount to either book value metric in addition to other metrics.
Intel Corporation
INTC has officially acquired the land it needs to start building its Ohio manufacturing plant. I think shares of INTC are drastically undervalued, and their yield is now 3.84%. It may take some time, but I think that the hype around graphics cards is wearing off, and some of the focus will shift to INTC. I don’t see another manufacturer overtaking them in personal computing and believe this is a great entry price for a long-term position. Maybe one-day INTC can actually surpass the valuation it had during the dotcom bubble.
CBRE Global Real Estate Income Fund
My dedicated article on IGR can be read here if you are interested in the full analysis. IGR is a closed-end fund managed by CBRE Investment Management. CBRE Group (CBRE) is the world’s largest commercial real estate services and investment company in addition to being the largest commercial property developer in the United States. The investment management arm of CBRE has $146.8 billion of assets under management. IGR’s primary objective is to generate large amounts of income for its investors. Capital appreciation is its secondary objective. IGR has established a strong track record over the past decade of paying its distribution. In July of 2015, IGR increased its monthly distribution from $0.04 to $0.05, and recently IGR’s distribution increased again in March of 2022 from $0.05 to $0.06. As IGR is managed by the top commercial real estate firm, has a distribution that is almost 10%, and pays it monthly, I decided to add it to the Dividend Harvesting portfolio.
Week 72 Gameplan
I keep changing what I want to invest in. Originally I thought it would be an all REIT week with Omega Healthcare Investors (OHI), Medical Properties Trust (MPW), and Starwood Property Trust (STWD). Then I saw how low Altria Group (MO) was trading and that Enbridge (ENB) had declined a bit. I am not exactly sure what I will be doing, but I think it’s safe that at least one of these names will be added to.
Conclusion
Thank you to everyone who continues to read the Dividend Harvesting series and leave comments. While the portfolio has experienced its 4th consecutive negative week, I am ultimately bullish on this portfolio. I am about to crack $500 of projected annual income and believe that every position I am adding to will pay off in the future. I am looking forward to the portfolio’s progression and picking up shares of great assets during the market’s decline.
Be the first to comment