

LUMIKK555/iStock via Getty Images
Written by Sam Kovacs
Introduction
The DFT service has gone through a whole year now. We can make all the promises we want in our marketing content, but do we deliver the goods?
I’ll let you be the judge.
In this article I’ll review our three portfolios in a very chart intensive manner.
Portfolio Performance without dividends
Capital gains are invariably the largest part of returns in bull markets. Stock prices go up, and many investors and fund managers have difficulty keeping up with the index.
When I refer to the index, I’m referring to the S&P 500 (SPY). In 2021, the SPY increased by 26.9% before dividends, and 28.7% including dividends.
Although we’re a dividend oriented service, our portfolios have clearly laid out goals:
For the low yield portfolio: To beat the index over time with a basket of low yield high growth stocks which still provides a significant amount of income.
For the Hybrid portfolio: To match the index over time while providing a mix of yield and growth which results in significant amounts of income.
For the High Yield portfolio: To provide a high level of income (6% yield) while offering satisfactory capital gains, all while realizing that it is difficult to match the index with such a strategy.
So how’d we do?
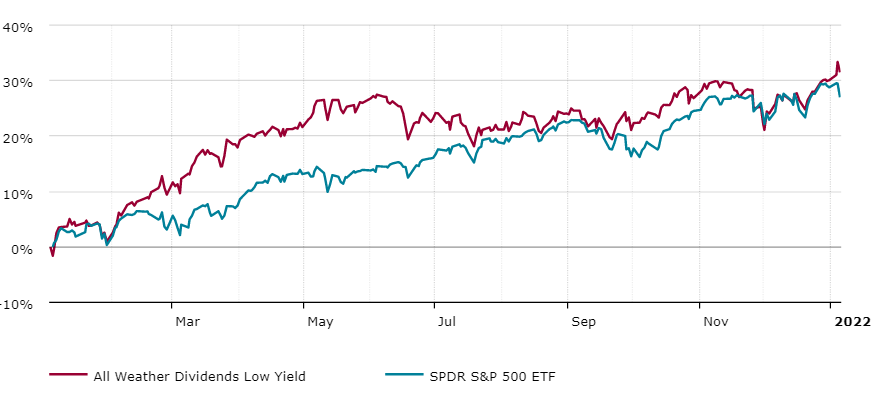
Low Yield Portfolio
The Low Yield portfolio posted +30% performance in 2021 before dividends, beating the index by 3.1%. The first half of the year saw the portfolio blast ahead of the index, before converging for most of Q3 and Q4.
I guess we were good boys, because the Santa Rally increased our portfolio values more than the S&P 500 and gave us an edge over the index in the last few weeks.
|
Year |
Jan | Feb | Mar | Apr | May | Jun | Jul | Aug | Sep | Oct | Nov | Dec | Total |
|
2021 |
0.96% | 8.39% | 7.78% | 3.12% | 3.58% | -2.21% | -1.62% | 2.38% | -2.40% | 4.74% | -3.69% | 6.48% | 30.08% |
Source: Dividend Freedom Tribe
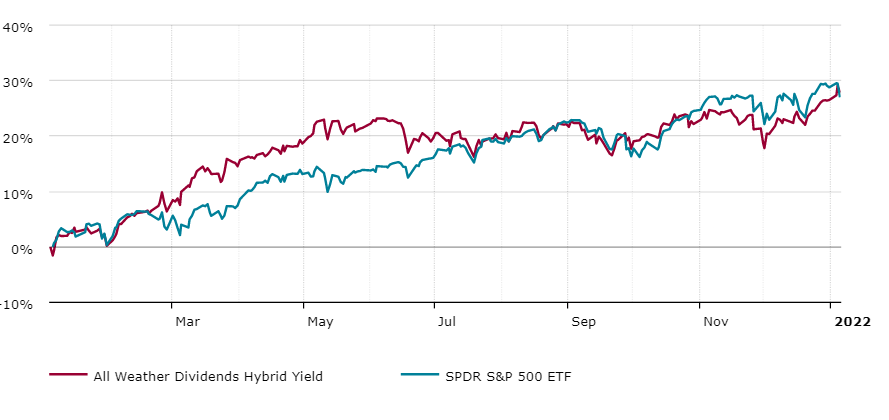
Hybrid Portfolio
The Hybrid portfolio increased 26.5%, lagging the index by 0.4% in 2021. Not unlike the low yield portfolio, as the reopening trade got stalled halfway through the year, it started moving sideways before ripping higher in the last few days.
It is good to note, that upwards momentum has continued, as the portfolio is now beating the index when you add the first few days of January.
|
Year |
Jan | Feb | Mar | Apr | May | Jun | Jul | Aug | Sep | Oct | Nov | Dec | Total |
|
2021 |
0.22% | 6.18% | 7.66% | 3.57% | 2.38% | -1.52% | 0.01% | 2.10% | -3.63% | 3.80% | -2.87% | 6.60% | 26.50% |
Source: Dividend Freedom Tribe
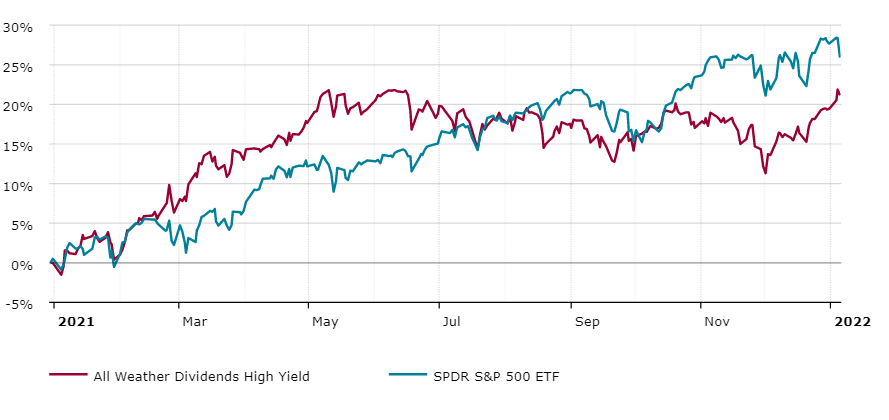
High Yield Portfolio
The High Yield portfolio was the worst performer of the lot, increasing 19.44% lagging the index by 7.5%. While I’m not satisfied with this performance, it is something that high yield portfolios suffer, because of the lack of exposure to growth names, and the necessity to include vehicles like preferred stocks and BDCs.
|
Year |
Jan | Feb | Mar | Apr | May | Jun | Jul | Aug | Sep | Oct | Nov | Dec | Total |
|
2021 |
0.40% | 5.92% | 6.28% | 4.11% | 1.49% | -0.48% | -0.54% | -0.55% | -2.88% | 2.51% | -4.15% | 6.48% | 19.44% |
Source: Dividend Freedom Tribe
Portfolio Performance with dividends
But as you might know, the name of the service is the Dividend Freedom Tribe, and not just the Freedom Tribe.
Dividends have a significant contribution to portfolio performance, and when you follow our philosophy, will ultimately be your source of income.
You can use a capital gain to increase your income by realizing it and reinvesting into something with a higher current yield.
Anyway, let’s see the performance adjusted for dividends. As a reminder the S&P 500 is up 28.7% in 2021 with dividends.
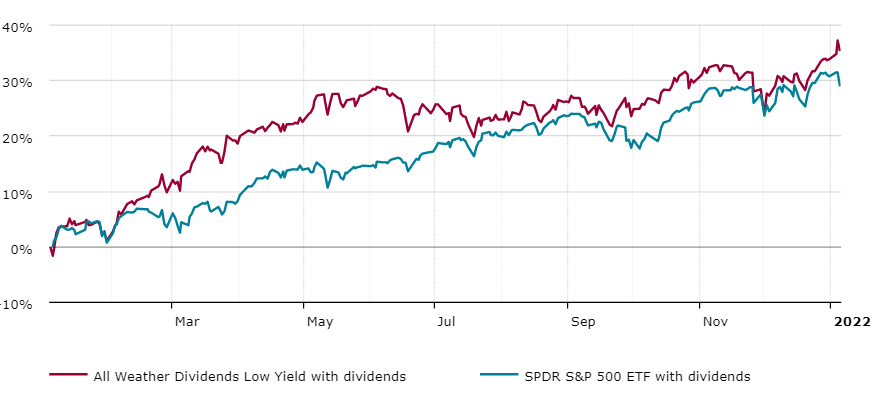
Low Yield Portfolio
When you add dividends to the mix, the Low Yield portfolio was up 33.8%. A number of special dividends from the likes of EOG (EOG) helped increase that amount over the nominal yield.
This amounts to beating the S&P 500 by 5% with a portfolio of value oriented blue chips. Not bad, we’d say.
As of the time of writing (January 6th) the performance gap since inception has increased to 6.4% when including dividends.
|
Year |
Jan | Feb | Mar | Apr | May | Jun | Jul | Aug | Sep | Oct | Nov | Dec | Total |
|
2021 |
1.13% | 8.64% | 7.99% | 3.29% | 3.85% | -1.97% | -1.41% | 2.65% | -2.11% | 4.92% | -3.40% | 6.85% | 33.85% |
Source: Dividend Freedom Tribe
Hybrid Portfolio
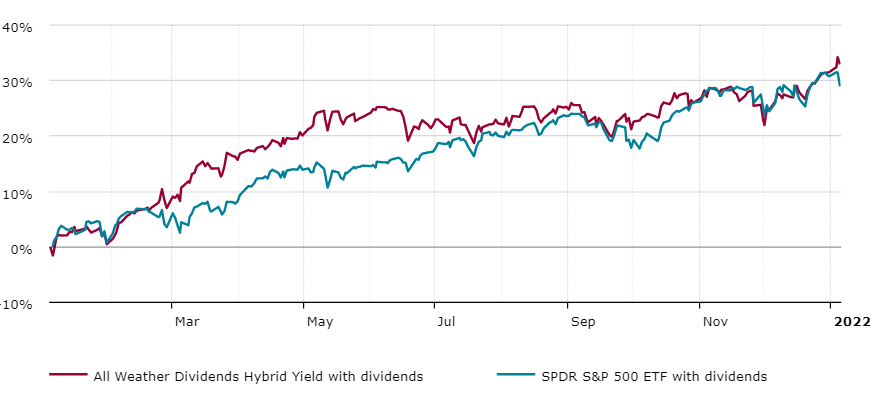
It was a photo finish for the Hybrid vs the S&P 500 without dividends, but when you add in dividends, the Hybrid portfolio’s performance increases to 31.5%, beating the index by 2.8%.
A convincing performance.
|
Year |
Jan | Feb | Mar | Apr | May | Jun | Jul | Aug | Sep | Oct | Nov | Dec | Total |
|
2021 |
0.49% | 6.51% | 8.11% | 3.80% | 2.74% | -1.11% | 0.22% | 2.43% | -3.24% | 3.96% | -2.48% | 7.04% | 31.54% |
Source: Dividend Freedom Tribe
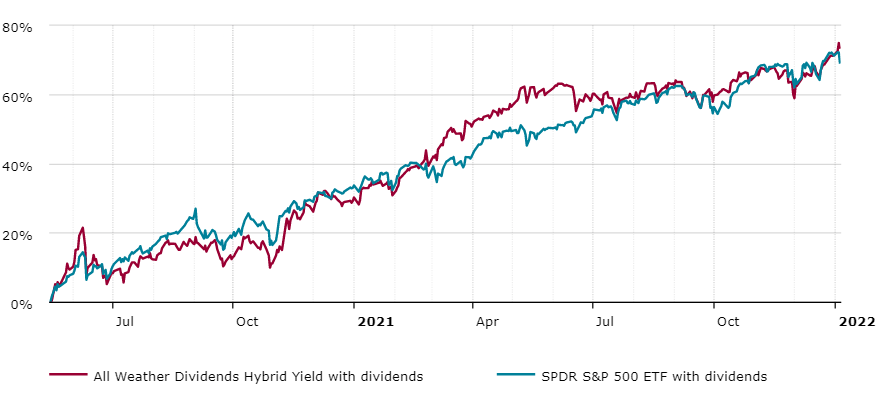
It should be noted that the Hybrid portfolio was incepted before the two others, in May 2020. Below is the full chart since inception.
 Source: Dividend Freedom Tribe
High Yield Portfolio
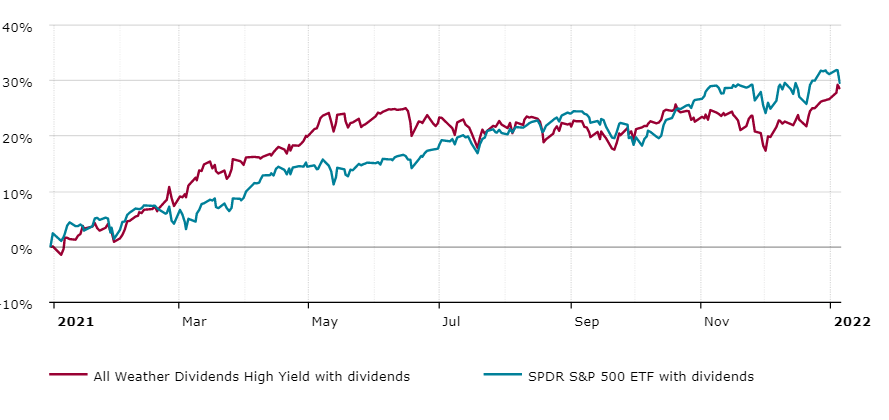
Remember that laggard of a portfolio? Turns out, when you add back dividends from the High Yield portfolio, you get a total performance in 2021 of 26.5%, or just 2.2% below the S&P 500. Not bad at all for a high yielding portfolio, if I can say so myself.
|
Year |
Jan | Feb | Mar | Apr | May | Jun | Jul | Aug | Sep | Oct | Nov | Dec | Total |
|
2021 |
0.83% | 6.40% | 6.90% | 4.41% | 2.10% | -0.02% | -0.23% | 0.15% | -2.39% | 2.73% | -3.51% | 7.08% | 26.54% |
Source: Dividend Freedom Tribe
Exactly a year after we launched, 2 of 3 of our portfolios are beating the S&P 500 by convincing margins, and the high yield portfolio is neck and neck with the index.
We’re as far from closet indexers as possible. Our Alpha has been generated with portfolios which are fundamentally different from the index, as we’ll review in the next sections.
Portfolio Diversification
We’re going to review how our portfolios differ from the S&P 500 on the diversification front.
S&P 500
Below is the diversification breakdown of the S&P 500 according to Seeking Alpha:
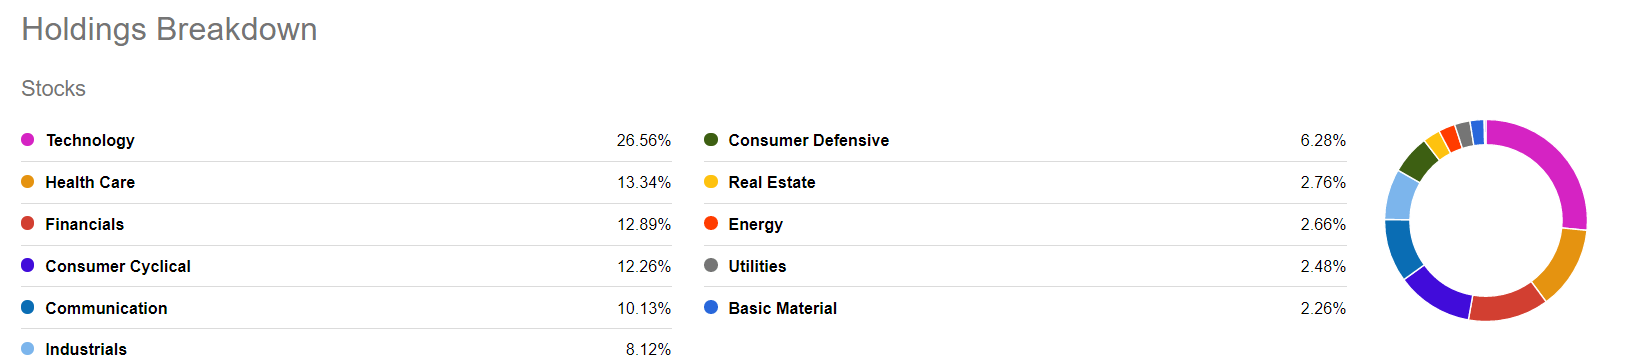
Source: Seeking Alpha
One small differentiation is that they have the titles “consumer cyclical” and “consumer defensive”, where we have “consumer discretionary” and “consumer staples”.
I believe these should match very closely and won’t impact the analysis.
The SPY is heavily weighted in Tech, with 26.5% of the portfolio allocated to the sector.
Healthcare, Financials, and Consumer Cyclical follow with 12-13% weights.
Let’s see how our portfolios fare in relation.
Low Yield Portfolio
The Low Yield portfolio has about half the tech exposure of the index, but double the financials exposure.
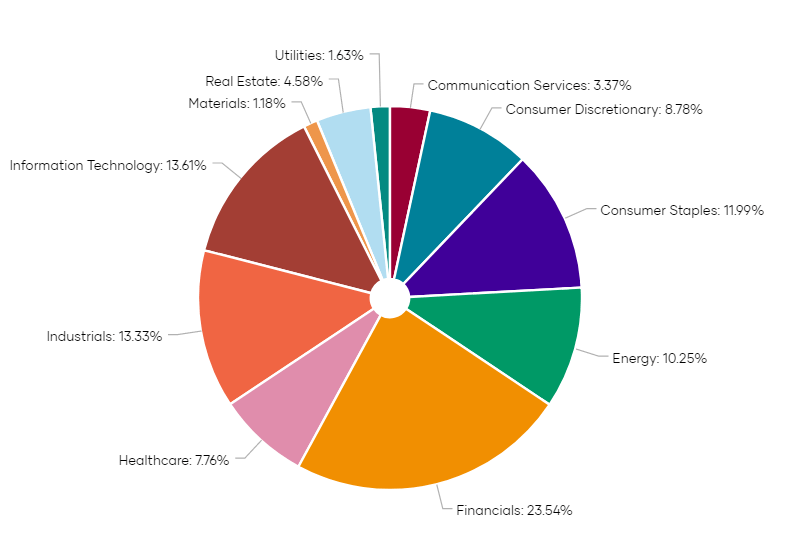 Source: Dividend Freedom Tribe
We’re comfortable with this exposure to financials, as the sector, which is still shunned on valuations, is set to do very well in 2022, in an inflationary and rising rate environment.
The portfolio also has 10% in energy, which is 4x the index exposure. This is the lowest exposure among all our portfolios, as high growth opportunities in the sector are less prominent in the sector.
There are little variations after this, but the overexposure to financials and energy, with under exposure to tech, is likely what needs to be remembered.
For instance, Utilities and Materials are both the lowest exposure, and don’t have significantly different weights than in the index.
One of the differentiating points among our portfolios is that the low yield portfolio also has relatively high exposure to industrials.
Hybrid Portfolio
With the Hybrid and High Yield portfolios, we see many of the same themes: more energy and financials, less tech, but another theme comes into play: a lot more real estate.
Real Estate is 13% of the portfolio, and this is to be expected in dividend oriented portfolios as there are some brilliant REITs which offer good combinations of yield and growth.
In the Hybrid portfolio, the consumer discretionary exposure is a lot lower than the index, making it more defensive in nature.
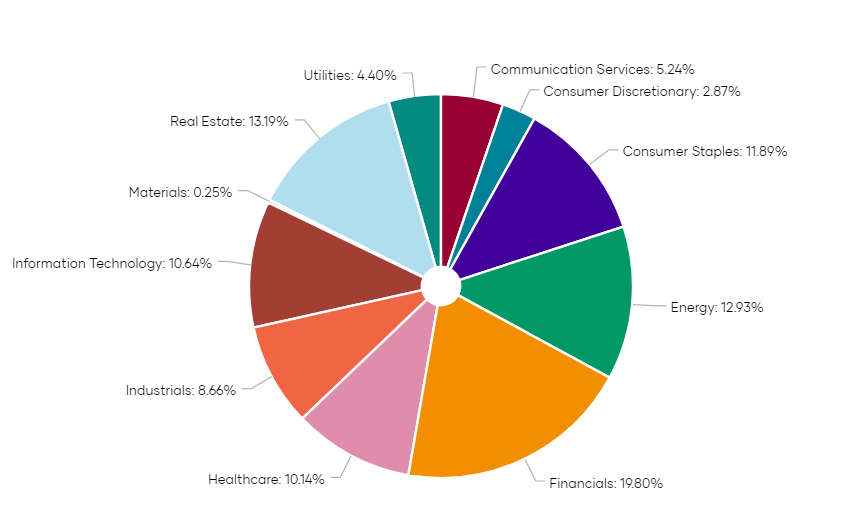 Source: Dividend Freedom Tribe
High Yield Portfolio
The High Yield portfolio is arguably the least balanced portfolio of the 3, due to the high yield constraint.
It is very heavily weighted in Energy, as there are many high quality high yield energy names. It also has big exposure to financials, with BDCs accounting for approximately 4% of the portfolio.
A large 20% of the portfolio is invested in Real Estate. Once again, nothing surprising here, we have to deal with the high yield constraint to build a portfolio.
It has very low exposure to tech, consumer discretionary and industrials relative to our other portfolios, and to the index.
Nonetheless, the portfolio isn’t unjustifiably exposed to any given sector, and we’re quite content with the diversification.
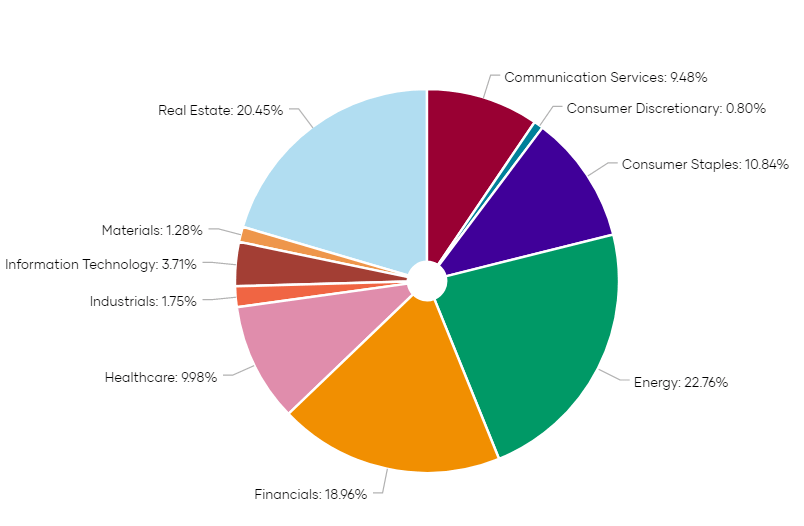
Source: Dividend Freedom Tribe
Diversification sum up
Our portfolios have positions in all sectors, and are well diversified across names and sectors.
But more importantly they are different from the index. So while in 2021 our performance was more or less similar to the index, any big moves from sectors with overexposure or underexposure could quickly create divergences.
In 2021, Financials, Energy and Tech all went up by similar amounts, which is the biggest part of why our portfolios had similar performance.
But if the performance in these sectors diverge, as they have so far in 2022, with tech down 3% while energy is up 6% and financials up 3%, we can expect the portfolios to diverge from the index.
We remain cautious, and will tilt our portfolios to sectors with better opportunities over time, by trimming overvalued sectors and allocating to undervalued sectors.
It’s active management done right. Patient, cautious, optimistic.
Top 10 positions by weight
To further analyze how different our portfolios are both from one another, and from the index, it is interesting to compare the top 10 positions.
You’ll note that our portfolios include none of the top 10 S&P 500 positions, as none of them match our dividend oriented strategy.
In the Low Yield portfolio, Amgen (AMGN) despite its subpar capital appreciation is our top performance, as we’ve been averaging down, and continue to believe in the superiority of this management team. Healthcare is a tricky business, all AMGN needs is one good “win” to see its stock price go heading up.
On the other side of the equation, the likes of Apple (AAPL), Microsoft (MSFT), and Amazon (AMZN) are all trading at valuations which make them risky bits. The Low Yield top 10 is a pure quality/growth/value intersection. While not all of the stocks are still on our Buy List because of valuations, I’m super happy with how it’s set up.
In the high yield portfolio, there are no surprises. The high quality High Yielders make up the bulk of the portfolio. Quite happy with the fact that the top 4 positions are all in different sectors.
Finally the Hybrid is really a mix of both, with the notable difference of Bank of America (BAC) being the largest position, as we bought a large position in the stock when it was half the price it currently is.
You can only beat the index by as much as you’re willing to underperform it.
We won’t cave in to pressures from high flying names, and believe we can do great focusing on fundamentals.
| Position | Low Yield | Hybrid | High Yield | S&P 500 |
| 1 | Amgen (AMGN) – 5% | Bank of America (BAC) – 4.2% | Chevron (CVX) – 5.3% | Apple (AAPL) – 6.8% |
| 2 | American Tower (AMT) – 4.5% | Chevron (CVX) – 3.5% | Philip Morris (PM) – 5% | Microsoft (MSFT) – 6.2% |
| 3 | Snap-on (SNA) – 4.4% | AbbVie (ABBV) – 2.9% | AbbVie (ABBV) – 5% | Amazon (AMZN) – 3.6% |
| 4 | Broadcom (AVGO) – 4.3% | Snap-on (SNA) – 2.9% | Prudential (PRU) -5% | Alphabet A (GOOG) -2.1% |
| 5 | Best Buy (BBY) – 4.2% | Philip Morris (PM) – 2.6% | Enbridge (ENB) – 4.5% | Tesla (TSLA) – 2.1% |
| 6 | EOG Resources (EOG) – 4.1% | Altria (MO) – 2.6% | IBM (IBM) -4.5% | Alphabet C (GOOGL) – 2% |
| 7 | Morgan Stanley (MS) – 4% | Pfizer (PFE) – 2.6% | Altria (MO) – 4.3% | Meta (FB) – 2% |
| 8 | Kroger (KR) – 3.6% | Prudential (PRU) – 2.5% | BCE (BCE) – 4% | NVIDIA (NVDA) – 1.8% |
| 9 | Aflac (AFL) – 3.4% | T Rowe Price (TROW) – 2.5% | ONEOK (OKE) – 4% | Berkshire (BRK.B) – 1.3% |
| 10 | Nexstar (NXST) – 3.3% | Iron Mountain (IRM) – 2.3% | Exxon (XOM) – 3.7% | UnitedHealth Group (UNH) – 1.1% |
Source: Dividend Freedom Tribe
Biggest Winners
These numbers are really just here for informational purposes, and they’re not true top performers, as we’ve sold a certain number of positions, but they show the highest unrealized gains exclusive of dividends in our portfolios.
The Hybrid portfolio which was set up earlier, has a lot of higher gains, which were mostly materialized from very low buy ins in ’20.
It’s interesting to note that the low yield portfolio has less high flying positions than the High Yield portfolio despite still providing better overall performance.
| Position | Low Yield | Hybrid | High Yield |
| 1 | EOG Resources (EOG) : 37% | Regions Financial (RF): 131% | Federal Realty (FRT) : 59.7% |
| 2 | DICK’S Sporting Goods (DKS) : 36% | HP (HPQ) : 113% | Iron Mountain (IRM) : 56% |
| 3 | CBOE (CBOE) : 34% | Bank of America (BAC) : 107% | Pfizer (PFE) : 51% |
| 4 | FNCB (FNCB) : 29.9% | Principal Financial Group (PFG): 85% | Chevron (CVX) : 31% |
| 5 | JPMorgan (JPM) : 28% | Broadcom (AVGO): 84% | Arbor Realty (ABR): 29% |
Source: Dividend Freedom Tribe
Biggest Losers
As you can guess, the reason for the previous sentence, is that the High Yield portfolio also has a fair amount of seriously sore losers. Or more like one position which really backfired, and a handful of double digit losers.
With higher yielding positions, more volatility is a truth that we have to deal with.
| Position | Low Yield | Hybrid | High Yield |
| 1 | Medifast (MED) : -18% | Medifast (MED): -24% | Ontrack Preferred (OTRKP) : -56% |
| 2 | Best Buy (BBY) : -2.5% | Omega Healthcare (OHI): -20% | Rio Tinto (RIO): -18% |
| 3 | Conagra (CAG): -2.3% | Pinnacle West (PNW): -17% | National Health (NHI): -17% |
| 4 | Coterra (CTRA) : -0.17% | National Health (NHI): -17% | Omega Healthcare (OHI): -14% |
| 5 | Bristol Myers (BMY) : 0% | AT&T (T): -10% | Archrock (NYSE:AROC): -13% |
Source: Dividend Freedom Tribe
I personally can look at a 50% loss and not miss a heartbeat. Maybe it makes me a psychopath, but I believe that to be successful in the stock market you need to stop considering investments like dollars but only like numbers.
If it’s numbers, you can be rational. If it’s money, a ton of emotional baggage comes along with it, which makes you make mistakes.
The best way to make it numbers and not money, is for you to have no need for the capital in your portfolio.
If you follow a Dividend Freedom approach, your capital gains and losses are just a tool you can use to either increase your income by realizing a gain and reinvesting it, or a tool to reduce your tax by claiming a loss (in rare occurrences).
Conclusion
We’re very satisfied with the performance of our portfolios in 2021, and will remain disciplined as always in 2022 to continue providing common sense investing opportunities to investors who want to retire rich on dividends.
Be the first to comment