

Just_Super/iStock via Getty Images
Overview
I’m starting a new series of articles in which I will be focusing on single Dividend Challenger stocks and determining whether they are solid long term buy options for investors based on a number of criteria related to performance, financial strength, valuation, dividend strength, etc.
Dividend Challengers are stocks that have increased their dividends every year for at least five consecutive years. This list is maintained with the Dividend Champions (25+ years) and Dividend Contenders (10+ years). More information on these lists can be found here.
For this first article, I will be reviewing the stock performance, financials, recent news, valuation, and dividend strength of ACCO Brands (NYSE:ACCO).
ACCO Brands designs, manufactures, and markets school, technology, and office products, operating in three business segments: North America, EMEA, and International.
Dividend
ACCO Brands is a fairly recent addition to the Dividend Challengers list having 5 years of consecutive dividend growth and looking at its dividend history you can see that it has done basically the bare minimum in terms of meeting the requirements to make the list.
ACCO began making quarterly dividend payments of $0.06 in 2018 and increased it in the last quarter of 2019 to $0.065. The company’s last quarterly dividend had an ex-div date of 8/25/2022 for the amount of $0.075.
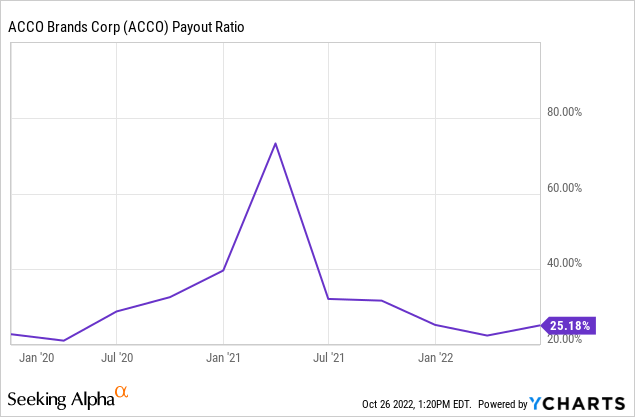
Looking at the chart below, you can see that ACCO’s payout ratio remains relatively low, meaning that it should be able to continue its low dividend growth moving forward.
I feel like the strongest aspect of ACCO’s dividend is its current yield of 6.70%
Financials
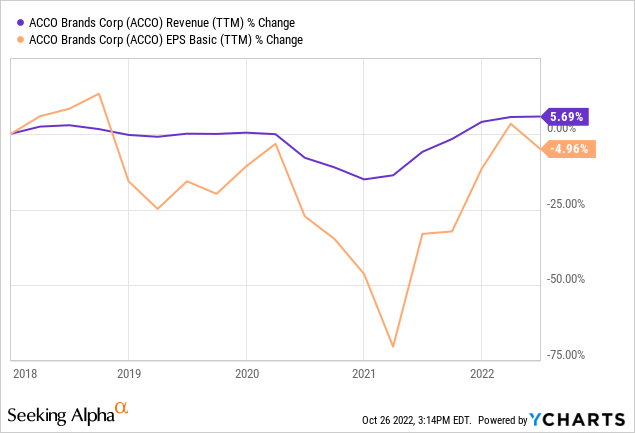
ACCO has seen ups and downs in terms of its revenue and earnings growth over the past several years. Looking at the chart below you can see that its revenue growth has been fairly flat with an increase of just over 5% over the past five years, while earnings have actually declined during that same period.
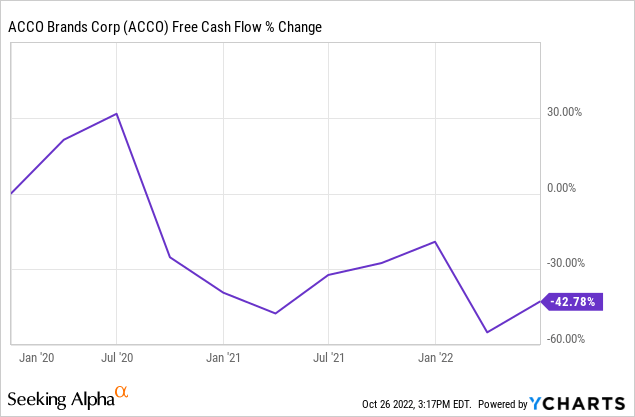
When looking at cash, you can see that ACCO’s free cash flow has seen an almost steady decline over the past few years. If this trend continues, this could apply pressure to both its payout ratio and future dividend growth.
ACCO’s long term debt has also increase over the past few years as well and in terms of earnings ACCO missed both revenue and earnings estimates in its last quarterly report.
Valuation and Performance
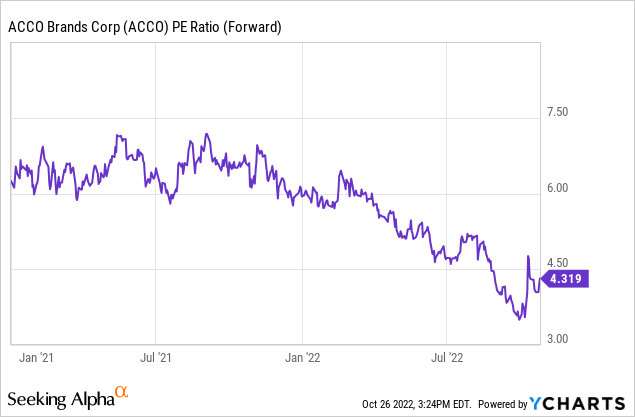
ACCO currently has a forward PE ratio of 4.32. Looking at the chart below, you can see that this is low compared to its recent historical average.
The same trend can be seen when looking at ACCO’s price to book value.
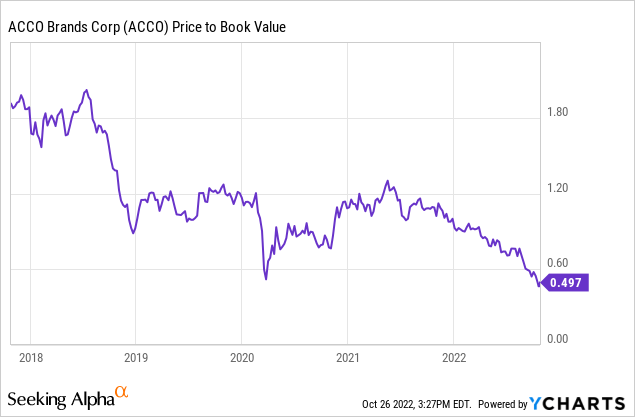
At first glance, this seems like a positive and appears to make ACCO an attractively valued stock; however, this does not take into consideration ACCO’s price performance during this time period.
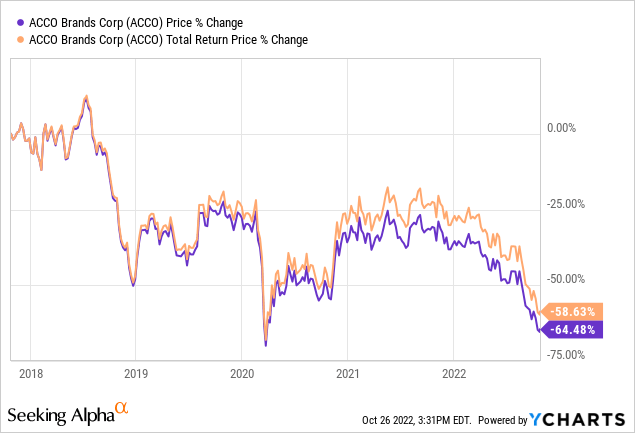
Looking at the chart below, you can see that ACCO has performed poorly over the past five years. Even adding in dividends to get to total return price, the performance is not much better.
Peer Comparison
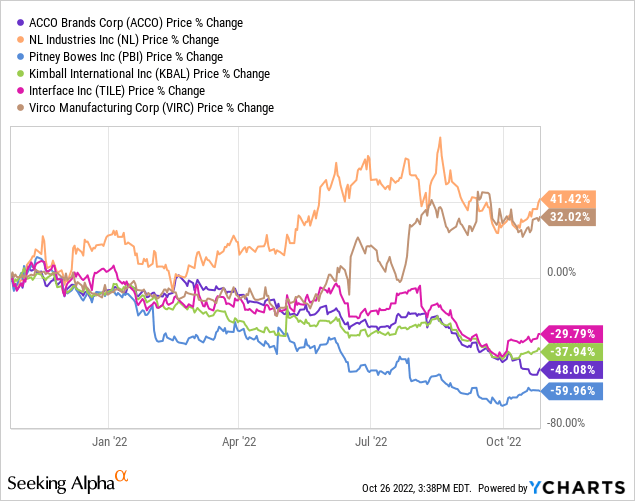
A few stocks within the same industry as ACCO include NL Industries (NL), Pitney Bowes (PBI), Kimball International (KBAL), Virco Manufacturing (VIRC), and Interface, Inc. (TILE).
In terms of stock price, you can see in the chart below that only Pitney Bowes has performed worse over the past year, with NL Industries and Virco performing the best.
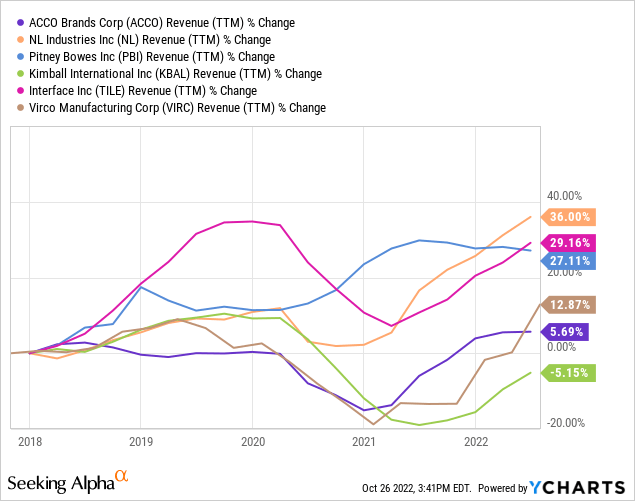
A similar trend emerges when other factors such as revenue growth, with ACCO performing 2nd worst and NL Industries performing best.
In August, NL Industries declared a special dividend likely in large part due to its recent success.
Recent News
ACCO’s Q3 results will be announced next month. Earlier this month, ACCO cut its annual outlook which does not bode well for its earnings report coming up next month especially since the company had already updated its guidance in Q2 to a more “conservative” view. In this recent announcement, management stated that it is forecasting Q3 comparable sales to see a 2%-3% decline and adjusted EPS to be between $0.23 and $0.25 compared to the prior consensus of $0.40.
In Q2, there was similar results in which the company reports EPS of $0.37 (missing by $0.05) and missing its revenue target by 17.15M. In the Q2 earnings report some listed challenges included:
- Inflation
- Foreign currency impacts
- Lack of semiconductor chips
- Demand/supply chain issues
Management stated that they expect these issues to be a concern for the remainder of they year, but I can see a multi-year impact from some of these issues. More than these though, I was concerned with another “issue” in the Q2 earnings report and that was a “difficult comparison against a strong prior year”. When this was mentioned it was in regard to the EMEA business segment but it could be used across the board because looking at the chart below, you can see that in terms of revenue growth ACCO did have a strong year compared to 2020.
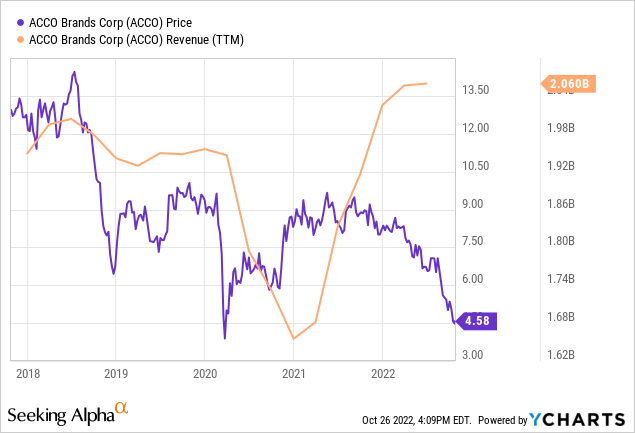
But it was not necessarily good when compared to 2019. I would suggest that the reason 2021 looked good was because 2020 looked so bad and they were basically just inverses of each other. Even with a fairly strong performance in 2021, you can see looking at the same chart that it didn’t have much of an impact in terms of stock price.
Conclusion
I don’t see any significant signs that point to ACCO as being a buy option for long term investors. For those who already own the stock, they may want to hold onto to it (depending on how down they are) and continue to collect the current high yielding dividend and hope that some price appreciation does appear somewhere down the road.
I believe that NL is the better choice for a long term investment even with the nearly 50% increase in stock price over the past year. Its forward PE value of 5.20x is not out of line considering the revenue/earnings growth it has seen.
Right now, I prefer Kimball International and Virco over ACCO as well and would place ACCO in the same category as Pitney Bowes in terms of being a stock that should be avoided unless you already have a position in it. As always, I suggest individual investors perform their own research before making any investment decisions.
Be the first to comment