

Amax Photo
The Global X Super Dividend U.S. ETF (NYSEARCA:DIV) pays a high current yield of 6.4%. It also has decent short-term returns based on its overweight in energy equities. However, aside from those two positives, there’s not much to like about the fund. It has poor long-term returns and surprisingly, it has the highest volatility out of the peer funds analyzed despite a stated strategy of screening for “low-beta” stocks. I would personally avoid this fund.
Fund Overview
The Global X Super Dividend U.S. ETF (DIV) seeks to provide exposure to the 50 highest dividend paying stocks in the U.S. markets. The fund has almost $700 million in assets.
Strategy
The DIV ETF achieves its investment objective by tracking the Indxx SuperDividend U.S. Low Volatility Index (“Index”). The index tracks the performance of 50 equally-weighted stocks, including MLPs and REITS, that have the highest dividend yield in the U.S. while exhibiting low beta to the market benchmark. To qualify for the index, a company needs to have paid dividends consistently for the past 2 years.
Portfolio Holdings
As expected from its stated focus on high dividend yield, the DIV ETF has heavy sector weights in Utilities, Consumer Staples, and Financials. The fund is also overweight energy companies. The fund is underweight Consumer Discretionary, Technology, and Healthcare (Figure 1).
Figure 1 – DIV ETF sector breakdown (globalxetfs.com)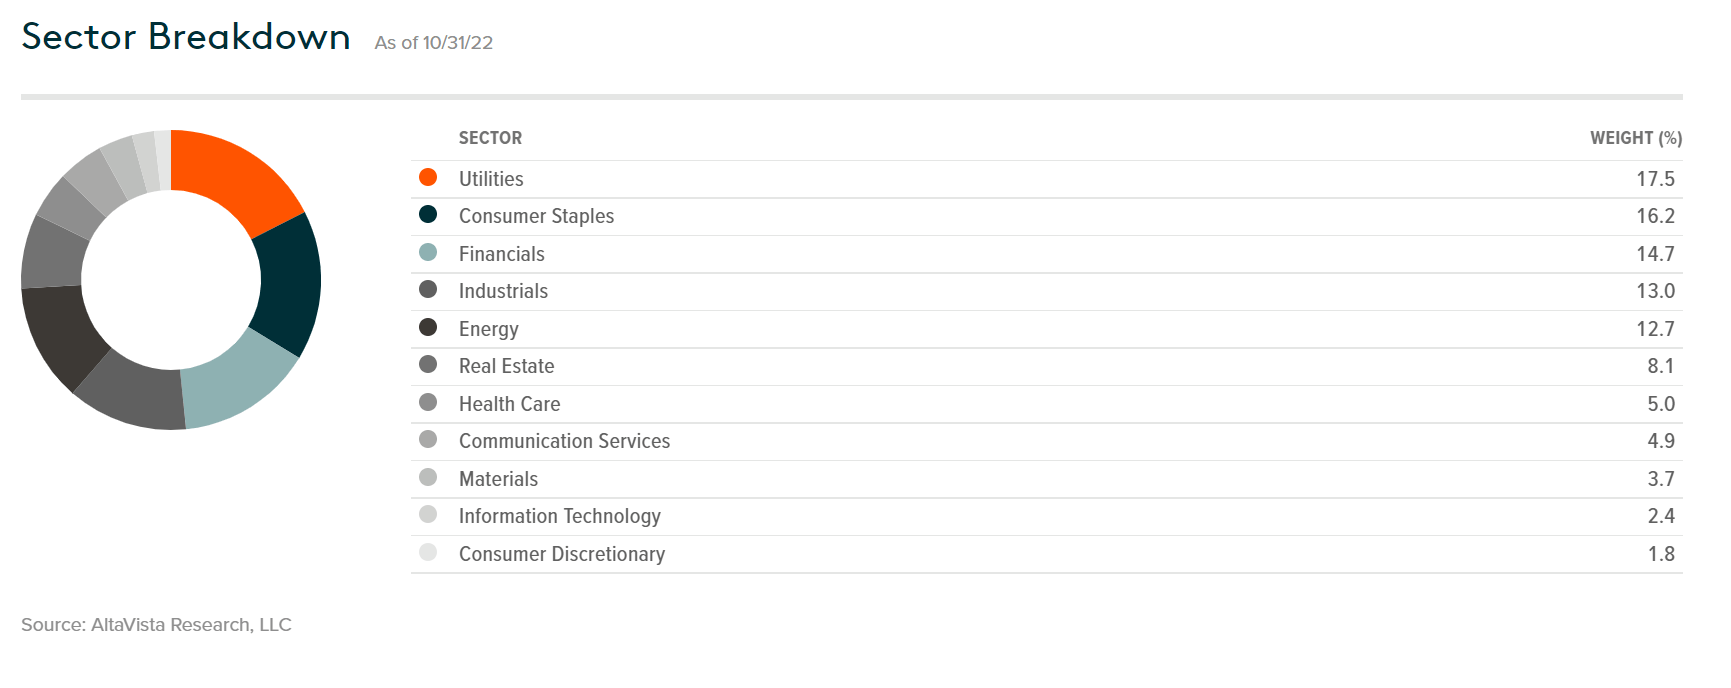
Interestingly, despite its stated strategy of selecting securities with low beta to the market, the ETF itself has a 1.16 beta to the S&P 500 (Figure 2).
Figure 2 – DIV ETF characteristics (globalxetfs.com)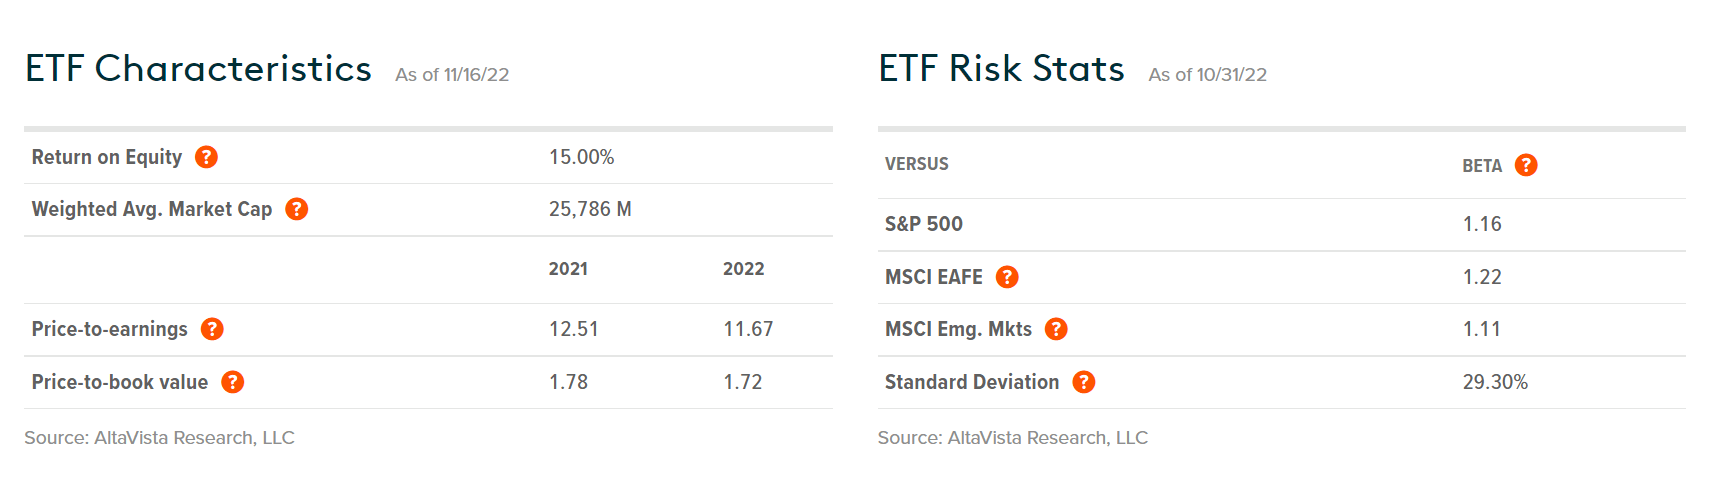
Returns
The DIV ETF has strong short-term returns, with a 1YR return of 1.2% vs. the S&P 500 at -14.7%. However, longer-term returns lag significantly, with 3YR and 5YR average annualized returns of 0.3% and 1.4% respectively, far behind the S&P 500’s 10.1% and 10.3% respectively. Figure 3 shows return figures for the DIV ETF, while Figure 3 shows the return figures for the SPDR S&P 500 ETF (SPY) for comparative purposes.
Figure 3 – DIV ETF returns (globalxetfs.com)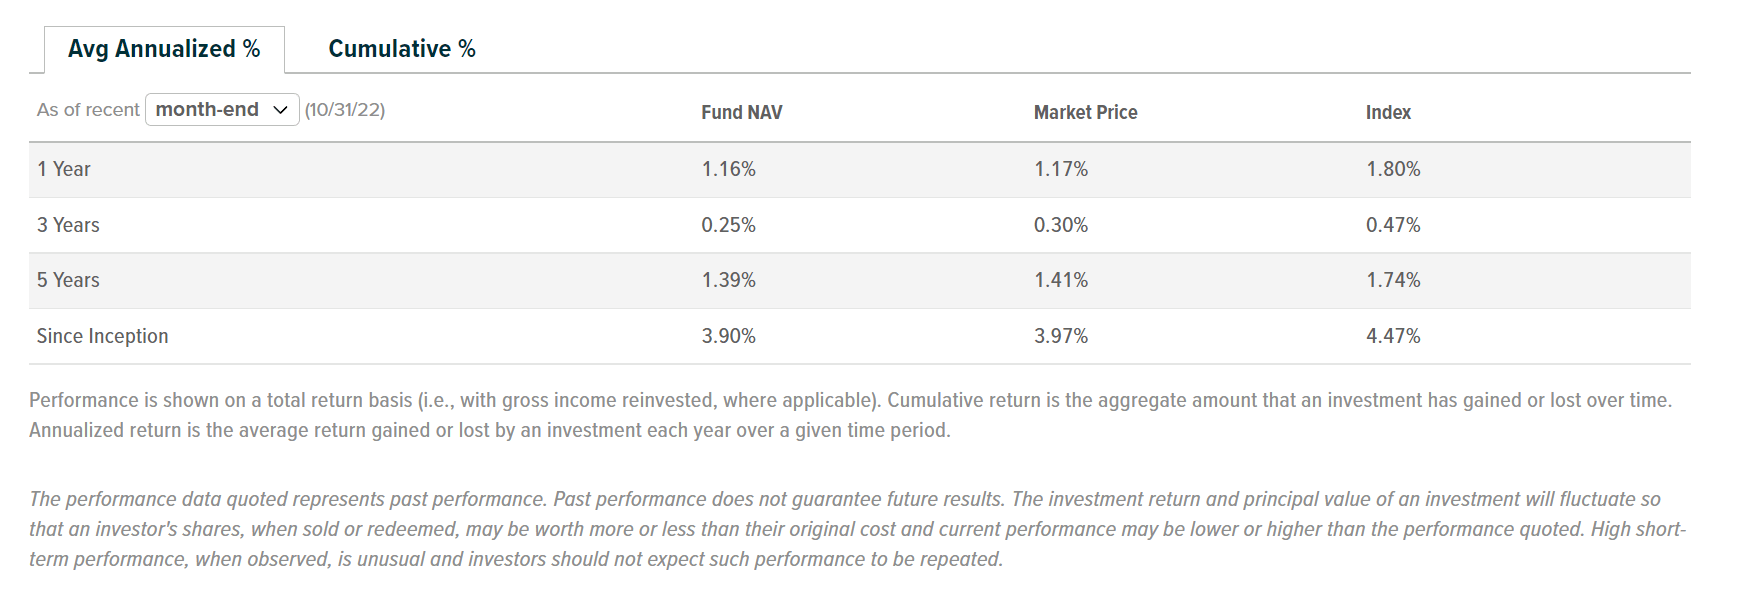
Figure 4 – SPY ETF returns (ssga.com)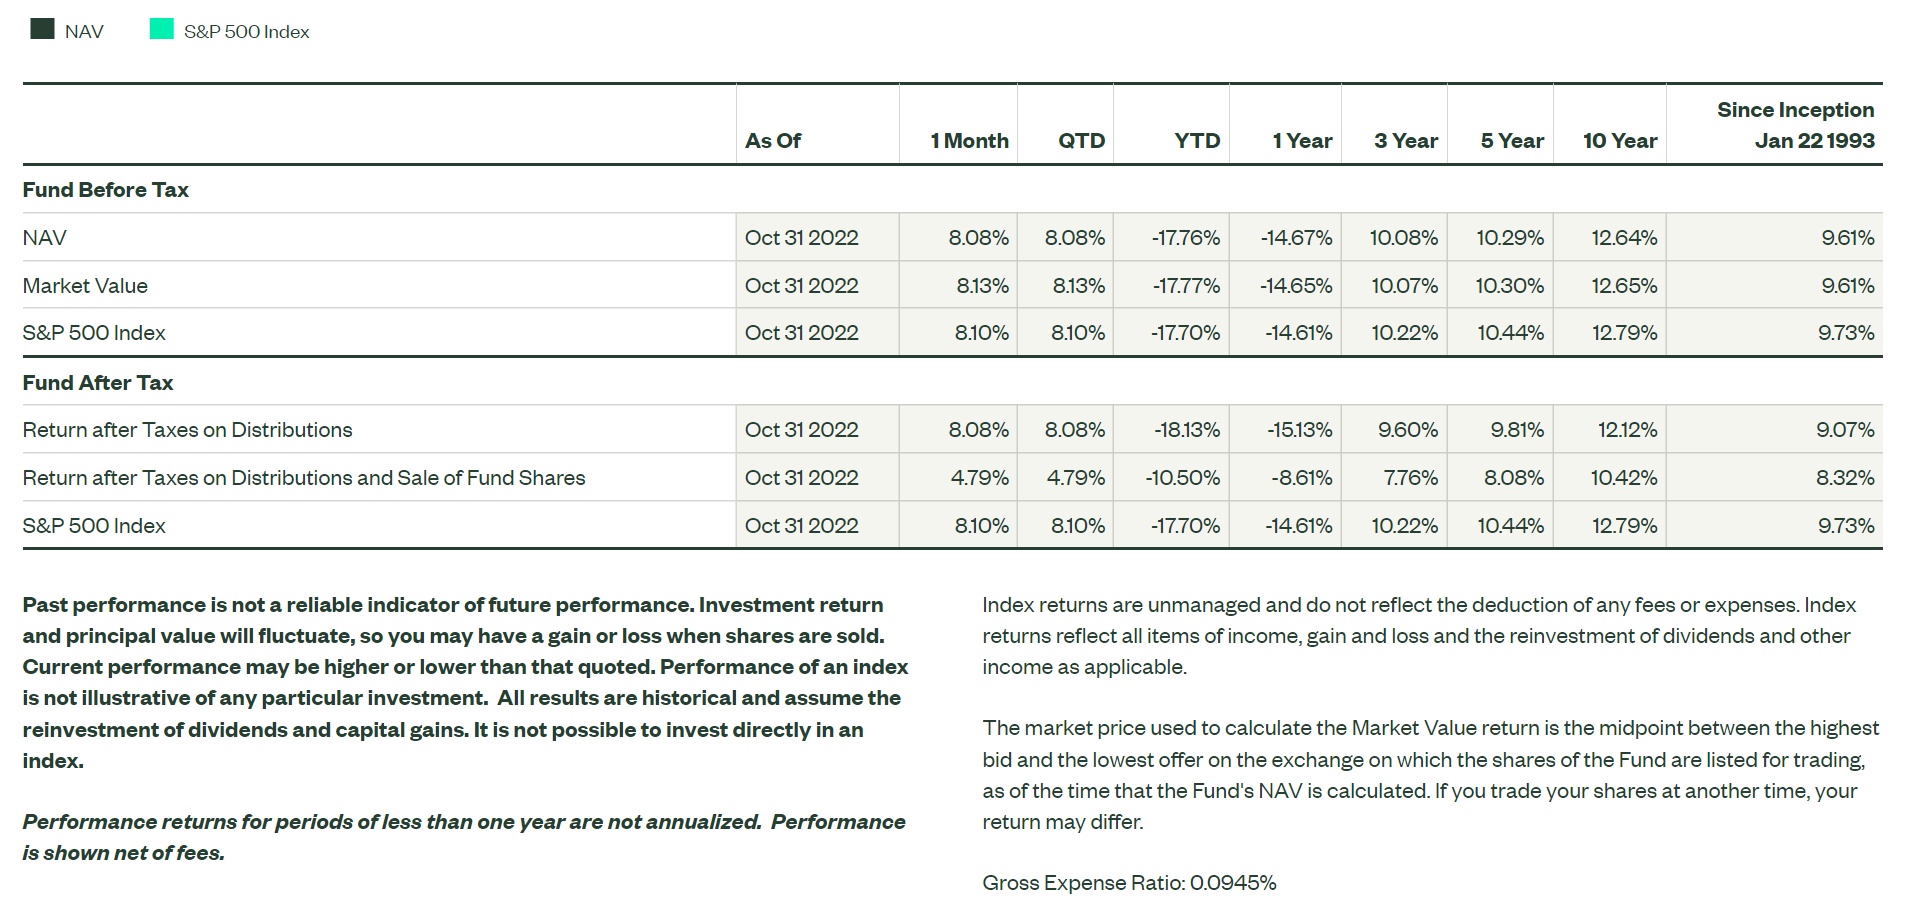
DIV’s strong 1Yr return can be explained by its overweight in energy equities. In the past year, the energy sector has been by far the best-performing sector (Figure).
Figure 5 – Energy has been the leading sector in the past year (sectorspdr.com)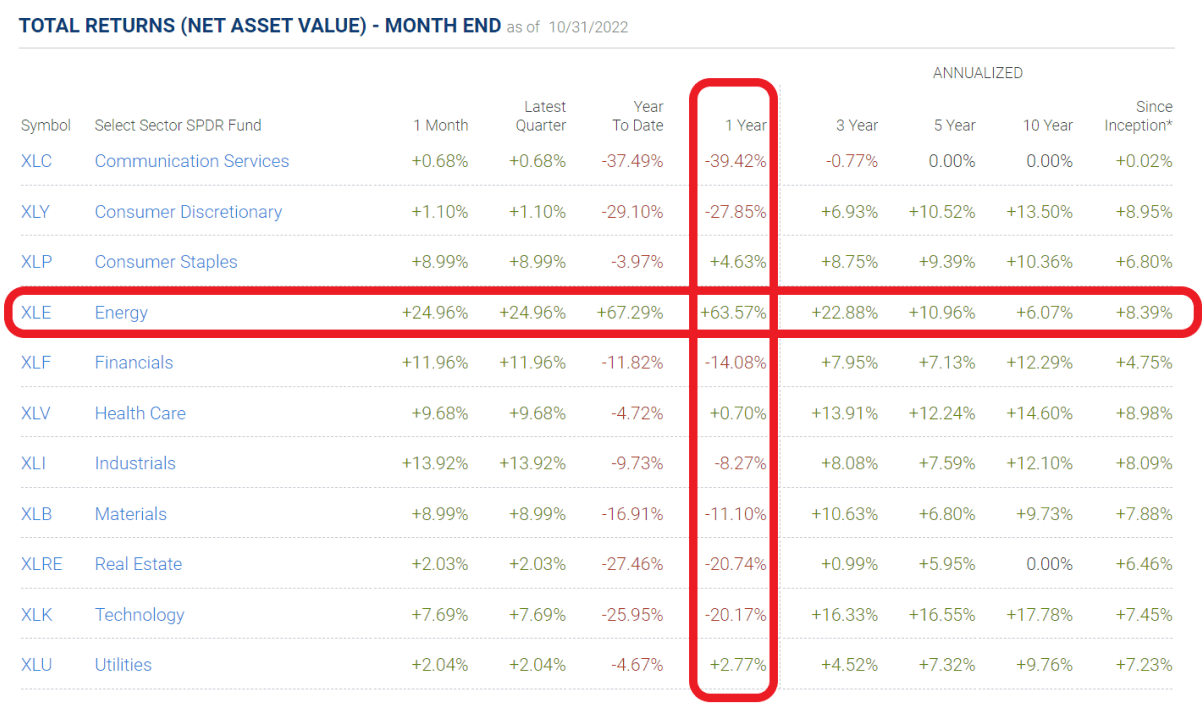
Distribution & Yield
As designed, the DIV ETF pays a high distribution yield of 6.4% on a trailing 12 month basis (Figure 6). DIV’s distribution is paid monthly and the most recent distribution amount of $0.108 was paid on November 10th, 2022.
Figure 6 – DIV ETF yield (Seeking Alpha)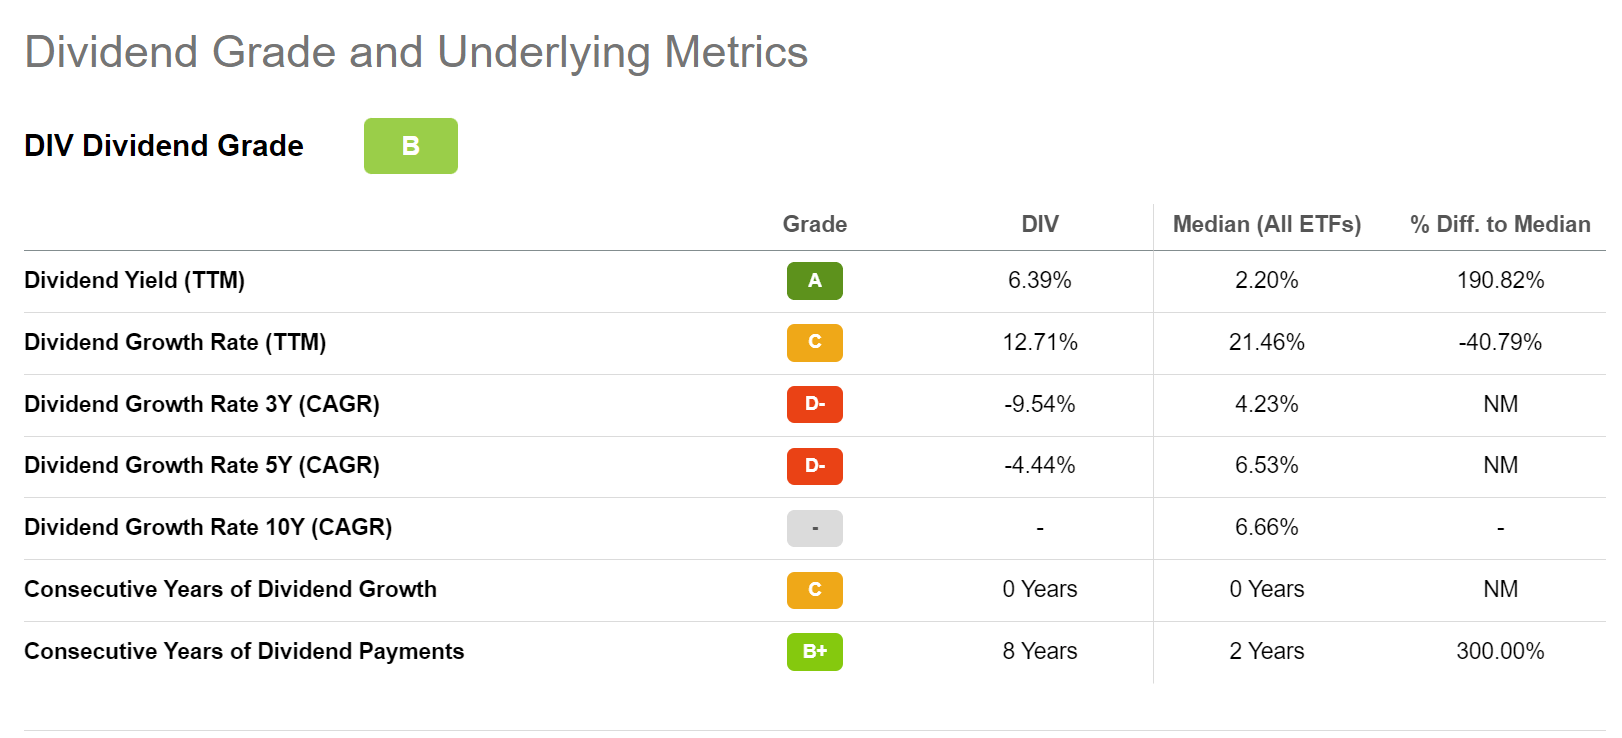
Fees
The DIV ETF charges an expense ratio of 0.45%.
Comparison To Other Dividend Funds
Dividend investing has been a popular theme in the past several years and I personally have a portion of my portfolio invested in the Schwab U.S. Dividend Equity ETF (SCHD). How does the DIV ETF compare to my current income champion, SCHD?
To aid the analysis, I have compiled the following table of returns and attributes (Figure 7).
Figure 7 – Comparison table of dividend funds (Author created with returns and risk metrics from Portfolio Visualizer and distribution and fund details from Seeking Alpha)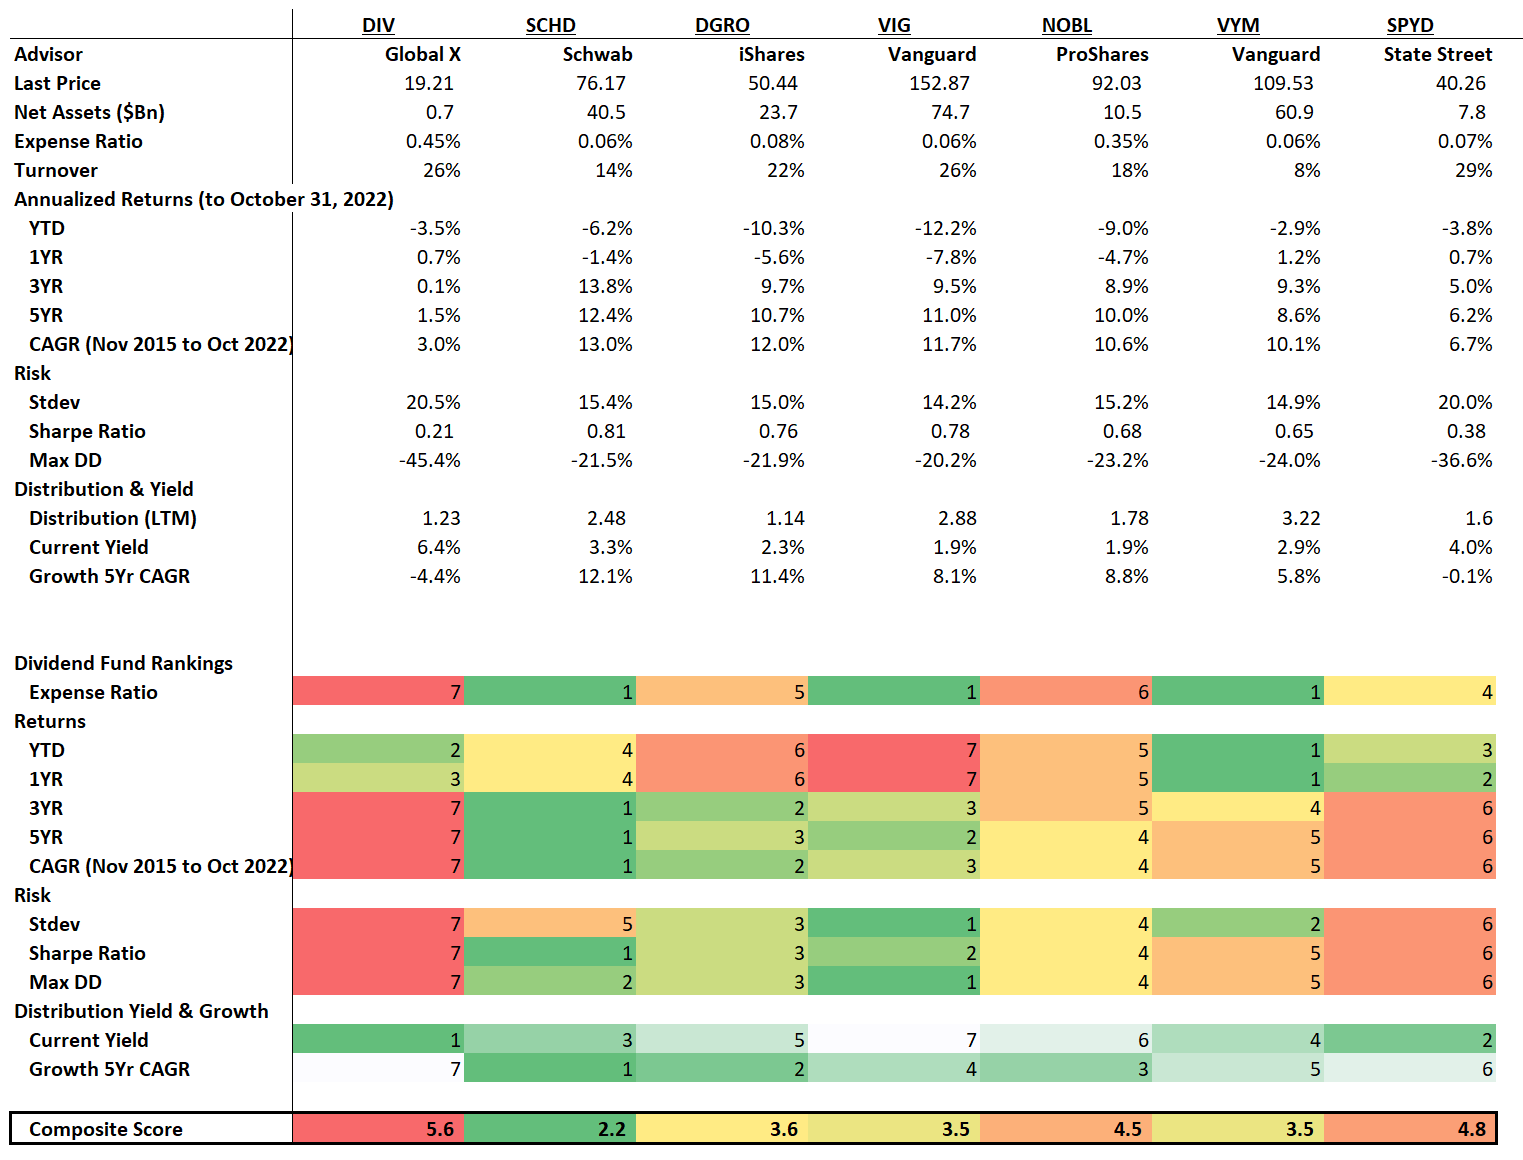
The DIV ETF ranks highest in terms of current yield. However, that yield has actually declined at a 5Yr CAGR of 4.4%, giving the DIV the worst grade in terms of dividend growth.
In terms of return, the DIV ETF has strong 1Yr returns, but it ranks dead last on longer-term time frames. It also has the worst risk metrics, with volatility of 20.5% and a max drawdown of 45% experienced during the COVID pandemic. It’s Sharpe Ratio, measured during the period November 2015 to October 2022, is also the worst.
The DIV ETF is also the most expensive fund with 0.45% expense ratio.
Conclusion
On the positive side, the DIV ETF pays the highest current yield, with a LTM yield of 6.4%. However, there are a lot of negatives with the fund compared to its peers. For example, its long-term returns history has been poor, with a 5Yr average annual return of only 1.4%. Surprisingly, it also has the highest volatility and largest drawdown of the analyzed funds, despite the stated strategy of screening for ‘low beta’ stocks. Based on a composite score analysis that combine rankings on returns, fees, risk, and yield, the DIV ETF comes last out of 7 funds I have analyzed. I would avoid this fund.
Be the first to comment