

Oleksii Liskonih/iStock via Getty Images
This dividend exchange-traded fund (“ETF”) article series aims at evaluating products regarding the relative past performance of their strategies and quality metrics of their current portfolios. As holdings and weights change over time, I post updated reviews when necessary.
DGS strategy and portfolio
The WisdomTree Emerging Markets SmallCap Dividend ETF (NYSEARCA:DGS) has been tracking the WisdomTree Emerging Markets SmallCap Dividend Index since 10/30/2007. As of writing, it has 1006 holdings, a distribution yield of 5.49% and a total expense ratio of 0.58%.
As described by WisdomTree, eligible companies must:
- Be investable by foreign institutions regarding corporate, industry and country rules.
- Have a market capitalization of at least $100 million, an average daily dollar volume of at least $100,000 for three months preceding the annual index reconstitution and a monthly volume above 250,000 shares for six months.
- Not be in the bottom decile of a risk score based on quality (profitability ratios) and momentum (6 and 12 months risk-adjusted returns).
- Not be in the top 5% of the stock universe in yield and in the riskiest half regarding the above-mentioned score.
- Be in the bottom 25% of the stock universe in market capitalization.
- Have paid regular cash dividends in the 12 months preceding the annual reconstitution.
The index uses a modified capitalization-weighted methodology. The portfolio has four major sectors: technology (16.7%), financials (15.1%), industrials (14.4%), materials (13.5%). Other sectors are below 10%.
DGS sectors (chart: author; data: WisdomTree)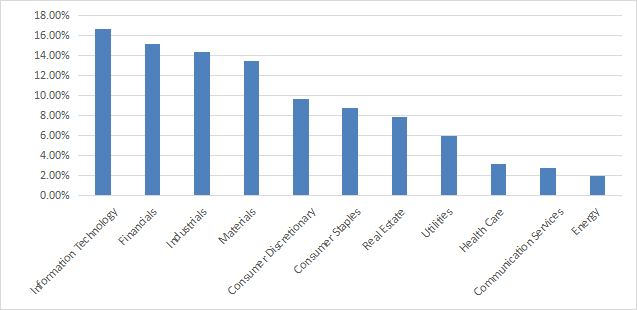
The top three countries are Taiwan (26.1%), China (11.2%) and South Korea (11.2%). Other countries are below 10%. China, Taiwan and Hong Kong weigh almost 41% together, which represents a huge exposure to geopolitical and regulatory risks related to China. The next chart lists the top ten countries, with an aggregate weight of 92%.
DGS countries (chart: author; data: WisdomTree)
The top 10 holdings, listed below, represent 9% of asset value. No company weighs more than 2%, so risks related to individual stocks are low.
|
Name |
Ticker |
Weight |
|
Transmissora Alianca de Energia Eletrica SA |
TAEE11 BS |
1.83% |
|
African Rainbow Minerals Ltd |
ARI SJ |
1.00% |
|
Royal Bafokeng Platinum Ltd |
RBP SJ |
0.96% |
|
Synnex Technology International Corp |
2347 TT |
0.89% |
|
Truworths International Ltd |
TRU SJ |
0.80% |
|
Banco Del Bajio Sa |
BBAJIOO MM |
0.77% |
|
Spar Group Ltd/The |
SPP SJ |
0.74% |
|
Chicony Electronics Co Ltd |
2385 TT |
0.71% |
|
Meritz Securities Co Ltd |
008560 KS |
0.69% |
|
AVI Ltd |
AVI SJ |
0.64% |
Past performance compared to competitors
The next table compares DGS performance since March 2008 with five international dividend ETFs:
- The SPDR S&P International Dividend ETF (DWX), reviewed here.
- The WisdomTree Global ex-U.S. Quality Dividend Growth Fund (DNL), reviewed here.
- The iShares International Select Dividend ETF (IDV), reviewed here.
- The First Trust Dow Jones Global Select Dividend ETF (FGD), reviewed here.
- The Invesco International Dividend Achievers ETF (PID), reviewed here.
|
since 3/1/2008 |
Total Return |
Annual.Return |
Drawdown |
Sharpe |
Volatility |
|
DGS |
72.28% |
3.84% |
-56.67% |
0.25 |
21.50% |
|
DWX |
0.46% |
0.03% |
-67.03% |
0.08 |
21.35% |
|
DNL |
94.79% |
4.72% |
-37.60% |
0.32 |
17.56% |
|
IDV |
44.46% |
2.58% |
-65.17% |
0.2 |
21.59% |
|
FGD |
64.48% |
3.51% |
-65.29% |
0.24 |
21.21% |
|
PID |
59.71% |
3.30% |
-63.18% |
0.24 |
19.68% |
Data calculated with Portfolio123
DGS beats them all except DNL. International funds have underperformed the U.S. market: SPY has returned 320% in the same time (10.4% annualized).
However, in the last 12 months PID is the best performer in the list:
DGS vs. Competitors (12 months) (Portfolio123)
DGS share price is close to flat since inception: it has lost a bit more than 6%.
DGS share price (TradingView on SeekingAlpha)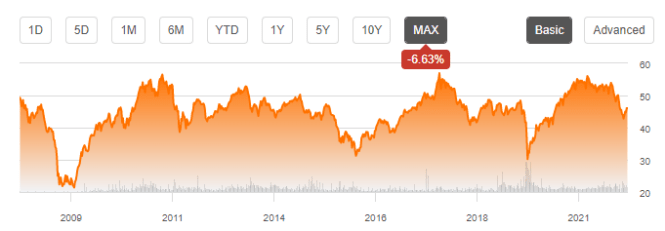
Takeaway
DGS is a well diversified fund invested in over 1000 dividend paying small cap companies from emerging markets. It implements a risk filter to avoid the worst yield traps. It is slightly overweight in technology, but quite balanced in the top four sectors, including industrials, materials and financials. The heaviest country in asset value is Taiwan with 26%. The fund has beaten several competitors since inception, but it lags behind DNL. A big red flag is the 40% exposure to geopolitical risks related to China. For transparency, a dividend-oriented part of my equity investments is split between a passive ETF allocation (DGS is not part of it) and my actively managed Stability portfolio (14 stocks), disclosed and updated in Quantitative Risk & Value.
Be the first to comment