

courtneyk/E+ via Getty Images
(This article was co-produced with Hoya Capital Real Estate.)
It’s been about 3 years since I included WisdomTree U.S. Dividend Growth ETF (NASDAQ:DGRW) in a two-part series of articles comparing 5 monthly dividend payers. I thought it about time to return for a second look.
DGRW – Examining The Methodology
DGRW is based on the WisdomTree U.S. Quality Dividend Growth Index. WisdomTree uses a most interesting methodology in the development of this index, one that varies in several ways from most of its competitors.
For example, Vanguard Dividend Appreciation ETF (VIG), a preeminent exchange-traded fund (“ETF”) in the space, tracks the S&P U.S. Dividend Growers Index, which provides a market-cap-weighted portfolio of stocks with at least 10 consecutive years of increasing their regular dividend payments. Fairly simple, right? A quality screen, but applied with a market-cap weighting.
In the case of DGRW, the index on which it is based is actually a subset of a larger index from WisdomTree, the WisdomTree U.S. Dividend Index. The series of quotes that follow are all from the methodology document for this parent index as well as all sub-indexes derived therefrom.
First off, the requirements for inclusion in the parent index.
To be eligible for inclusion in the Domestic Dividend Indexes, a company must list its shares on a U.S. stock exchange, be incorporated and headquartered in the United States and pay regular cash dividends on shares of its common stock in the 12 months preceding the annual reconstitution, which takes place in December. Companies need to have a market capitalization of at least $100 million . . . and shares of such companies need to have had an average daily dollar volume of at least $100,000 for three months preceding the Screening Date.
From there, a quality screen is applied to filter out lower-quality stocks.
Companies that fall within the bottom decile of a composite risk factor score, which is composed of on equally weighted score of the below two factors, are not eligible for inclusion.
Quality Factor – determined by static observations and trends of return on equity (ROE), return on assets (ROA), gross profits over assets and cash flows over assets. Scores are calculated within industry groups.
Momentum Factor – determined by stocks’ risk adjusted total returns over historical periods (6 and 12 months)
Companies that fall within the top 5% ranked by dividend yield and also the bottom 1⁄2 of the composite risk factor score are not eligible for inclusion.
As I have featured in multiple previous articles, the elimination of stocks paying the very highest dividends is designed to reduce risk, as it is often the case that such dividends are abnormally high for a reason, including that such companies are in financial distress.
Here is where things get a little more interesting. As opposed to weighting companies that pass the above tests by market cap, the index weights by the total amount of dividends to be paid.
The initial weight of a component in the Index at the annual reconstitution is equal to the dollar value of the company’s cash dividends to be paid in the coming year based on the company’s indicated annual dividend per share. To calculate the weighting factor – Cash Dividends to be paid – indicated annual dividend per share is multiplied by common shares outstanding. Thus, each component’s weight . . . reflects its share of the total Dividend Stream projected to be paid in the coming year by all of the component companies in the Index.
Just to reiterate, everything I have cited so far holds true for the parent index. Moving specifically now to the sub-index on which DGRW is based, here’s the last relevant detail.
In the case of the WisdomTree U.S. Quality Dividend Growth Index, the following capping rules are applied in this order:
The maximum weight of any individual security is capped at 5% on the annual rebalance prior to the introduction of sector caps and the weights of all other components will be adjusted proportionally.
Should the technology sector achieve a weight equal to or greater than 25% of the Indexes, weight of companies will be proportionally reduced to 25% as of the annual Screening Date.
Real Estate sector will be capped at 10%.
All other sectors will be capped at 20%.
With those details from the prospectus well in hand, we will next take a look at how all of this translates in the real world.
DGRW – Overview and Competitive Landscape
In this section, I will feature several wonderful graphics, all drawn either from Seeking Alpha or Hoya Capital Income Builder.
The first 3 sets will come from DGRW’s home page here on Seeking Alpha. Let’s look first at this helpful screen capture, which displays the fund’s sector breakdown, as well as its Top 10 holdings. I will then offer a little commentary.
DGRW: Sector Breakdown, Top 10 Holdings (Seeking Alpha)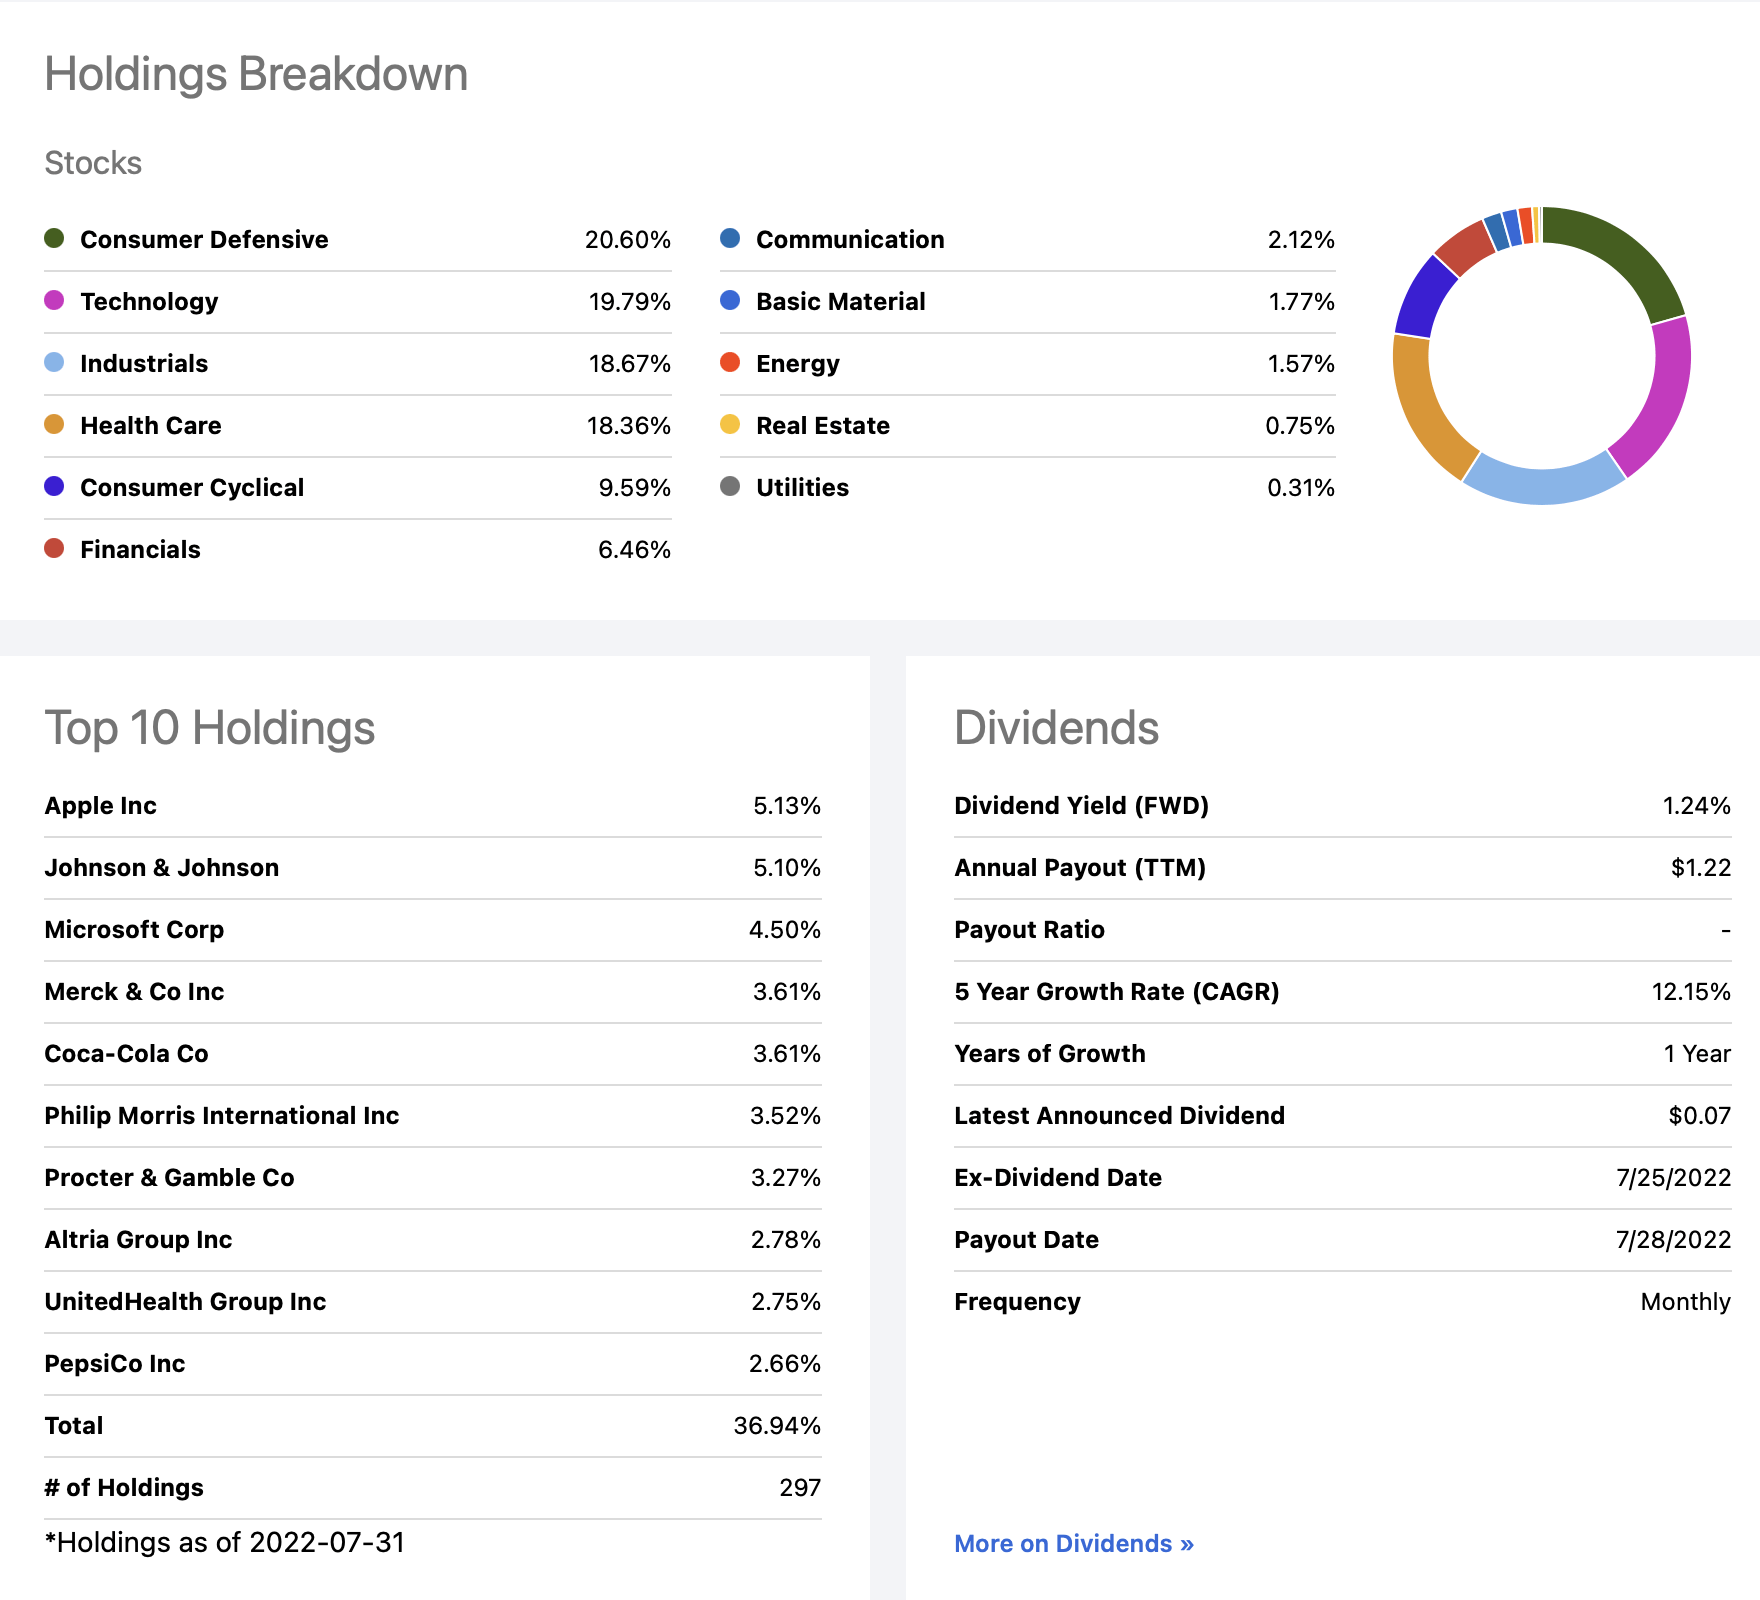
As can be seen, DGRW targets extremely high-quality stocks which should be able to generate solid earnings growth even in the midst of challenging environments.
In comparison with VIG, featured earlier in the article, I would like you to notice a philosophical difference. While VIG—with its requirement of 10 consecutive years of dividend increases—looks more to the past, DGRW looks more to the future. As one example, Apple Inc. (AAPL) is in DGRW, while it is not currently in VIG. (NOTE: Since AAPL restarted regular dividends in 2012, it will soon be eligible for consideration in VIG.)
This might be considered a double-edged sword. Since DGRW selects stocks with more of a focus on estimated earnings growth, there may be less of a guaranty of long-term outperformance or dividend increases.
On the other hand, the dividend-weighting approach may serve to limit the fund’s exposure to overpriced stocks. Since the index weights based on dividends, it tends to rebalance out of companies whose prices have soared relative to their dividends and into companies that may offer better value. At the same time, this can also have the effect of rebalancing out of the companies that offer the greatest growth potential.
Still working from the DGRW page on Seeking Alpha, I quickly built a comparative look at 4 of DGRW’s major competitors. Have a look.
First, a high-level overview of things such as longevity, AUM, and expense ratio.
DGRW vs. Major Competitors – Overview (Seeking Alpha)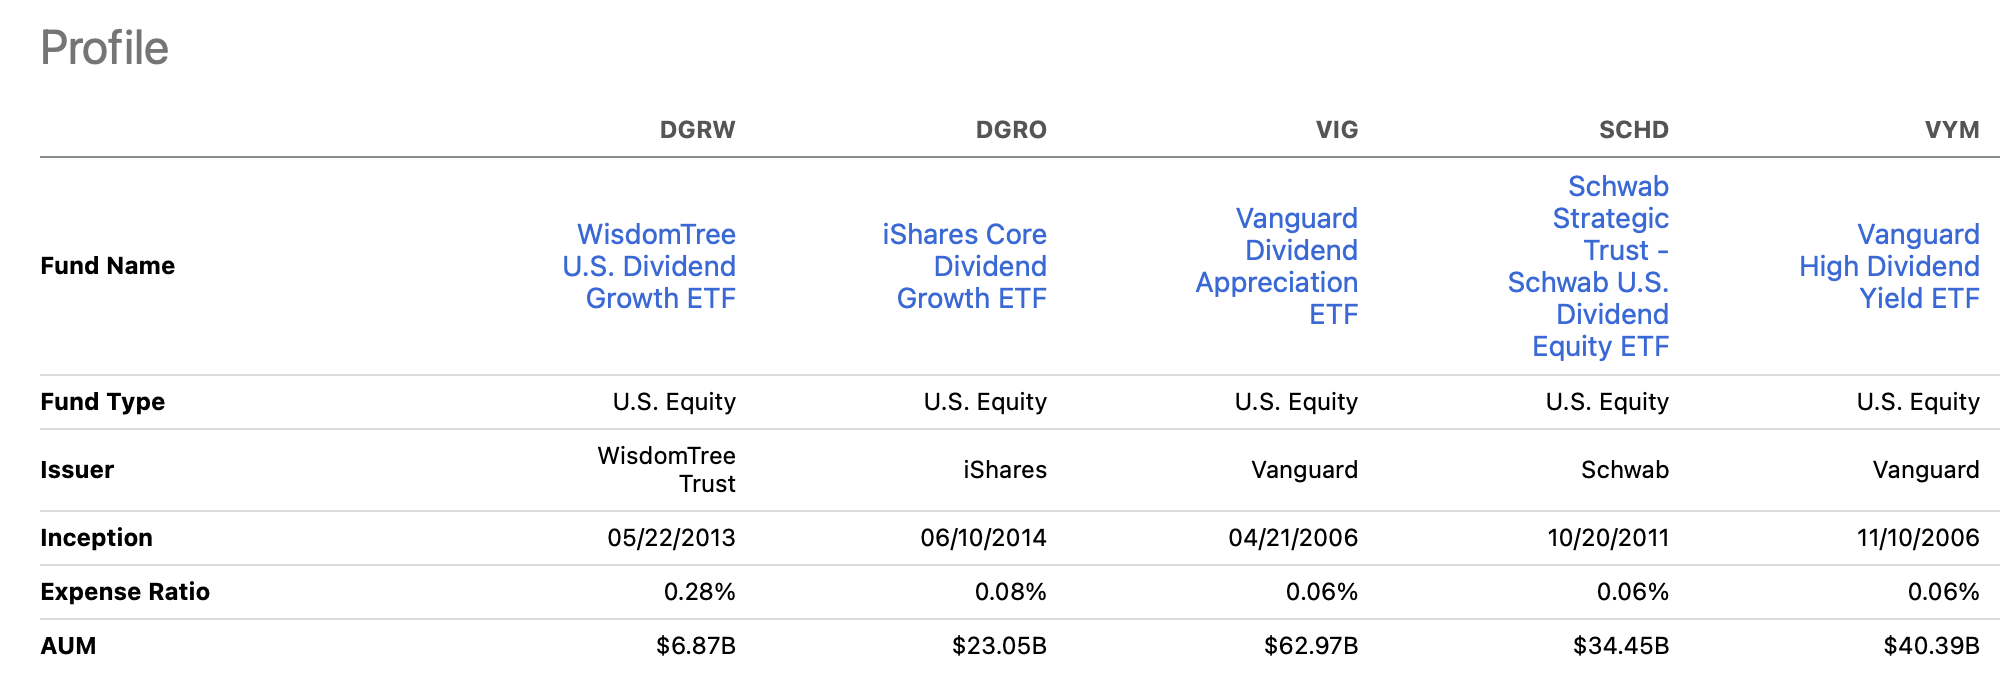
Next, a comparative look at dividend performance since, after all, these are dividend-focused ETFs we are considering.
DGRW vs. Major Competitors – Dividends (Seeking Alpha)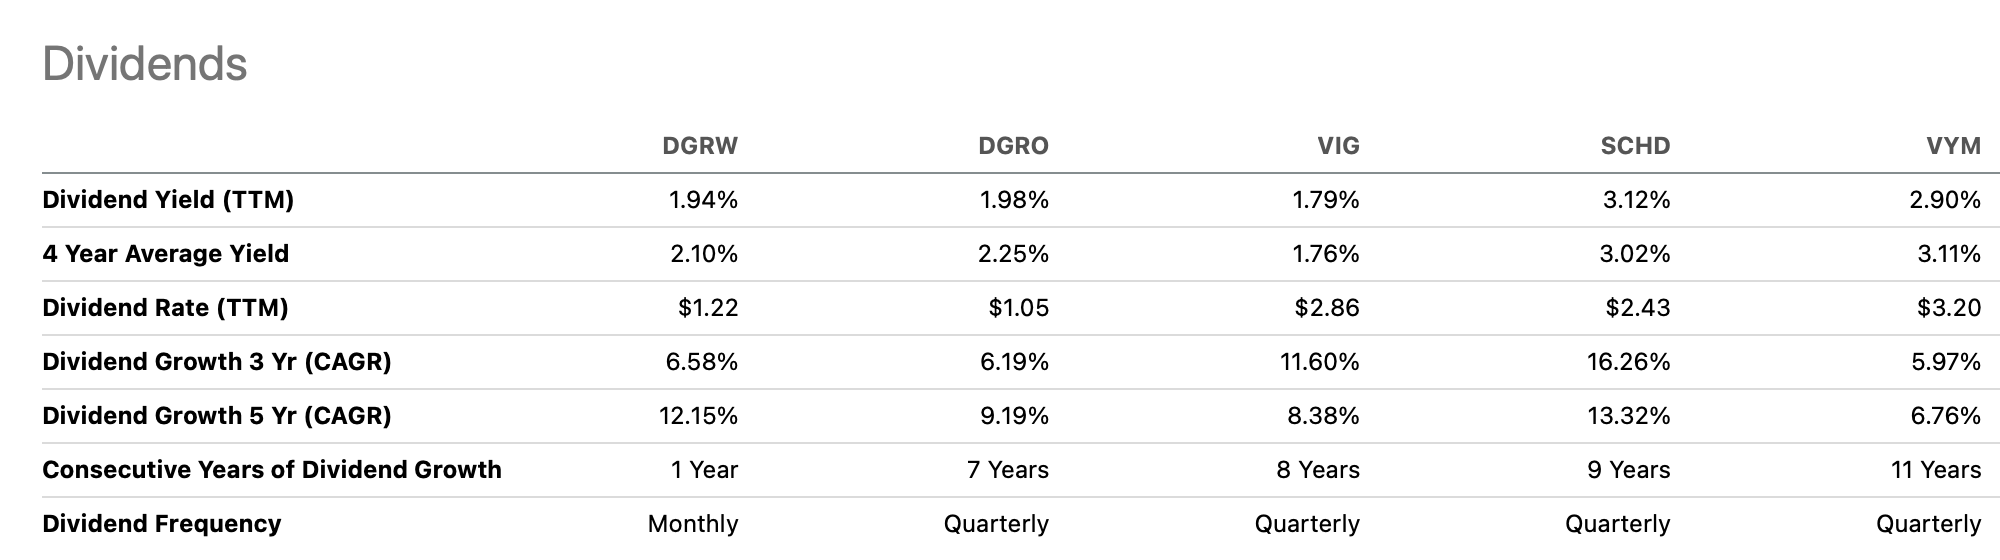
Finally, courtesy of Hoya Capital Income Builder, a look at historical performance.
DGRW vs. Major Competitors – Historical Performance (Hoya Capital Income Builder)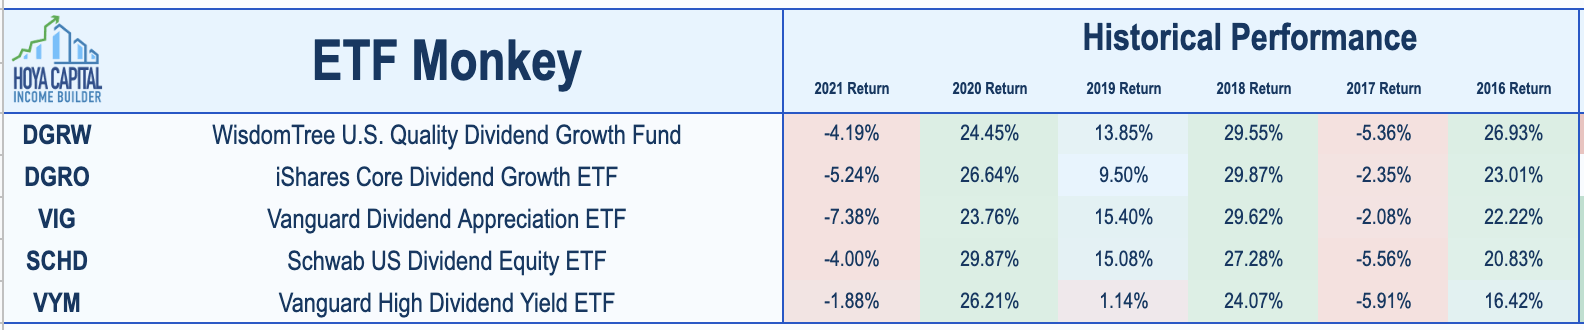
What are my takeaways from all of this?
In short, DGRW is a solid fund. And a somewhat unique feature it offers is that it pays dividends on a monthly basis. If that is important to you, DGRW may well deserve a place in your portfolio.
At the same time, I think some of DGRW’s competitors are better choices for most investors. Looking at the overview graphic above, it becomes clear that DGRW’s expense ratio of .28% is on the high side. From the start, this fund needs to consistently outperform the competition by roughly .20% for the investor to break even. Perhaps that is why all 4 of the competitors I selected have AUM of roughly 4x – 10x that of DGRW?
Moving to the second graphic in the set, that of dividends, again it appears you can do just as well, if not better, with one or more of its competitors.
And lastly, in terms of historical performance, again, it just seems you can do better elsewhere.
Summary and Conclusion
If receiving monthly dividends is important to you, DGRW may have something to offer. The solid series of screens through which potential constituents much pass ensures that your investment will be in extremely high-quality stocks which should be able to generate solid earnings growth even in the midst of challenging environments.
At the same time, watch out for those fees. That expense ratio of .28% is deducted in both good times and bad. As a result, it just seems to me that investors have too many other options from which to choose.
Be the first to comment