

PeskyMonkey/iStock via Getty Images
Usually when you hear the term, ‘things don’t always go according to plan’, you might initially think there’s something has gone horribly wrong when you were expecting it to go right. But sometimes, the opposite takes place. Sometimes, the outcome has been far better than you anticipated. Such a case can be seen by looking at specialty retailer Destination XL Group (NASDAQ:DXLG). With an emphasis on producing and selling clothing for plus-sized men, the company may not seem like the type of firm to shock investors. But that is precisely what management did earlier this year with an upward revision in expectations for the 2022 fiscal year. Given this change and in spite of the fact that shares of the company are a bit pricier than when I last wrote about it, I do think now is a good time to increase my rating on the company from a ‘hold’ to a ‘buy’.
Big changes
Back in June of this year, I wrote an article about Destination XL Group wherein I stated that I was starting to like the company’s picture less and less. Even though the firm had done well from a revenue and profitability perspective over the prior few months, allowing shares to drop only 6.4% compared to the 9.1% seen by the S&P 500 over the same window of time, the company was also forecasting financial results that would have translated to a deterioration on its bottom line. While shares of the company were still quite cheap, I continued to be discouraged by the decline in store count the company had experienced in prior years and by expectations from management that EBITDA would decline substantially year over year. This all led me to revise my rating on the company down from a ‘buy’ to a ‘hold’. Unfortunately, this call was way too early. Since the publication of my latest article on the company, shares have risen by 110% compared to the 6.3% increase experienced by the S&P 500 over the same window of time.
Author – SEC EDGAR Data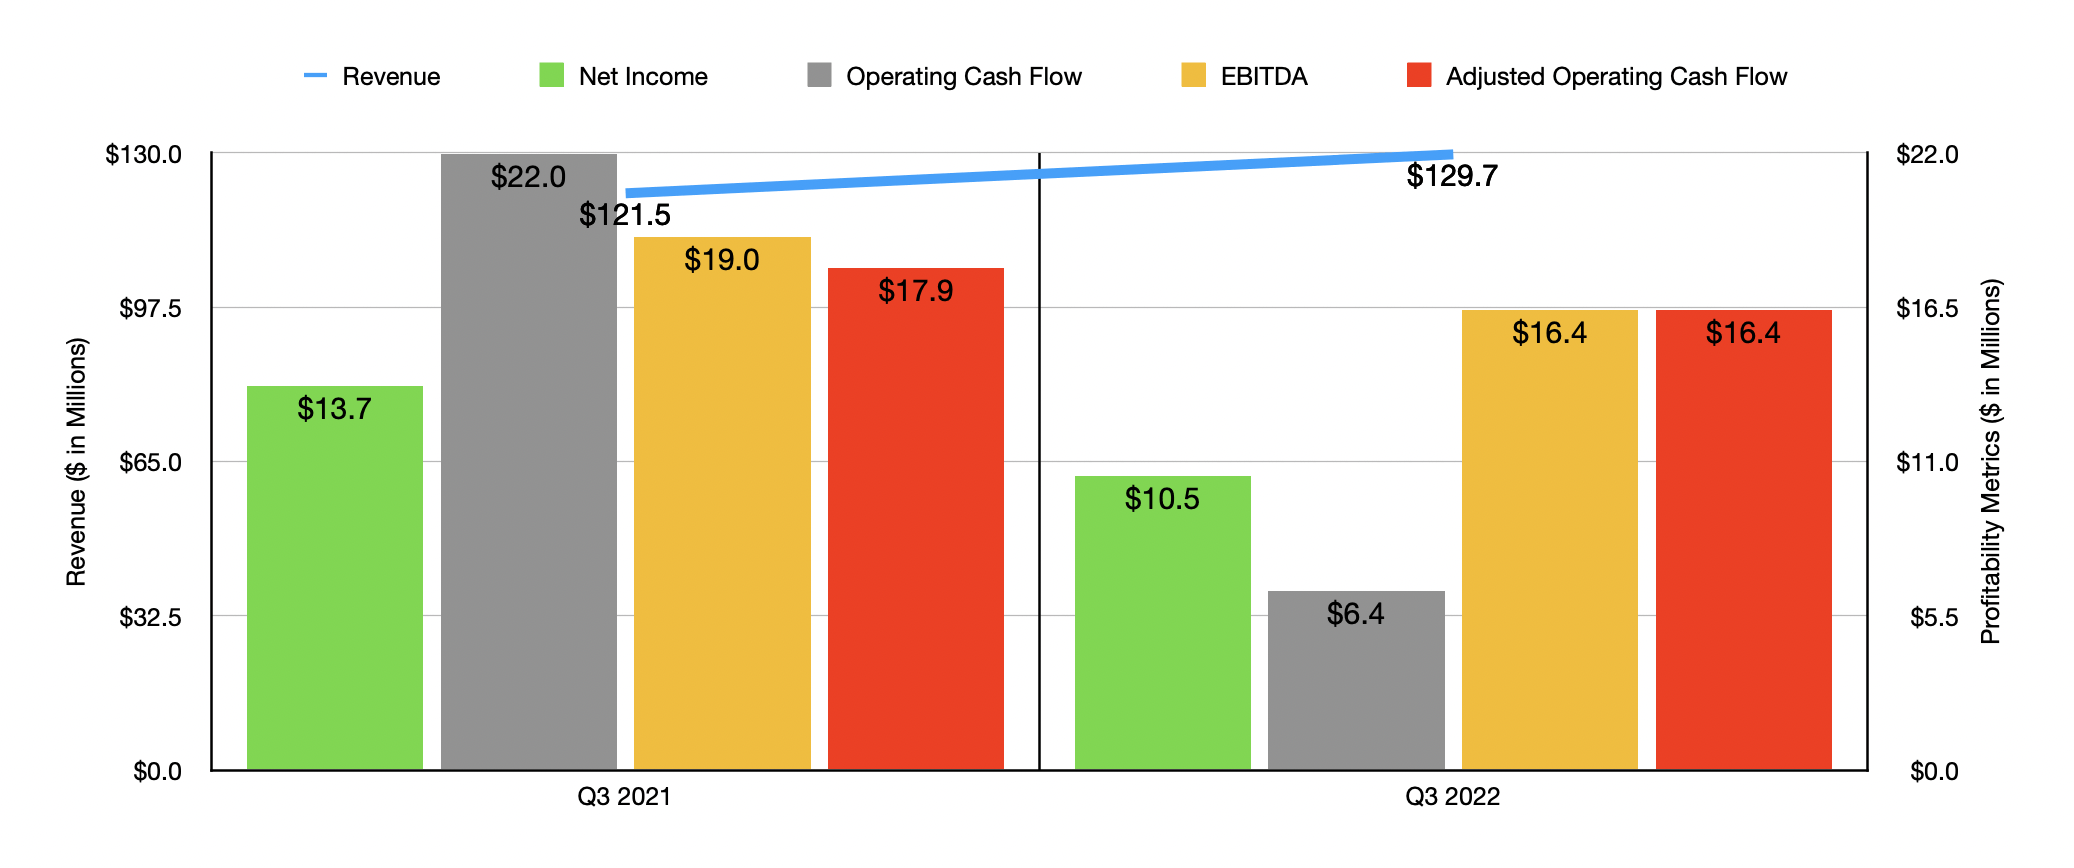
Normally when you see a move higher of this magnitude, it’s because the company is being acquired or merging with another player. But the real culprit here is outstanding fundamental performance that even management did not forecast. To see what I mean, I would like to point you to data from the third quarter of the 2022 fiscal year. During that quarter, sales came in at $129.7 million. This represents an increase of 6.7% over the $121.5 million the company generated the same time last year. This rise, according to management, was driven by an 8.7% improvement in comparable sales, with comparable store sales alone growing by 10.1% year over year. Management attributed this increase largely to a rise in dollars per transaction spent at its stores and online. This came as the company reduced its reliance on promotions and made a shift in merchandise mix to higher-priced items such as tailored clothing.
This is not to say that everything was great during the quarter. Net income still fell, dropping from $13.7 million in the third quarter of 2021 to $10.5 million to the same time this year. Although the company’s cost of goods sold actually improved modestly, selling, general, and administrative costs in relation to revenue increased from 34.5% to 37.3%. This rise, management said, was driven by an increase in marketing costs aimed at driving customer acquisition. Higher payroll costs and performance-based incentive accruals also played a role here. Other profitability metrics unfortunately followed suit. Operating cash flow dropped from $22 million to $6.4 million. But if we adjust for changes in working capital, it would have fallen more modestly from $17.9 million to $16.4 million. Even EBITDA took a step back, dipping from $19 million to $16.4 million.
Author – SEC EDGAR Data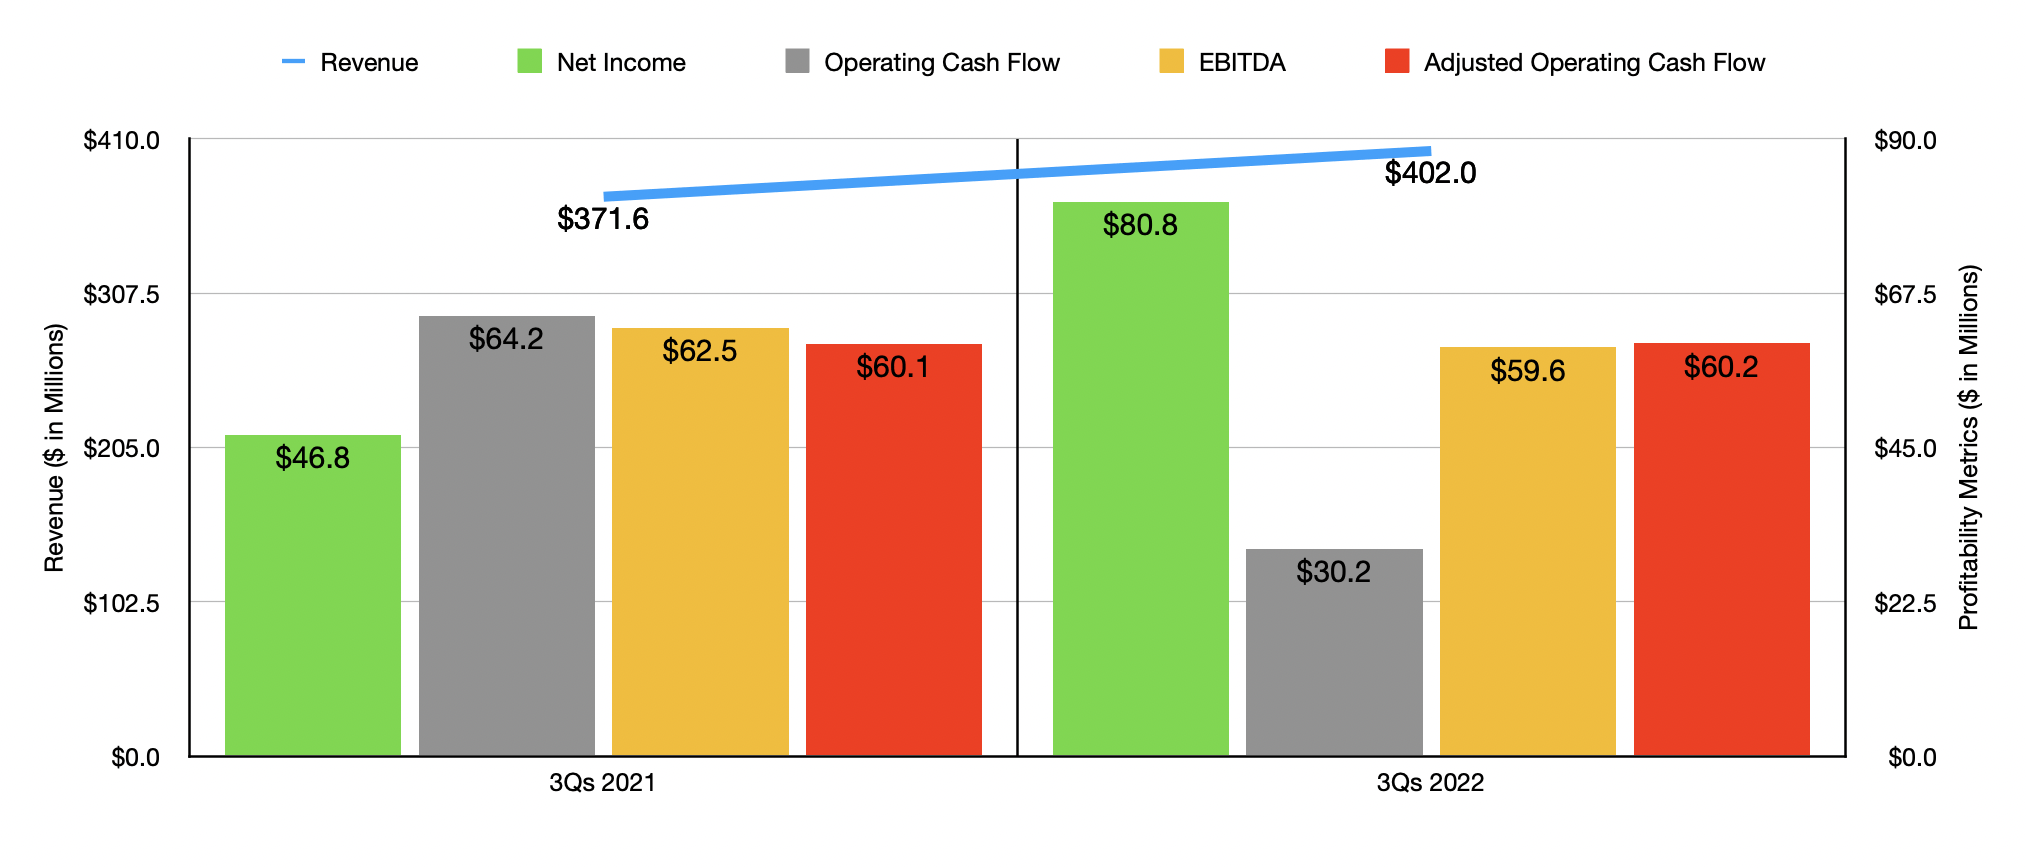
When it comes to the first three quarters of 2022 is a whole, results have remained mixed. Revenue is still up, having risen from $371.6 million to $402 million. Net income has also improved, climbing from $46.8 million to $80.8 million. But we do need to keep in mind that this net income figure included a $32.9 million tax benefit that will not be repeatable. We did see an unfortunate decline in operating cash flow from $64.2 million to $30.2 million. But if we adjust for changes in working capital, it would have inched up from $60.1 million to $60.2 million. Meanwhile, EBITDA pulled back slightly, dropping from $62.5 million to $59.6 million.
When it comes to the 2022 fiscal year in its entirety, this is where the rubber meets the road. Previously, management was forecasting sales for this year of between $510 million and $530 million. That number has since been pushed up to be between $535 million and $545 million. Meanwhile, the EBITDA margin was forecasted to be in excess of 10%, implying EBITDA of no less than $52 million at the midpoint. Had this come to fruition, it would have represented a significant decline over the $76.9 million the company achieved in 2021. But now, that margin has been pushed up to roughly 13% at the midpoint, implying a reading of $70.2 million. No guidance was given when it came to other profitability metrics. But if we assume that adjusted operating cash flow can be annualized, then we would expect a reading this year of $74.5 million.
Author – SEC EDGAR Data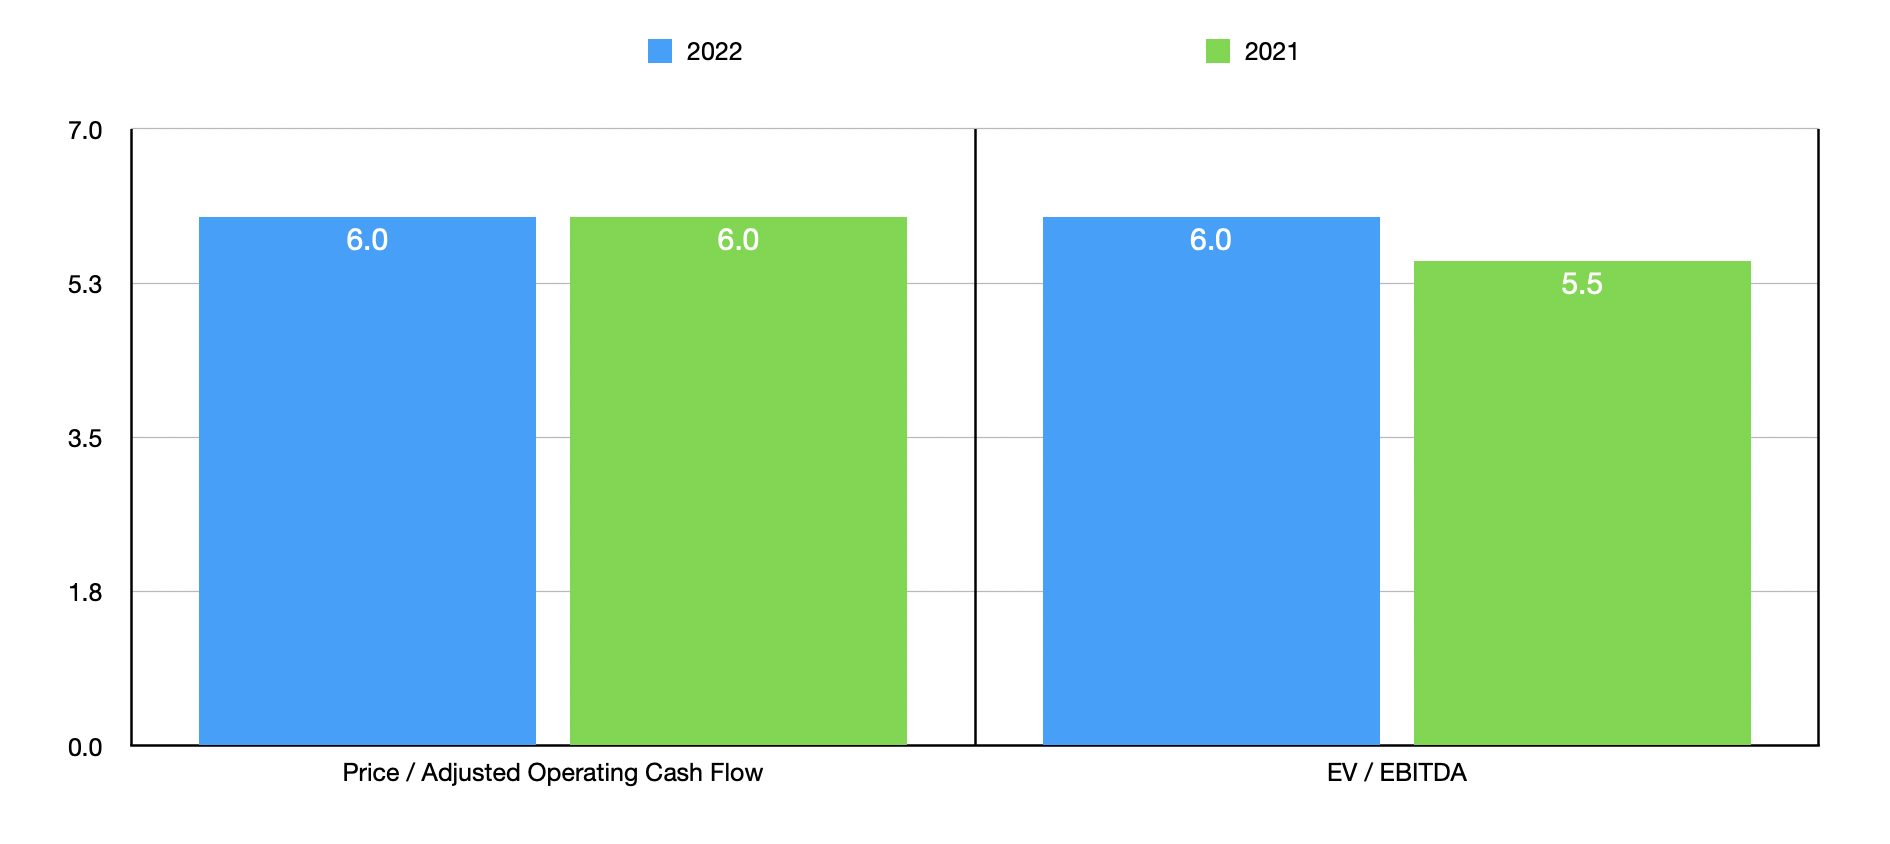
Based on these figures, the company is trading at a forward price to adjusted operating cash flow multiple of 6 and at a forward EV to EBITDA multiple of 6 as well. By comparison, using the data from 2021, these multiples would be 6 and 5.5, respectively. As part of my analysis, I also compared Destination XL Group to five similar firms. On a price to operating cash flow basis, these companies ranged from a low of 3.4 to a high of 15.6. In this case, two of the five companies were cheaper than our prospect. Using the EV to EBITDA approach instead, we would end up with a range of between 1.9 and 3.7. In this scenario, our prospect was the most expensive of the group.
| Company | Price / Operating Cash Flow | EV / EBITDA |
| Destination XL Group | 6.0 | 6.0 |
| Citi Trends (CTRN) | 3.4 | 1.9 |
| Express (EXPR) | 7.7 | 2.8 |
| J.Jill (JILL) | 4.4 | 3.7 |
| Tilly’s (TLYS) | 15.6 | 2.5 |
| Torrid Holdings (CURV) | 7.1 | 3.3 |
Takeaway
I understand why some investors might be skittish about Destination XL Group. I’m not a particularly large fan of the clothing retail space and I do believe that the broader economy May face some issues ahead. Having said that, with no debt on its books and $23.5 million in cash on hand, this particular player looks pretty stable. Add on top of this the fact that management has become much more optimistic about the current fiscal year and factor in how shares are priced today, and I do believe that an upgrade from a ‘hold’ to a soft ‘buy’ is warranted at this time.
Be the first to comment