

FS-Stock/iStock via Getty Images
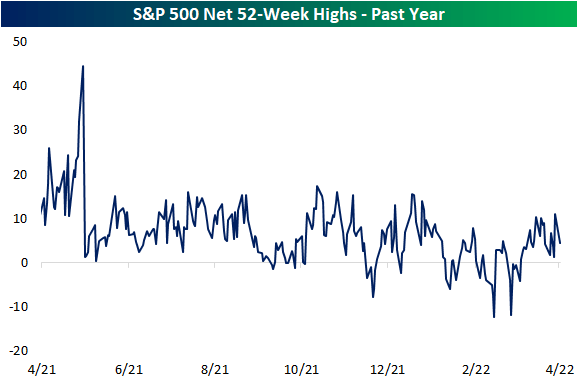
The S&P 500 has fallen in four of the past five sessions continuing to pull back from its lower high, but surprisingly, the net percentage of the index hitting new 52-week highs actually saw one of the strongest readings of the year on Friday as we show in the chart from our Sector Snapshot below. To cap off last week, a net 11% of S&P 500 stocks were at new 52-week highs; the highest reading since January 5th which was only a couple of days after the index’s last all-time high. Typically, we look at net new highs as a way to confirm moves in the broader market. In other words, it is viewed as better to see a larger number of stocks trading at new highs versus new lows. While net new highs are so far lower today, Friday’s double-digit positive reading was unusually high for a down day. Historically going back to 1990, the average net new high reading when the S&P 500 has been lower on the day has only been 1.6%. It was even a strong reading compared to the average for up days (4.77%) as well.
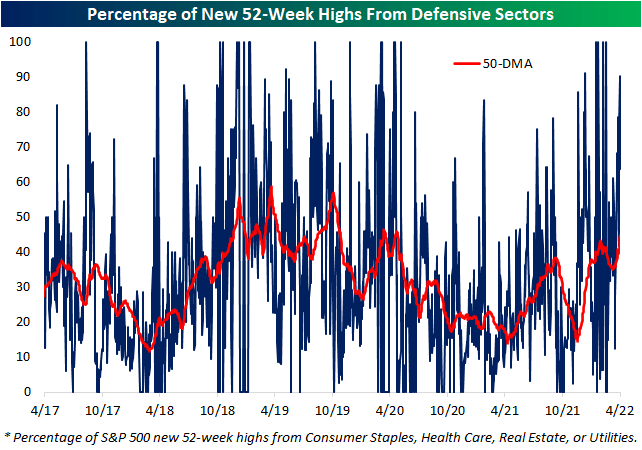
As for how new highs have held up relatively well as the broader market has pulled back, defensive sectors – Consumer Staples, Health Care, Utilities, and Real Estate – are almost entirely the ones to thank. To illustrate this, below we show the daily percentage of S&P 500 stocks hitting new highs that are from one of the four defensive sectors just mentioned. There is plenty of precedent in the past several years for these four sectors to account for all of a day’s new highs including several days in late January and early February. At the high last Wednesday, over 90% of S&P 500’s new highs came from defensive sectors. On a 50-DMA basis, this reading is now at the highest level since the spring of 2020.
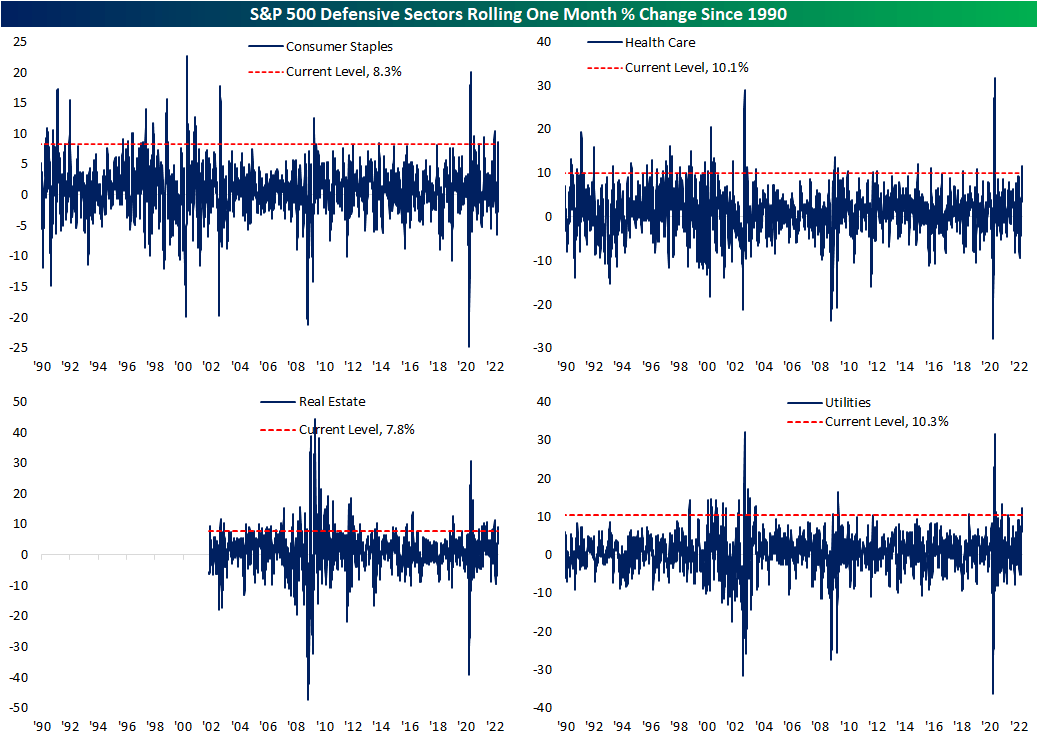
In other words, defensives have been a notable pocket of strength recently. As for just how large of a run they have been on, in the charts below, we show the rolling one-month change of these sectors going back to 1990 (2001 for Real Estate). While the rates of change have peaked, Health Care and Utilities are up double digits in the past month while Consumer Staples and Real Estate have risen high-single-digit percentage points. For all sectors except for Real Estate, those rallies rank in the top 3% of all monthly moves since 1990, and Real Estates is still in the top decile of all monthly moves going back to 2001.
Editor’s Note: The summary bullets for this article were chosen by Seeking Alpha editors.
Be the first to comment