

Canadian Dollar Talking Points
USD/CAD appears to be mirroring the price action from last month as it quickly pulls back from a fresh yearly high (1.3079), and the exchange rate may face a further decline over the coming days amid the failed attempts to retrace the decline from the November 2020 high (1.3371).
USD/CAD Forecast: Decline from June High Mirrors Price Action from May
USD/CAD looks poised to push back below the 50-Day SMA (1.2810) after the advance from the monthly low (1.2518) failed to push the Relative Strength Index (RSI) into overbought territory, and the exchange rate may continue to carve a series of lower highs and lows over the remainder of the week as the bullish momentum abates.
As a result, USD/CAD may track the June range ahead of the Bank of Canada (BoC) interest rate decision on July 13 as the ongoing rise in Canada’s Consumer Price Index (CPI) puts pressure on the central bank to normalize monetary policy at a faster pace, and it remains to be seen if Governor Tiff Macklem and Co. will step up their efforts to combat inflation as the “the Governing Council is prepared to act more forcefully if needed to meet its commitment to achieve the 2% inflation target.”
Until then, USD/CAD may continue to give back the monthly low (1.2518) as it extends the series of lower highs and lows from last week, and a further decline in the exchange rate may lead to a flip in retail sentiment like the behavior seen during the previous month.
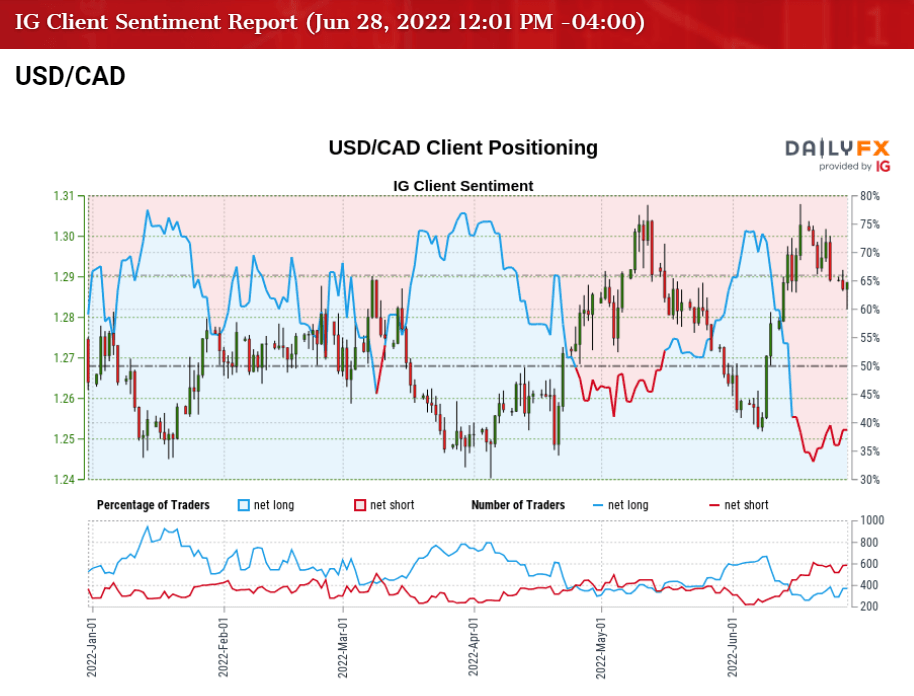
The IG Client Sentiment report shows 40.69% of traders are currently net-long USD/CAD, with the ratio of traders short to long standing at 1.46 to 1.
The number of traders net-long is 7.82% higher than yesterday and 38.41% higher from last week, while the number of traders net-short is 1.22% higher than yesterday and 7.17% lower from last week. The jump in net-long interest has alleviated the tilt in retail sentiment as 38.27% of traders were net-long USD/CAD last week, while the decline in net-short position comes as the exchange rate comes up against the 50-Day SMA (1.2810).
With that said, USD/CAD may largely mirror the price action from May as it extends the decline from the yearly high (1.3079), and the exchange rate may continue to give back the advance from the monthly low (1.2518) as it extends the series of lower highs and lows from last week.
USD/CAD Rate Daily Chart

Source: Trading View
- Keep in mind, USD/CAD cleared the May high (1.3077) as it climbed to a fresh yearly high (1.3079) earlier this month, but the exchange rate appears to be mirroring the price action from last month following the failed attempt to close above the 1.3030 (50% expansion) to 1.3040 (50% expansion) region.
- In turn, USD/CAD may continue to give back the advance the monthly low (1.2518) as it failed to push the Relative Strength Index (RSI) into overbought territory, but need a close below the Fibonacci overlap around 1.2830 (38.2% retracement) to 1.2880 (61.8% expansion) along with a move below the 50-Day SMA (1.2810) to bring the 1.2770 (38.2% expansion) area back on the radar.
- A move below the 200-Day SMA (1.2674) opens up the 1.2620 (50% retracement) to 1.2650 (78.6% expansion) region, with the next area of interest coming in around 1.2510 (78.6% retracement), which largely lines up with the monthly low (1.2518).
— Written by David Song, Currency Strategist
Follow me on Twitter at @DavidJSong
Be the first to comment