


Andrii Yalanskyi/iStock via Getty Images
This article is coproduced with Williams Equity Research (‘WER’).
Many retirees look to the BDC sector as complementary to their REIT and MLP exposure, and we consider all three high-income alternatives to be terrific for income as well as for diversification.
iREIT on Alpha
As part of our continued effort to expand our income-oriented coverage spectrum, we have incorporated BDC coverage as means to provide enhanced value.
Of course, just as we found in the REIT and MLP sectors, there are nuances that require education, and thus we have decided that one way that we can provide “alpha” on Seeking Alpha is to debunk the myths as a means to educate readers.
Time For Round 2
As mentioned in Part I, Business Development Companies (“BDCs”), like Real Estate Investment Trusts (“REITs”) and Master Limited Partnerships (“MLPs”) are special company structures created by legislation to solve certain problems. Revisit Part I for a quick overview of why REITs and MLPs were created by Congress.
BDCs, unlike REITs and MLPs, are not focused on the ownership of hard assets. Instead, BDCs are required to invest at least 70% of assets in the debt and or equity of U.S. businesses. These are almost always private companies that don’t have many options outside of the BDC lending system for external financing. In addition to the constraint on the types of investments they can make, there are limits BDC leverage.
As noted in Part I, the positive attributes of (most) BDCs include floating rate investments less sensitive to changes in interest rates, average yields above 7%, highly diversified loan pools, and a proven business model that precedes the Great Recession.
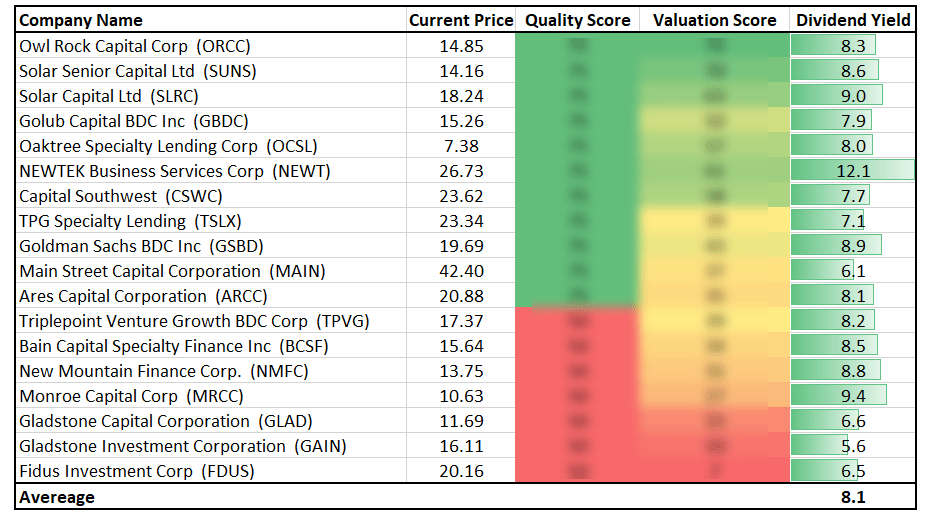
Some BDCs maintain significant (>25% of the portfolio by gross assets) equity holdings, such as Main Street Capital (MAIN) and Ares Capital Corp (ARCC), while others shy away from equity exposure and invest almost exclusively in senior secured loans, such as Owl Rock Capital Corp (ORCC) and Golub Capital BDC (GBDC).
This is a good time to make a few points. This is not a BDC popularity contest. There’s no need to become emotional if your favorite BDC isn’t mentioned. If curious if your favorite BDC meets certain qualifications, you’re welcome to shoot me a note.
BDCs tend to illicit one of two responses: marked enthusiasm or “I’ll never invest in BDCs.” The reason is usually one of these four perceptions/situations:
- Poor performance and corporate governance concerns of certain non-traded BDCs;
- Poor performance and corporate governance concerns of certain publicly traded BDCs and their external managers;
- Confusion around the return profile of BDCs in general; and/or
- Confusion around what BDCs do and own in their portfolios.
This article is designed to do what the title says: Articulate several common BDC misconceptions and provide a brief but useful explanation of what is right and wrong about each. It is not, however, intended to comment on every BDC or touch on topics reserved for Part I and potentially Part III.
As a reminder, these are the first set we tackled in Part I:
- BDCs Are Too Risky
- Those Must Be Sucker Yields
- High Loan Default Rates
There are reasonable justifications as to why these assumptions are held by many. Believing one or more are true before or after reading this article is not cause for alarm or a reflection of your investing acumen. This series designed to test assumptions by telling the whole story.
I know you’ve all been waiting anxiously, so let’s get started with the first BDC misconception we are tackling today.
4. Supplemental Dividends Are Everything
This opinion seems to have grown in popularity in recent months to the point that every BDC article I author receives multiple comments along this line. The reasoning goes something along:
BDC XYZ doesn’t pay special/supplemental distributions. The best performing BDCs pay them regularly. If it isn’t generating special distributions, something is clearly wrong and I’m out.
The other is:
BDC XYZ generated special/supplemental distributions in the past but hasn’t lately. For that sole reason, I’m dumping the stock and will criticize it every opportunity I get.
A few of my more experienced readers might be thinking “wait a second, hasn’t WER stated that the top performing BDCs have paid significant supplemental dividends over time?”
They are right, but there’s more to the story.
Investing 101 includes the adage if you want more return, you’ll have to accept greater risk. If we take a diversified group of companies with low, medium, and high-risk strategies, it’s reasonable to assume zero of the lowest risk companies will be top performers, a couple medium risk could be near the top, and most spots will be held by those that targeted the highest potential economic return.
Simultaneously, the lowest risk companies are proportionally absent from the lowest performing subgroup and that’s the tradeoff. In BDC terms, those with significant (>25%) equity holdings are, by definition, taking greater risk than if holding first lien senior secured loans tied to the same portfolio companies.
Two of the top performing BDCs, MAIN and ARCC, both consistently hold double-digit percentage of equity and have fantastic track records of transforming that part of the portfolio into capital gains over time. Both firms have met or exceeded the total return of the S&P 500 over multiple economic cycles.
In effect, they’re a hybrid of private equity and private debt. This strategy entails paying a comparatively lower base dividend derived from the stable loan portfolio coupled with supplemental (i.e., irregular) dividends as other forms of income are harvested over time.
As a BDC’s strategy matures of many years, it’s possible to generate more consistent capital gains annually. BDCs are effectively forced to pay out all gains as income because of BDC tax rules. Too much undistributed income causes excess and avoidable taxes to be paid by the BDC, and that doesn’t tend to please shareholders.
Now we transition back to the traditional BDC’s portfolio with 95%-100% senior secured loans. These portfolios generate more predictable income, and it makes sense for the Board of Directors to set the dividend policy just under the anticipated distributable income.
Depending on many factors, such as the credit worthiness of the borrowers and terms applied by the lender (granting more control to the BDC may allow the borrower to negotiate lower interest rates, for example), any given BDC portfolio could yield less than another. Leverage is also a major factor since there is a massive 500-900 yield spread between most BDCs’ borrowing costs and the income they receive on their investments.
What’s the right way to think about supplemental dividends?
When comparing two BDCs, the total amount of cash flow generated over time adjusted for the risk involved is the key. Risk means different things to different people, but a good starting point is looking at leverage, the weighted average yield on investments, track record of non-accruals/realized losses, the portfolio’s position in the capital stack of borrowers, and the BDC’s credit rating. We measure and consider all these variables and more every time we underwrite a BDC.
We want to avoid misleading ourselves because a BDC pays or doesn’t pay supplemental distributions. The exact same BDC but with different directors is likely to result in different base and supplemental distribution policies and payments.
The goal is to own BDCs that generate the most favorable total return (Net Asset Value (“NAV”) appreciation/depreciation + dividends) for the risk taken. Personally, I like to own a diversified group of BDCs that focus almost entirely on current income (e.g. ORCC and GBDC) as well as those with a meaningful allocation to equity (e.g. MAIN and ARCC).
These same concepts apply to companies that change their dividend policy over time. MAIN, for example, is believed to be transitioning away from high supplemental dividends and incorporating more of that income in the base dividend.
Once again, I suggest forgetting what a dividend is classified as and focus on:
1) the total income generated by the portfolio against
2) the risk taken by the BDC to achieve that level of income.
Time for our next topic.
5. BDC Distributions Are Unreliable
Just like all our previous items, they aren’t entirely misconceptions. Depending on one’s macro perspective, timeframe, and definition of “reliable,” any sector’s distributions could be perceived as unreliable. Even the Dividend Aristocrats aren’t perfectly reliable as the group does lose members during crises. That’s why we must evaluate track records with our eyes wide open.
Let’s start with a few facts from both sides of the coin. On the plus side, MAIN has never lowered its base dividend since its inception years before the Great Recession. One of the few other mainstream BDCs that were around prior to the Great Recession was ARCC.
That company IPOd in 2004 and paid a $0.30 quarterly distribution that quickly climbed to $0.38 (>25% increase) by mid 2006. It quickly reached $0.42 shortly thereafter and held until mid 2009. Ares cut the dividend by approximately 17% to $0.35, which is where it stayed until it increased again in Q4 of 2011 to $0.36.
As someone who was employed as a portfolio manager/trader at a hedge fund throughout the Great Recession, I remember how difficult that period was and particularly for leveraged financial services companies. Ares’ dividend performance during that period exceeds my expectations.
It was reduced, but not by much, and it was still higher than the payout of just a year prior. Looking through a different lens, if ARCC simply maintained their IPO dividend instead of implementing those large and rapid increases, the stock would have never lowered its base dividend and could make the same impressive attestation as MAIN. Investors often get caught up in the details and lose sight of what matters.
Not every BDC that was around before the Great Recession has done as MAIN and ARCC, however. Prospect Capital Corp (PSEC) IPOd in 2004, and like ARCC, the dividend increased rapidly from $0.10 in Q4 of 2004 to $0.15 by June of 2005 – that’s a 50% increase in one year. By Q4 of 2005, the dividend was at $0.28 and nearly triple the IPO’s. Q4 of 2006? $0.39 quarterly. The dividend of the pre-Great Recession era peaked at $0.40 at the end of 2008. Prospect then increased the dividend to $0.41 in March of 2009. Not long after, Prospect switched to a $0.10 monthly dividend that eventually increased to $0.11.
This begs two immediate questions: Given this excellent performance during the last true financial crisis, why is PSEC used as a problem child? Second, why don’t I cover it today?
Here’s a clue: PSEC would yield 16.1% on today’s share price of $8.50 if that old $0.11 monthly dividend was still in place. Instead, the base yield is closer to 8.5% and that’s despite the hefty 20%-plus discount to NAV. The yield disparity would be even larger without the significant discount.
The point of this detailed illustration is to remind us assumptions not based on facts rarely lead us to correct conclusions. That requires tried and true individual company due diligence. As MAIN and ARCC demonstrated in 2008/2009 and all Tier 1 BDCs did in 2020, quality BDCs do have reliable distributions using anyone’s measuring stick.
Lower quality firms with portfolio problems, excessive management fees, and poorly designed incentive fees that create conflicts of interest between management and shareholders, however, do not have reliable distributions because they are tied to unreliable cash flow streams. PSEC’s degradation over time has more to do with its management team than the tax classification of the company.
Of the 11 BDCs we categorized as Tier 1 (the best) prior to the pandemic-panic of early 2020 (no hindsight bias applies), 10 maintained or increased their base dividend in 2020 and two sort of did. If an investor participated in Golub Capital BDC’s rights offering to shore up its liquidity just after the S&P 500 hit lows, then 11 out of 11 Tier 1 BDCs at least maintained their distributions throughout all stages of the coronavirus period.
Keep in mind those were publicly rated that way before the crisis. Most BDCs did reasonably well during the Great Recession from a dividend perspective (their share prices were hammered), but it’s the many years of boring times that separated the wheat from the chaff.
Here are a couple powerful reminders for context:
The other major exception to note is the financial crisis of 2008-2009. This resulted in S&P 500 dividends being cut 23% (about one in three S&P 500 dividend-paying companies reduced their payouts).
Now let’s consider 2020.
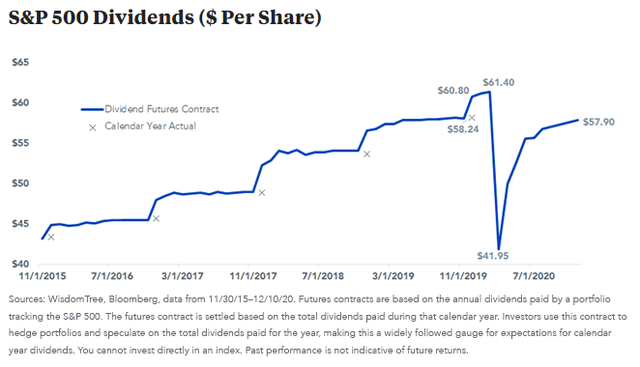
Business Insider
I couldn’t find a comparable stat for the pandemic-panic of 2020, but dividends per share for the S&P 500 index fell from $61.40 to $41.95. Clearly a large portion of the S&P 500 cut their distribution in 2020. Relative to other companies in financial services during the Great Recession, the available data suggests average or better than average dividend durability for BDCs.
BDCs easily outperformed both financial services and the S&P 500 in terms of dividend durability in 2020. That isn’t a surprise for those who follow the sector closely because the sector is much better positioned now than it was during the Great Recession.
At the same time, several lower quality BDCs (e.g. Medley Capital) reduced their distributions and or destroyed shareholder value to the point they were shut down or taken over by new management teams. Medley’s rebranded PhenixFIN (PFX) share price, for example, is down over 83% since inception. This is yet another reason why we completely avoid all BDCs we label as Tier 3 and selectively invest in Tier 2 only when the risk-to-reward ratio is too favorable to pass up.
Are BDC distributions reliable? Now that you are equipped with both sides of the story, it’s time for you to be the judge.
6. BDC Portfolio Companies Have Low Credit Quality
Would you rather own unsecured bonds attached to a BBB- rated (lowest notch of investment grade) company in structural decline or a first lien loan on a growing but un unrated company that cannot borrow money above you in the capital structure and has a net asset/liquidation value double your loan amount?
After you answer, now consider that the first lien loan pays double the interest rate of the high yield bond. Did that change your mind? Lastly, add that the high yield bond is fixed rate and can be redeemed at any time by the issuer while the first lien loan is floating rate and the borrower has to pay you 2.0% of the loan origination amount if they decide to repay early.
These questions are more relevant than trying to answer vague questions like whether two companies have the same “credit quality.” What most people seem to mean when they use terms like that is actually credit rating. There’s no doubt that a rated company has a higher credit rating than an unrated one, but there is doubt that means anything. The credit quality of a borrower cannot be separated from the provisions of the loan.
The average corporate bondholder has similar rights to an online bank like SoFi (SOFI) offering unsecured personal loans to individuals. Not many rights at all. The bondholder and SoFi are both betting that the company’s/individual’s reputation is sufficient to incentivize them to pay the loan back with interest. It works about 98% of the time for SoFi, by the way.
BDCs are not interested in those type of loans. Instead, they’d do the equivalent of a 50% loan-to-value home or automotive loan with restrictions on the borrower. They’d also send out inspectors and obtain several independent market reports to ensure their assumptions are durable and likely to hold up over the loan period in a variety of economic environments.
They’d likely heavily restrict the borrower from doing anything that weakens their financial priority like taking out new debt or quitting their job. While not a perfect comparison, this describes the difference in philosophy well.
It’s reasonable to assume that BDC portfolio companies have similar credit quality to other companies in the same industry of roughly the same size. Since most loans are made to companies of $10 million in EBITDA on the low end and $75 million on the higher end, these are not gigantic firms. One of the larger custom pool builders in the U.S. which is headquartered a few hours from where I live, is a portfolio company of MAIN, for example.
Houston-based Main Street and its co-investors partnered with Cody Pool’s senior management team on the transaction. Main Street’s funding included a combination of first-lien, senior secured term debt and a direct equity investment. The deal also includes a line of credit to support the company’s future growth and working capital needs.
Does a custom pool company established in 1994 with operations in several states probably have a strong balance sheet? It could, but we don’t know as the financials are not public. What we do know, however, is MAIN’s track record and strategy over time.
It’s very unlikely that MAIN engaged in a manner that makes it unlikely to get paid back. The focus doesn’t need to be how credit worthy the borrower is, it’s the manager’s ability to recover its principal and collect interest expense that matters long-term.
In the case of ARCC and ORCC, for example, their annual realized loss ratios are ~0.0% and 0.15%, respectively, through Q4 of 2021 (we aren’t cherry picking, it’s that most BDCs do not report this number on an ongoing basis). Those figures aren’t just better than banks’ comparable 0.60%, they are in another league. High yield bonds, which carry a credit rating, have over 10 times the annual loss rate as our Tier 1 BDC average based on 2018-2021 financials.
In summary, it’s not always possible to determine a BDC portfolio company’s credit situation because there isn’t a lot of public information available. It’s reasonable to assume some have excellent credit profiles and others would earn a low non-investment grade credit rating if one of the rating agencies looked under the hood.
We don’t want to let that completely control our opinion of a portfolio company’s ability to meet their obligations, however, as BDCs utilize covenant heavy loans backed by hard assets or contractual cash flows rather than just a promise to repay like corporate bonds. That’s evident in the much superior realized loss ratios of quality BDCs vs. junk bonds and even many classifications of investment grade bonds (e.g. BBB+ and below).
Conclusion
We hope that you found this exercise educational and that it made you a slightly wiser BDC investor. In a time of elevated inflation and depressed bond yields, BDCs have the potential to serve a valuable and difficult to fill role in a portfolio. We’re here to help you solve the BDC puzzle as we recognize that ongoing, firm specific research is critical for success in this sector.
Author’s Note: Brad Thomas is a Wall Street writer, which means he’s not always right with his predictions or recommendations. Since that also applies to his grammar, please excuse any typos you may find. Also, this article is free: written and distributed only to assist in research while providing a forum for second-level thinking.
Be the first to comment