gesrey/iStock via Getty Images
By Barbara Velado
There is a 50% chance that global warming will exceed 1.5°C before 2026.1 Science is telling us that time is running out—climate change is no longer a problem for the future, and its associated physical risks are materializing more evidently.2 It’s time for action: the world needs to rapidly decarbonize to prevent irreversible impacts. The S&P PACT™ Indices (S&P Paris-Aligned and Climate Transition Indices) are designed to select equity securities that collectively aim to meet the goals of the Paris Agreement. Here we dive into the power of data in driving the weights within the S&P 500® Net Zero 2050 Paris-Aligned ESG Index and let the underlying data speak for itself.
S&P Paris-Aligned Index Weights Explained
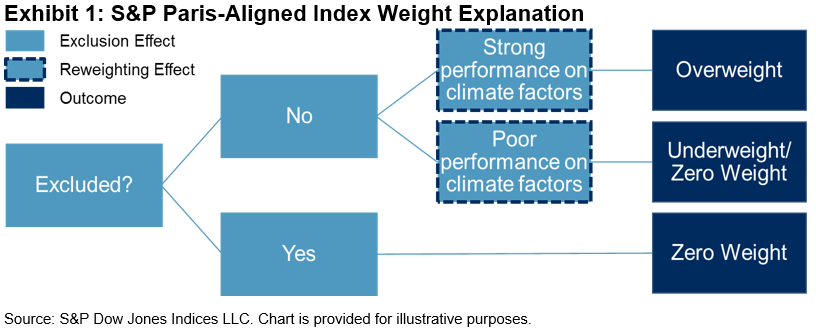
The S&P Paris-Aligned Indices start by excluding companies involved in undesirable business activities, and then the remaining constituents are reweighted based on their ESG and climate performance.3 This blog will focus on specific companies’ case studies to better illustrate this reweighting effect.
Exhibit 1 (S&P Dow Jones Indices LLC)
Climate and ESG Data Driving the Weights
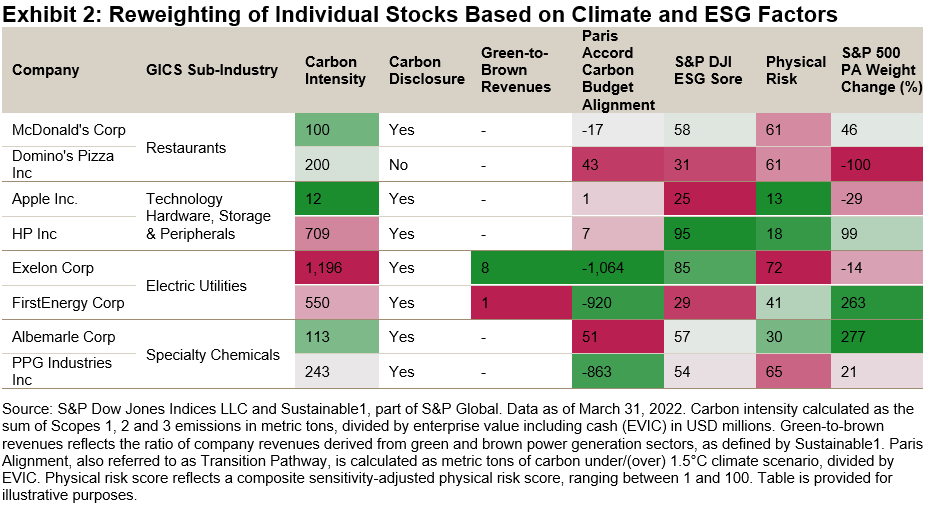
Exhibit 2 highlights how the underlying climate and ESG metrics drive the weights allocated to some of the stocks within the S&P 500 Net Zero 2050 Paris-Aligned ESG Index. To provide transparency on a relative basis, we look at four pairs of companies within the same sub-industry and their percentage weight change relative to its underlying index, the S&P 500. Green colors depict relatively positive performance on a climate or ESG factor, while pink shades reflect weaker values.
McDonald’s (MCD) and Domino’s (DPZ), two of the largest names within the American restaurant industry, received different weights. Despite both having high exposure to physical risks, McDonald’s alignment with a 1.5°C carbon budget and stronger S&P DJI ESG Score helped the company to be overweighted by 46% compared with its underlying index. Conversely, Domino’s was allocated 0% weight due to being above its transition pathway budget, which is the climate factor responsible for the largest reweighting effect.4 Since only 32%5 of stocks within the underlying index are below their respective 1.5°C carbon budgets, significant reweightings are applied at the stock level for the overall index to be 1.5°C compatible.
Apple (AAPL) and HP (HPQ) show similar alignment to a 1.5°C trajectory on a forward-looking basis and comparable physical risk scores. HP’s stronger sustainability performance, as measured by its S&P DJI ESG Score, led to its overweight (99%), while Apple lost some of its ground (-29%). As the S&P 500 Net Zero 2050 Paris-Aligned ESG Index targets a 20% increase of index-level ESG score relative to the underlying index, the ESG score plays a large role within the reweighting effect. Incorporating the ESG score into this climate strategy allows for a more holistic ESG performance assessment than looking at climate factors in isolation.
Within Electric Utilities, Exelon (EXC) was underweighted (-14%) due to its high physical risk score, indicating high sensitivity and exposure to physical risks. Along with consideration for transition risks, the S&P 500 Net Zero 2050 Paris-Aligned ESG Index also aims to mitigate physical risks to fully address climate risks at the index level, aligning with the TCFD recommendations.6 FirstEnergy (FE), despite having lower green-to-brown revenue share, received a large overweight (263%) thanks to being below its 1.5°C carbon budget and lower physical risk score.
Lastly, within Specialty Chemicals, both Albemarle (ALB) and PPG Industries (PPG) were overweighted, albeit to different degrees. Despite being below its 1.5°C carbon budget and displaying a similar S&P DJI ESG Score to Albemarle, PPG Industries’ high physical risk score curbed its overweight to 21%, while its peer’s weight was boosted by 277%.
Exhibit 2 (S&P Dow Jones Indices LLC and Sustainable1)
We aim to provide transparency on how the S&P PACT Indices constituents’ weights are determined by their climate and ESG performance. Coupled with the 7% year-on-year self-decarbonization pathway, the S&P PACT Indices seek to offer an efficient and multifaceted solution for investment product providers to align investments with a net-zero journey.
1 According to the World Meteorological Organization (WMO) Climate Update.
2 According to the contribution of IPCC’s Working Group II to the Sixth Assessment Report on Climate Change 2022: Impacts, Adaptation and Vulnerability.
3 Please see the S&P Paris-Aligned and Climate Transition Indices Methodology for more information.
4 Leale-Green, B., Velado, B. (2020). Exploring S&P PACT Indices Weight Attribution.
5 As of March 31, 2022, 32% of constituents by index weight within the S&P 500 were under their carbon budget for 1.5°C climate scenario alignment.
6 Final Report: Recommendations of the Task Force on Climate-Related Financial Disclosures (2017), available here.
Disclosure: Copyright © 2022 S&P Dow Jones Indices LLC, a division of S&P Global. All rights reserved. This material is reproduced with the prior written consent of S&P DJI. For more information on S&P DJI please visit www.spdji.com. For full terms of use and disclosures please visit Terms of Use.
Editor’s Note: The summary bullets for this article were chosen by Seeking Alpha editors.


Be the first to comment