

RomoloTavani/iStock via Getty Images
Danaher (NYSE:DHR) is a giant in the healthcare space, specifically within the life sciences as well as testing and diagnostics. It also has a third segment that focuses on water quality and packaging materials.
Danaher is a very acquisitive business, with 10 acquisitions announced last year for more than $10 B. Occasionally, Danaher spins off segments and business units as well; their empire has grown.
Danaher 2021 revenue breakdown (Danaher SEC filings)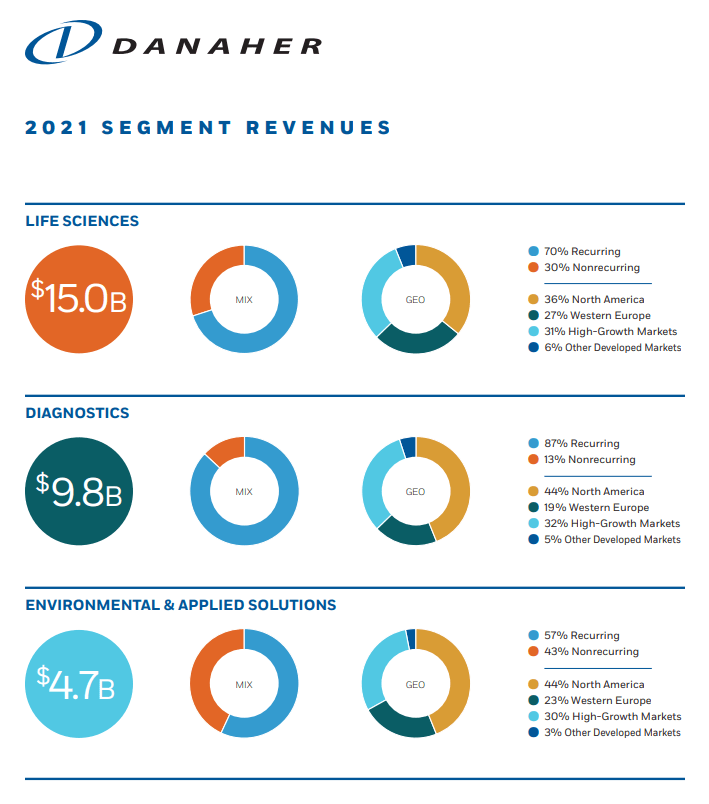
For 2021, Danaher has $29.5 B in revenue, of which they codify roughly 3/4ths as being recurring. Over 80% of Danaher’s revenues for 2021 came from the life sciences and diagnostics segments. Those two segments are focused on the healthcare industry.
The life sciences segment provides highly specialized equipment, think mass spectrometers, centrifuges, microscopes and much more, that aids the pharmaceutical industry in their search for and manufacture of new compounds. Essentially, they are a powerhouse in the healthcare R&D spend budgets. Seventy percent of FY 2021’s revenue was classified as recurring when counting consumables and servicing.
The diagnostics segment serves more of the frontline space for healthcare with pathology diagnostics, hematology, as well as instruments and other consumables for doctors’ offices. This segment provided $9.8 B in revenue for FY 2021 with 87% of it being classified as recurring.
Dividend History
As a dividend growth investor, the target for the bulk of my portfolio is for companies that have a moderate current yield coupled with annual dividend growth somewhere in the 6-12% range annually. However, I’m also investing for potentially the next 40-50+ years, so I try to add some companies that might have small current yields, but the potential to grow their dividend at a very rapid pace for years to come.
Danaher Dividend History (DHR Investor Relations)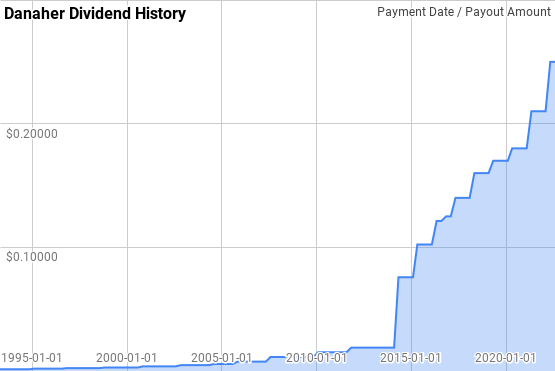
Danaher has amassed a rather impressive dividend growth history, despite taking a brief pause in annual dividend growth in 2013. Their streak currently sits at 8 consecutive years, giving them the title of Dividend Challenger, although they’ve paid the same or higher dividend every year since at least 1993.
Since 1993 year over year dividend growth has ranged from 0.0% to 300.0% with an average of 24.6% and a median of 13.7%.
Over that same time there’s been 25 rolling 5-year periods with annualized dividend growth ranging from 10.8% to 53.2% with an average of 21.2% and a median of 14.9%.
There’s also been 20 rolling 10-year periods with Danaher’s annualized dividend growth rate spanning 12.8% to 32.2% with an average of 21.7% and a median of 16.3%.
The rolling 1-, 3-, 5-, and 10-year annualized dividend growth rates from Danaher since 1993 can be found in the following table.
| Year | Annual Dividend | 1 Year | 3 Year | 5 Year | 10 Year |
| 1993 | $0.006 | ||||
| 1994 | $0.006 | 8.27% | |||
| 1995 | $0.008 | 22.93% | |||
| 1996 | $0.009 | 12.70% | 14.47% | ||
| 1997 | $0.009 | 11.27% | 15.52% | ||
| 1998 | $0.010 | 9.92% | 11.29% | 12.90% | |
| 1999 | $0.011 | 9.02% | 10.06% | 13.06% | |
| 2000 | $0.013 | 16.73% | 11.84% | 11.89% | |
| 2001 | $0.015 | 14.33% | 13.31% | 12.22% | |
| 2002 | $0.017 | 12.53% | 14.52% | 12.47% | |
| 2003 | $0.019 | 11.14% | 12.66% | 12.72% | 12.81% |
| 2004 | $0.022 | 14.87% | 12.84% | 13.90% | 13.48% |
| 2005 | $0.027 | 21.76% | 15.84% | 14.87% | 13.37% |
| 2006 | $0.030 | 14.33% | 16.94% | 14.87% | 13.53% |
| 2007 | $0.042 | 37.50% | 24.16% | 19.57% | 15.96% |
| 2008 | $0.045 | 9.09% | 19.70% | 19.12% | 15.88% |
| 2009 | $0.049 | 8.33% | 17.57% | 17.73% | 15.80% |
| 2010 | $0.061 | 23.08% | 13.30% | 17.99% | 16.42% |
| 2011 | $0.068 | 12.50% | 14.47% | 17.61% | 16.23% |
| 2012 | $0.076 | 11.11% | 15.44% | 12.70% | 16.08% |
| 2013 | $0.076 | 0.00% | 7.72% | 10.76% | 14.86% |
| 2014 | $0.303 | 299.95% | 64.41% | 43.82% | 30.13% |
| 2015 | $0.409 | 35.00% | 75.44% | 46.50% | 31.48% |
| 2016 | $0.493 | 20.34% | 86.61% | 48.49% | 32.15% |
| 2017 | $0.560 | 13.70% | 22.70% | 49.18% | 29.66% |
| 2018 | $0.640 | 14.29% | 16.07% | 53.22% | 30.27% |
| 2019 | $0.680 | 6.25% | 11.35% | 17.54% | 30.01% |
| 2020 | $0.720 | 5.88% | 8.74% | 11.96% | 28.07% |
| 2021 | $0.840 | 16.67% | 9.49% | 11.27% | 28.54% |
| 2022* | $1.000 | 19.05% | 13.72% | 12.30% | 29.43% |
Source: Author; Data Source: Danaher Investor Relations
*Assumes Q3 and Q4 payments from Danaher will be made at $0.25 per share each.
The dividend payout ratio is a quick gauge for the safety and potential future growth of a company’s dividend payment. The payout ratio lets you know how much cushion there is for the inevitable business slowdowns without jeopardizing the dividend. All else being equal, a lower payout ratio is better as it gives management the opportunity to increase the payout even in slow times and potentially raise it faster than growth of the underlying per share profits or cash flow.
DHR Dividend Payout Ratios (DHR SEC filings)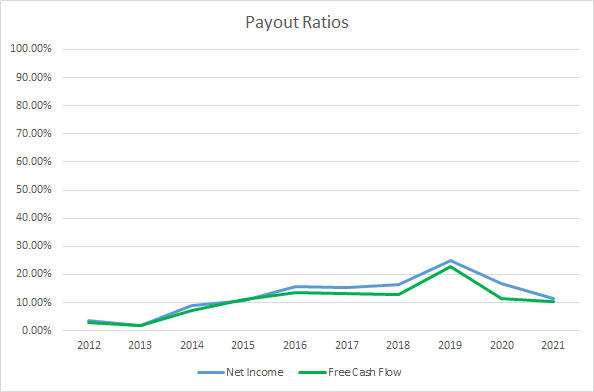
Danaher’s payout ratio, based on both net income and free cash flow, remains microscopic despite the very rapid dividend growth. The 10-year average net income payout ratio is 12.5% with the 5-year average at 17.0%. Similarly, the average free cash flow payout ratios are 10.7% and 14.1%, respectively. Danaher’s dividend is well covered by both earnings and free cash flow and should allow Danaher to continue to grow their dividend at an above average rate.
Quantitative Quality
A company’s dividend growth history is just one data point that I use to try to get an idea of the business. There’s several other financial metrics that I monitor to see how the business has changed over time.
DHR Revenue Profits and Cash Flow (DHR SEC filings)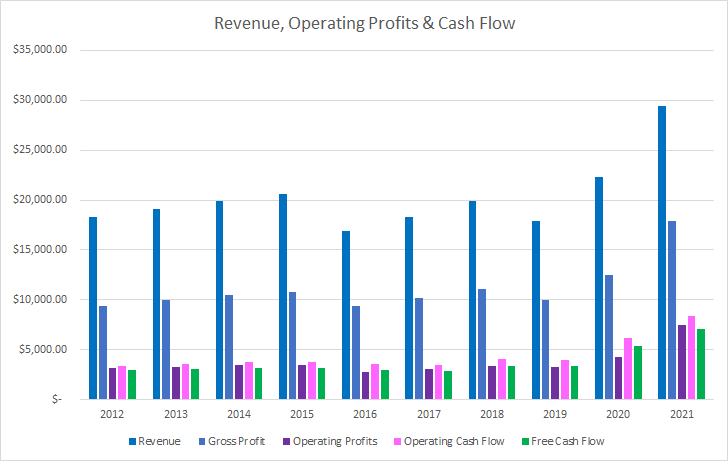
Danaher has done an admirable job growing revenues over the last decade, with total growth of 61.3% or 5.5% annualized. Meanwhile, gross profits grew 90.7% in total or 7.4% annualized.
Similarly, operating income increased 135.9% in total or 10.0% annualized, with operating cash flow increasing 144.7% or 10.5% annualized. Free cash flow lagged slightly behind operating cash flow; however, it still tracked roughly in-line, increasing 138.9% in total or 10.2% annualized.
My expectation is that a good business will be able to show stable or rising margins over time. I’m not worried about a specific year to year fluctuation; however, the trend should definitely be in that direction.
DHR Margins and CCR (DHR SEC filings)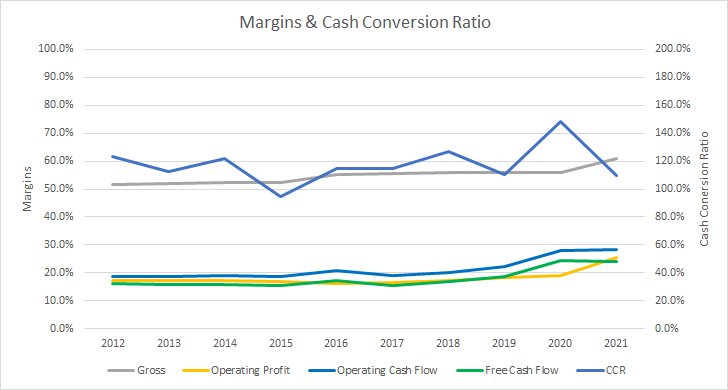
With Danaher’s profits and cash flow well outpacing revenue growth, it should come as no surprise that margins have been improving. Danaher’s gross margin has averaged 54.8% for the last decade and 56.8% for the most recent 5-years. Likewise, Danaher’s free cash flow margins have a 10-year average of 18.0% and a 5-year average of 19.9%.
I also want to see how efficient Danaher is at generating free cash flow with its asset and capital base by examining the free cash flow return on invested capital, FCR ROIC. I want to see FCF ROIC’s sustained above 10%.
DHR Free Cash Flow Returns (DHR SEC filings)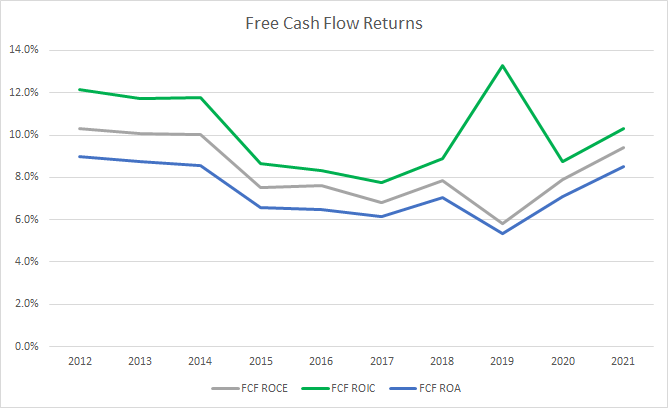
Danaher’s FCF ROIC has hovered around 10%; however, it hasn’t maintained levels greater than that. The 10-year average FCF ROIC for Danaher is 10.2% with the 5-year average at 9.8%.
To understand how Danaher uses its free cash flow, I calculate three variations of the metric, defined below:
- Free Cash Flow, FCF: Operating cash flow less capital expenditures
- Free Cash Flow after Dividend, FCFaD: FCF less total cash dividend payments
- Free Cash Flow after Dividend and Buybacks, FCFaDB: FCFaD less net cash used on share repurchases
DHR Free Cash Flows (DHR SEC filings)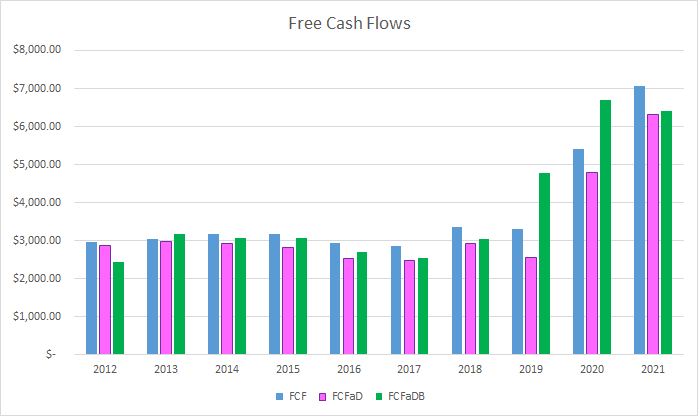
Over the last ten years, Danaher has generated $37.3 B in FCF while paying out just $4.0 B total in dividends. That puts the cumulative FCFaD at a very hefty $33.2 B. Historically, Danaher has not been a serial share repurchaser with net proceeds from share issuance of $4.6 B. The 10-year total FCFaDB comes to $37.9 B.
Companies that generate plenty of free cash flow can use share repurchases as a means to return excess cash to shareholders if there’s no other productive and higher return reinvestment candidates.
DHR Shares Outstanding (DHR SEC filings)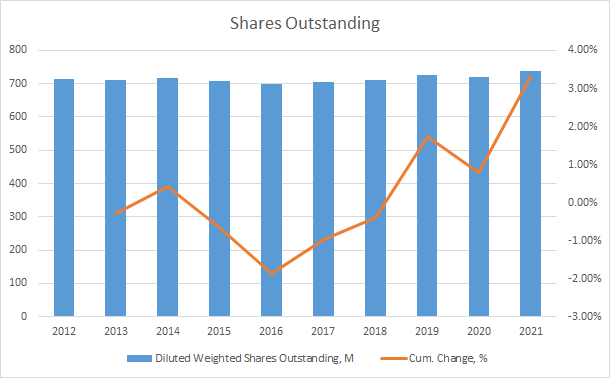
Danaher’s share count is up slightly over the last decade rising 3.3% in total or 0.4% annually. Historically, share repurchases have not been Danaher’s modus operandi as they’ve continued to find the best opportunities for their cash flow, namely through acquisitions. At some point I believe buybacks will become meaningful at Danaher; however, as long as the M&A pipeline remains open, I expect that to take priority.
When I invest in a business, my goal is to own shares for periods measured in years and potentially decades. As such, I want to make sure that management has used a prudent and conservative amount of debt if they choose to do so, rather than using excessive leverage.
DHR Debt to Capitalization (DHR SEC filings)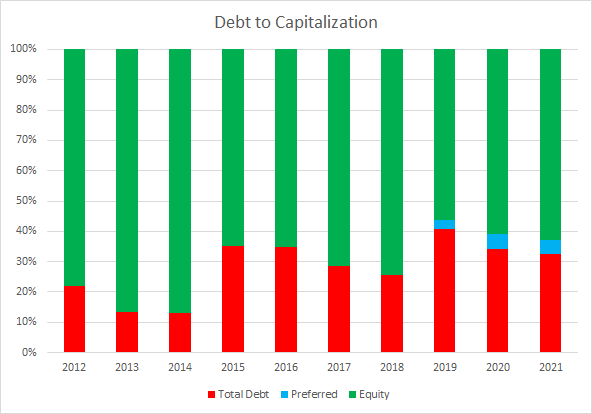
Danaher’s debt-to-capitalization ratio has varied some over the last decade; however, it’s still a conservative capital structure. The 10-year average debt-to-capitalization ratio is 28% with the 5-year average coming to 32%.
The net debt ratios play a bigger role in determining how much leverage the business carries. The net debt ratios examine the total debt less cash and equivalents compared to some measure of profits or cash flow. The net debt ratios let you know how quickly the business could de-lever if needed.
DHR Debt Ratios (DHR SEC filings)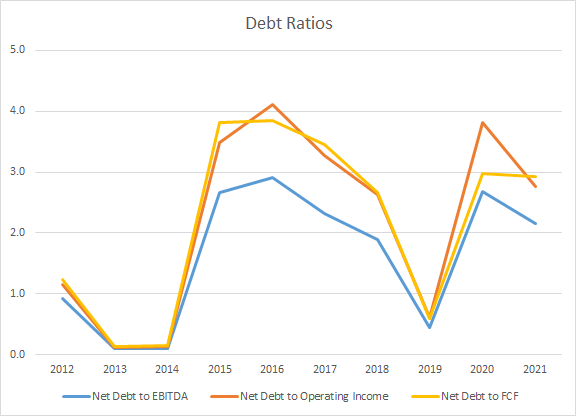
Danaher’s net debt ratios are in good shape, although I would like to see them come down. The 10-year average net debt-to-EBITDA, net debt-to-operating income, and net debt-to-FCF ratios are 1.6x, 2.2x, and 2.2x, respectively. Likewise, the 5-year averages are 1.9x 2.6x, and 2.5x.
Valuation
When valuing a potential investment, I use several valuation methods that value the business from different perspectives. The methods that I use are the minimum acceptable rate of return, “MARR”, analysis, dividend yield theory, and a reverse discounted cash flow analysis.
Analysts expect Danaher to have earnings of $10.33 for FY 2022 and $10.93 for FY 2023. They also expect Danaher to be able to grow earnings at an 11.0% annual rate over the next 5 years. I then assumed that earnings growth would slow to 5.0% annually for the following 5 years. Dividends are assumed to target a 15% payout ratio.
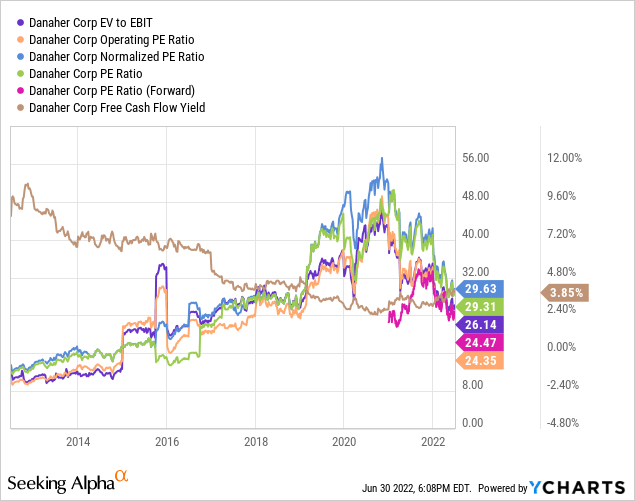
Over the last decade investors, collectively, have valued Danaher between roughly 10x and 30x TTM EPS with the last three years seeing a marked deviation to the upside. For the MARR analysis, I’ll examine exit multiples spanning that range.
The following table shows the potential internal rates of return that an investment in Danaher could generate if the assumptions laid out above prove to be reasonable forecasts of how the future will play out. Returns assume dividends are paid and increased along Danaher’s historic schedule, and that all dividends are taken in cash. Returns assume that shares are purchased at $258.05, Friday’s closing price.
| IRR | ||
| P/E Level | 5 Year | 10 Year |
| 30 | 14.9% | 9.9% |
| 25 | 10.4% | 7.9% |
| 20 | 5.1% | 5.4% |
| 15 | -1.2% | 2.4% |
| 10 | -9.5% | -1.6% |
Source: Author
Additionally, I use the MARR analysis framework to work backwards and determine what price I could pay today in order to generate the returns that I desire from my investments given the varying exit multiples. My standard hurdle rate is a 10% IRR, and for Danaher I’ll also examine 8% and 12% return thresholds.
| Purchase Price Targets | ||||||
| 10% Return Target | 12% Return Target | 8% Return Target | ||||
| P/E Level | 5 Year | 10 Year | 5 Year | 10 Year | 5 Year | 10 Year |
| 30 | $321 | $262 | $297 | $222 | $347 | $309 |
| 25 | $268 | $220 | $249 | $187 | $290 | $260 |
| 20 | $216 | $179 | $200 | $152 | $233 | $211 |
| 15 | $164 | $137 | $152 | $117 | $177 | $161 |
| 10 | $111 | $96 | $103 | $82 | $120 | $112 |
Source: Author
Dividend yield theory is a valuation methodology based on reversion to the mean, assuming that given no material changes to the business investors will value the business such that the dividend yield fluctuates around a normalized level. For Danaher, I’ll use the 5-year average forward dividend yield as a proxy for the fair value.
Danaher Dividend Yield Theory (DHR Investor Relations and Google Finance)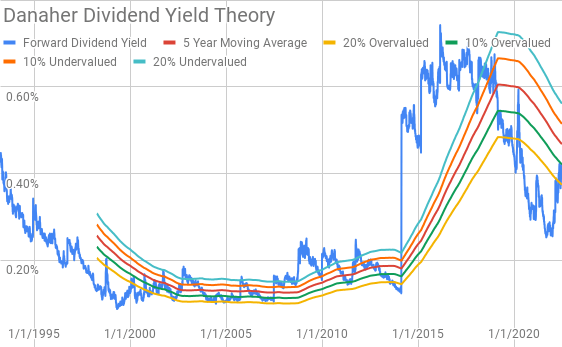
Danaher currently offers a forward dividend yield of 0.39% compared to the 5-year average forward dividend yield of 0.47%.
A reverse discounted cash flow analysis is a way to decipher what the growth and margins of a business must be in order to generate the cash flows necessary to support the current market valuation. In other words, it’s a reality check on what the business must be able to do.
I use a simplified DCF model built on revenue growth, an initial free cash flow margin of 23.0% that improves to 27.0% during the forecast period, and a 3.5% terminal growth rate. Under those assumptions, Danaher needs to grow revenues 11.3% annually between FY 2022 and FY 2031 in order to generate the necessary cash flows to support a 10% return. Reducing the return requirement to 8% lowers the required revenue growth to 5.4%.
Conclusion
Danaher is a great business that has consistently been able to grow through both M&A as well as organic growth. Danaher has expanded margins tremendously over the last decade as evidence by the 5.5% annual revenue growth, but 10.2% annualized free cash flow growth. Danaher has maintained free cash flow margins greater than 15% each year over the last decade; although their FCF ROIC is hovering around the 10% level.
Dividend yield theory suggests a fair value for Danaher between $196 and $238. The MARR analysis seems to suggest that shares are overvalued at this time assuming a 10% IRR target with an exit multiple between ~17.5x and ~22.5x 5 years out with a fair value range between $190 and $242. Lowering the return target to 8% increases the fair value range to $205 to $262.
The reverse DCF model shows that Danaher isn’t likely to generate the free cash flows necessary to support 10% returns unless you expect Danaher to grow revenues meaningfully faster than they expect or have significantly higher margins. However, 8% returns seem very achievable.
Danaher has not typically utilized share repurchases as they’ve had better internal as well as external re-investment opportunities. As a rough estimate at the current market valuation Danaher could retire ~2.5% of outstanding shares using the 3-year average FCFaD as the approximate repurchase availability. Management plans to use all of their FCF on further M&A activity, which as long as they continue to execute is just fine by me.
Danaher is a dominant player in several durable secular growth markets, specifically life sciences, healthcare diagnostic and testing equipment, and water quality. Danaher has also transformed its revenue base such that nearly 3/4 of FY 2021 revenues were recurring, with just over 1/4 being non-recurring. That large proportion of recurring revenue allows management to be much more aggressive on the M&A front.
Danaher is definitely not suited for any dividend growth investors that are looking for meaningful dividends in the next 5 years. However, the opportunity is there for Danaher to maintain above average dividend growth for a long time to come. Based on FY 2021’s FCF and dividend payment, Danaher could grow the dividend 10% annually for 17 years with no growth in the business before reaching a 50% payout ratio.
Eventually I expect share repurchases to be a tailwind for shareholders; however, I don’t expect that to come anytime soon as long as they are able to continue to pursue M&A opportunities.
Danaher Investor Day 2021 Forecast (Danaher Investor Day 2021 Presentation)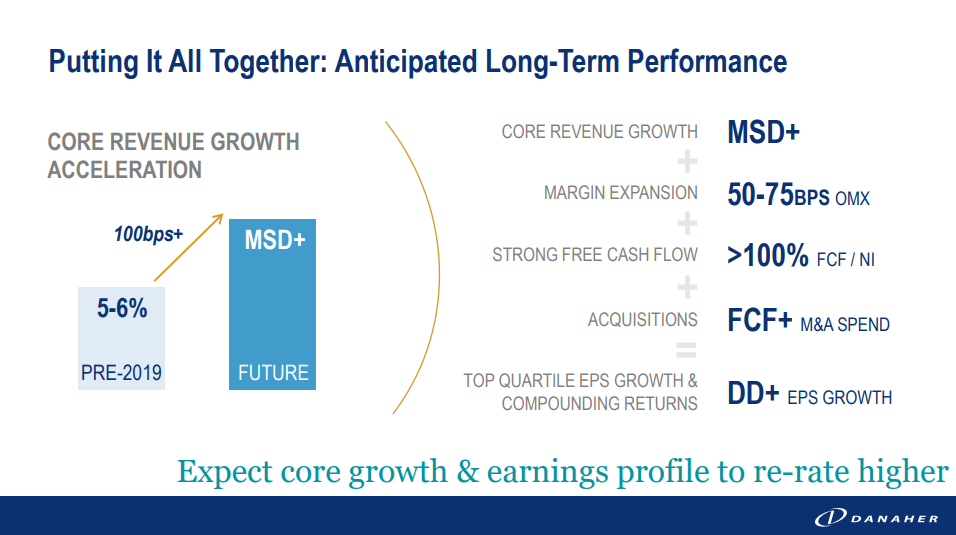
If the core business of Danaher is able to hit managements’ expectations of mid-single digit revenue growth that translates into double-digit earnings per share growth then Danaher is likely in the realm of fair value. However, there appears to be little to no margin of safety.
While I like Danaher, the business, the stock isn’t quite at a level that I’d feel comfortable purchasing shares at. I would prefer to add shares in the mid $230’s or lower; although, a dollar cost average approach might be the better route with Danaher.
Be the first to comment