

Lemon_tm
Written by Nick Ackerman, co-produced by Stanford Chemist. This article was originally published to members of the CEF/ETF Income Laboratory on August 7th, 2022.
Calamos Strategic Total Return Fund (NASDAQ:CSQ) is a hybrid closed-end fund (“CEF”) that allocates most of its portfolio to equities. However, convertibles and corporate bonds are also meaningfully represented in the fund. We have mostly high yield but some investment grade exposure for corporate bonds.
To a lesser degree, they have exposure to U.S. government securities, bank loans, preferreds, options and just about any other investment you can think of. So they truly have a hybrid approach of flexibility to be able to invest in just about anything.
This approach provides one fund for quite a bit of diversification. Over the longer run, it has resulted in respectable results for investors. On a YTD basis, the fund has been struggling a bit. Of course, we are seeing this across the broader market in equities and fixed-income sectors.
There really hasn’t been any place to shelter from the volatility. Energy and utilities are the leading sectors, and energy has a firm lead. One of the primary factors specific to CSQ, besides the positioning of the fund, is the fund is leveraged.
Since my last update on the fund, it has been holding up better than the S&P 500. It is not an appropriate benchmark on its own, but it can provide some context. The total return would be factoring in the fund’s distribution. Although, the performance has been slightly negative for the period regardless.
CSQ Performance (Seeking Alpha)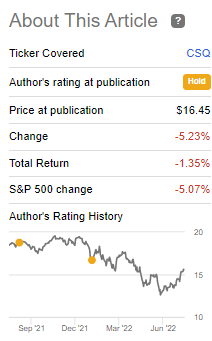
Today, CSQ is sitting in an interesting position. I wouldn’t say it is exactly a buy because the fund has resumed trading at a premium. It was only a short couple of months ago that I was adding to my position as it slipped into a slight discount. The fund, for the last few years of trading, has regularly exhibited premium pricing. That being said, the overall declines could still make CSQ a solid choice for an initial buy. Utilizing a dollar-cost average method could provide better buying opportunities in the future.
The Basics
- 1-Year Z-score: 1.50
- Discount: 3.51%
- Distribution Yield: 7.87%
- Expense Ratio: 1.48%
- Leverage: 32.20%
- Managed Assets: $3.5 billion
- Structure: Perpetual
CSQ’s objective is to seek “total return through a combination of capital appreciation and current income.” They attempt to achieve this simply by; “investing in a diversified portfolio of equities, convertible securities and high yield corporate bonds.”
The fund has the ability to invest where they see the best opportunities might be. That is part of the appeal of active management, the flexibility to adapt to different situations. Though it should be noted that the fund will have “at least 50% in equity securities.”
This means that the fund will always hold a heavier allocation to common stocks. That puts it in a more aggressive position than its sister funds that tend to favor more fixed-income oriented positions, focusing on more convertibles in particular. However, the overweight allocation to equities has undoubtedly benefited the fund to this point.
Leverage Changes
The fund’s leverage had increased, pushing over 32% when it was closer to 28%. This was partially due to asset values coming down, but they were also making some other moves with their leverage. They added a new Series F preferred. However, they also took down their borrowings from $880 million at the end of April 2022 to $720 million as of the end of July 2022.
Since the last update, the fund has filed that they will be redeeming their Series A preferred. These were mandatorily redeemable preferred with a fixed date for redemption of September 6th, 2022. That being said, the Series F launched on March 8th, 2022. It essentially pre-offset the Series A redemption that was going to be taking place.
CSQ Preferred Leverage (Calamos)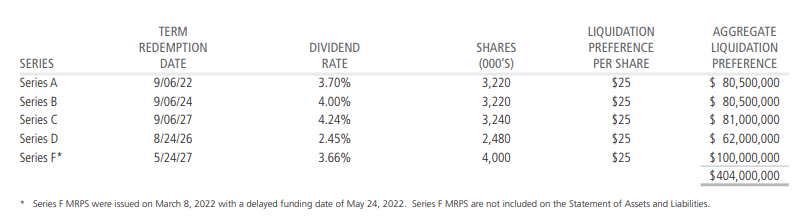
We can see that it was a larger offering, and the interest rate was just ever so slightly reduced. In the end, the actual dividend expense of the new offering will be higher due to a higher outstanding balance. Offset only ever so partially by the reduced interest rate.
The preferred leverage can be great in a rising interest rate environment, relatively speaking. That’s because these are fixed dividends that they are paying the preferred. The fund also utilizes some borrowings, but that is based on the Overnight Bank Financing Rate plus 0.80%. That means as rates head higher, the expenses on those borrowings also head higher.
CSQ Performance – Looking Like A “Hold”
Below is a YTD comparison between CSQ, SPDR S&P 500 ETF (SPY), iShares Convertible Bond (ICVT) and iShares iBoxx $ High Yield Corporate Bond (HYG). These aren’t direct benchmarks, but help provide a bit of context of the underlying performance relative to CSQ. Taking a mixture of these funds at different weightings could provide a good idea of how CSQ should be performing.
Ycharts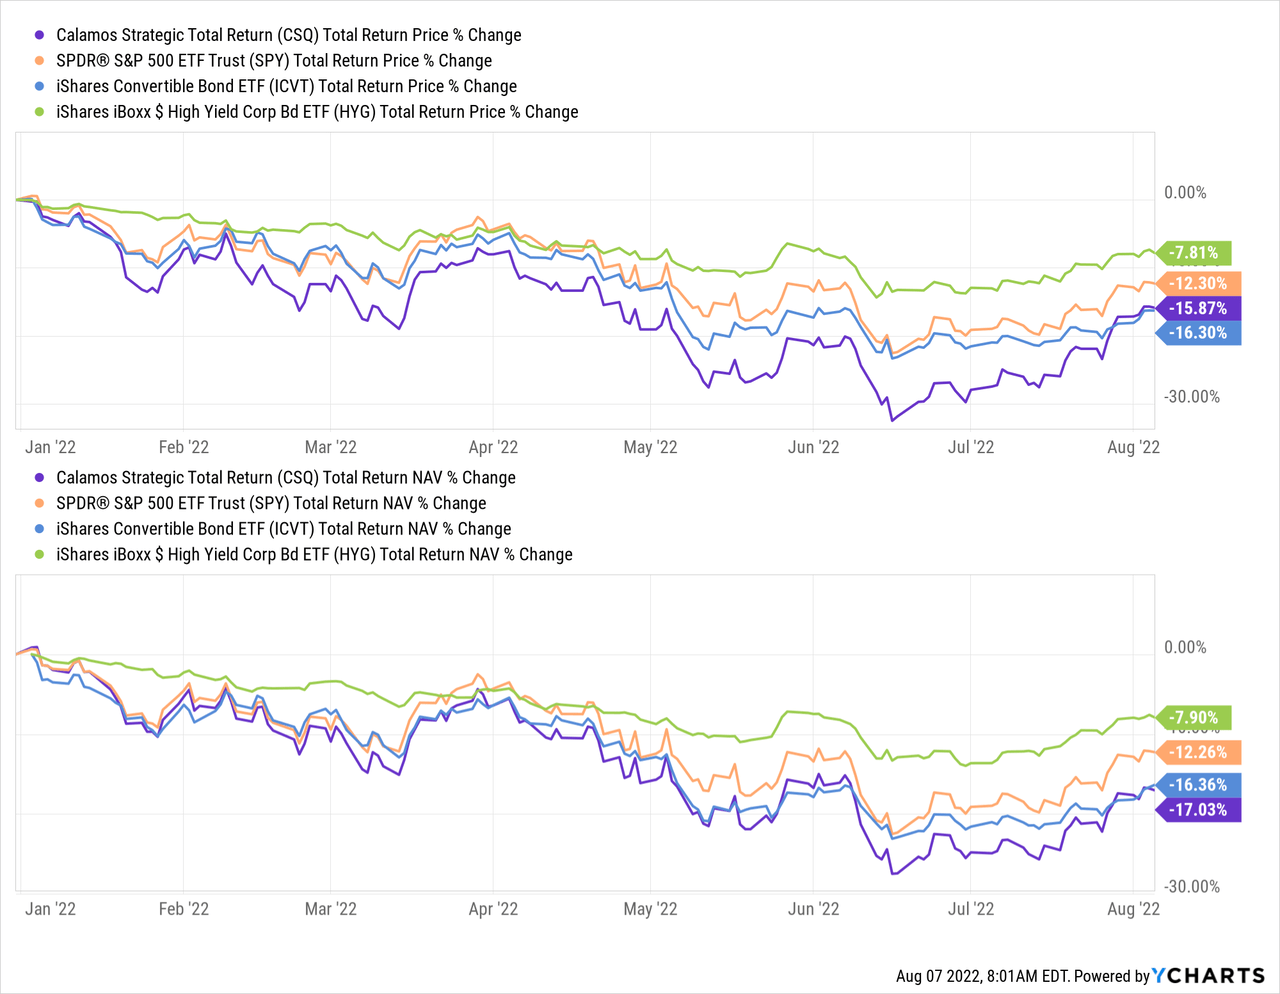
In this case, we can see that CSQ was the weakest performing amongst these comparisons on a total NAV and share price return. However, this is one case where the share price has now outperformed its NAV price. That would result in the fund’s premium inching higher. Over the last several years, this fund has regularly flirted with a premium.
An additional note is that it seemed to follow more in line with ICVT. That’s quite interesting because the fund has only around 19% convertibles and just over 60% equity positions. The fund carries most of the mega-cap tech names we are familiar with seeing. However, there are a couple of names that we don’t always see.
They provide their own benchmarks, which look like an appropriate breakdown.
CSQ Benchmark Comparison (Calamos)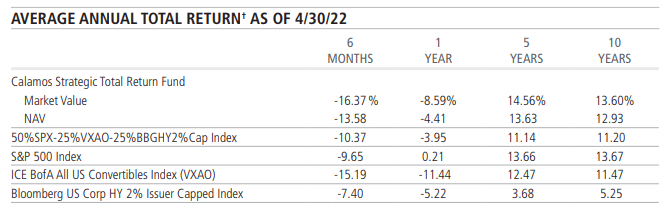
Over the longer term, the fund had traded at a fair discount. It was around 2018 that the valuation started to narrow, and the premium stayed rather sticky. We can see that it just briefly touched its decade-long average discount because rocketing back higher. The higher valuation is also acutely represented by the fund’s 1-year z-score of 1.50 – suggesting the fund is overvalued both against its long-term and short-term levels.
Ycharts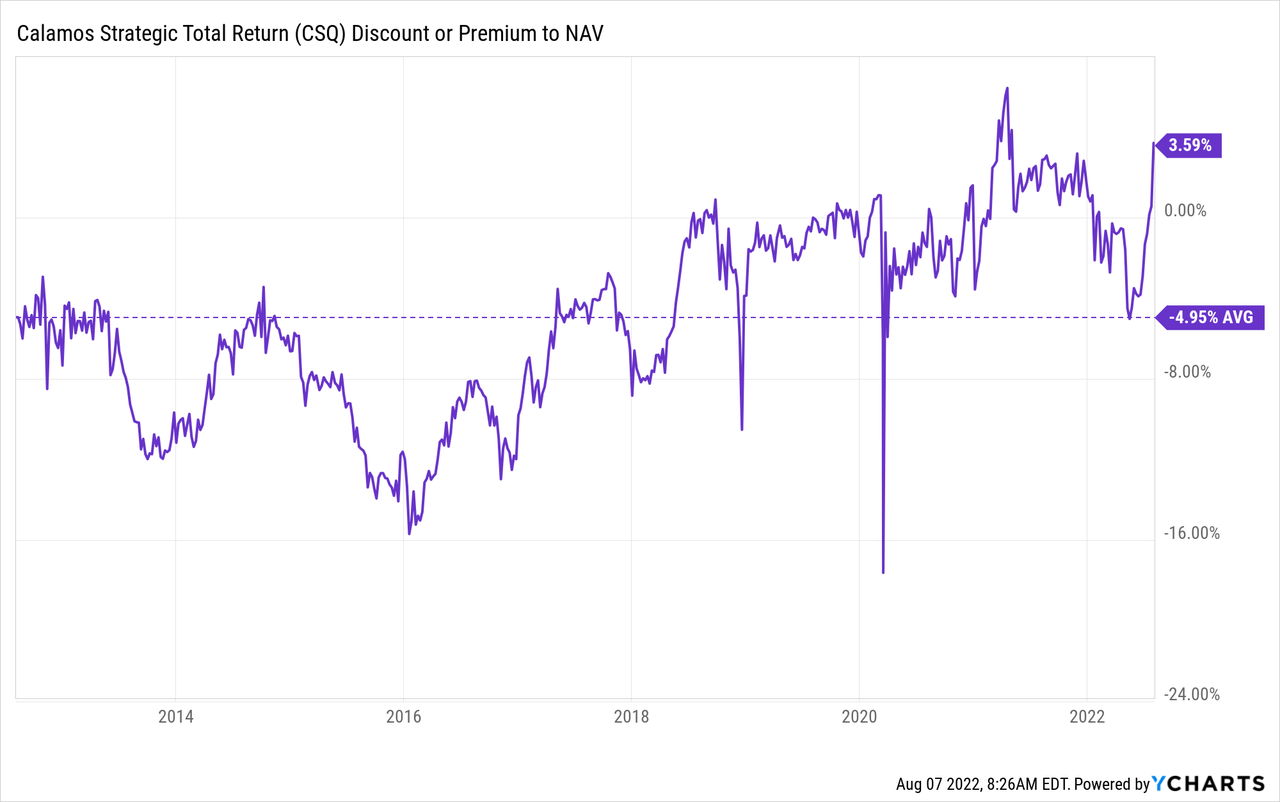
Distribution – Attractive 7.87% Yield
The fund had cut its distribution several times after 2008. However, the fund has since ramped the payout back up. At this time, it is equal to the high watermark that it had reached in pre-2008. That’s an achievement that not every closed-end fund has been able to pull off.
CSQ Distribution History (Calamos)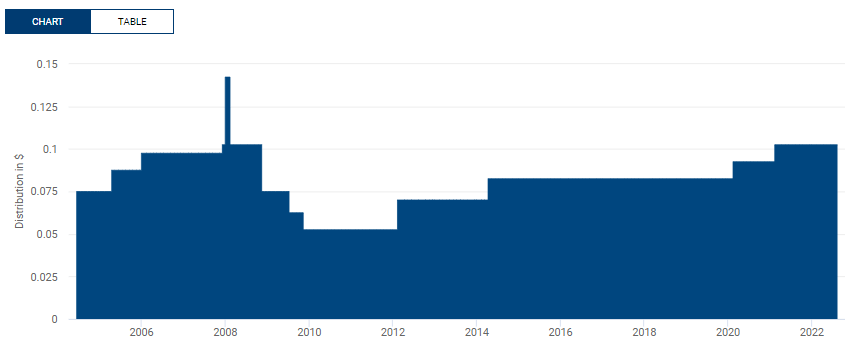
Additionally, the fund reported that total cumulative distributions since the fund launched at $17.867. The fund’s inception NAV was $14.31, meaning they have returned the initial investment and then some. At this point, the last closing NAV was $15.09 per share.
To fund the distribution, they will rely on capital gains over the longer run. That is the same with any equity fund. Even convertible funds are relying on capital gains significantly lately. Over the last decade, yields have been low. In 2020, companies were getting away with issuing 0% on their convertibles.
CSQ Semi-Annual Report (Calamos)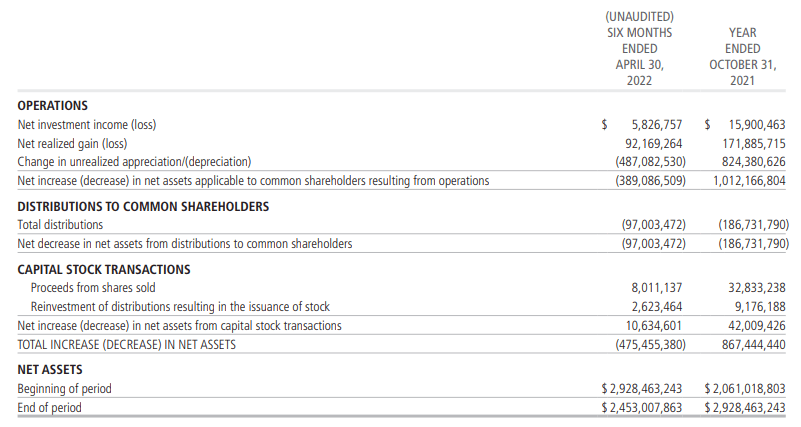
What we see above is that for the six months ended April 30th, 2022, the fund received around $5.827 million in net investment income. That figure is the total investment income minus expenses. That’s against the ~$97 million they had paid out to shareholders. That works out to NII coverage of just 6%. The remainder has been covered through realized gains at this point. However, with a weak market, it could become more difficult to find those gains.
For now, at a 7.87% distribution yield and an 8.15% NAV distribution yield, I don’t suspect they will cut. It will be something to continue to watch for, though.
For tax purposes, we see that ordinary income is a fairly sizeable classification. That doesn’t align with the net investment income received by the fund. CSQ is one of those funds that is a good reminder that underlying earnings don’t always translate to tax classifications.
CSQ Annual Report (Calamos)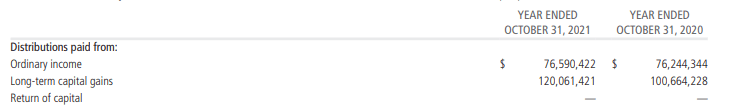
CSQ’s Portfolio
When looking at the fund’s portfolio, it’s always good to consider how much turnover the fund has. Turnover is how much buying and selling they are doing in the fund. If it is a high number, that means they are regularly buying and selling positions. A lower number means that the portfolio can remain rather static over time.
In this case, they reported a turnover rate of 13% in the previous six months. That’s rather low and lines up with what they’ve been doing over the last several years, with 27%, 36% and 26% turnover rates in the years 2021, 2020 and 2019.
That lends itself to a fairly static portfolio. Additionally, since they have a target of 50% being held in equity positions, we will always see an overweight exposure to that asset class relative to the others.
CSQ Asset Class (Calamos)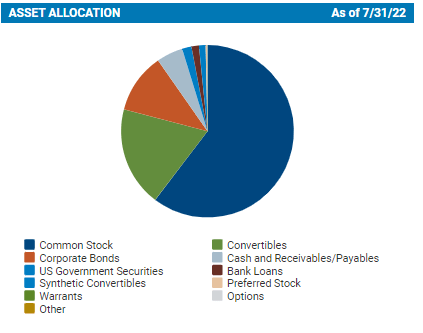
Since I’ve been following the fund, this has been a similar breakdown through the years.
Looking at the sector weightings, we see that tech is the highest allocation. At first, it doesn’t come across as an abnormally large figure. The S&P 500 has a higher weighting to tech than this. However, it is considerably higher than the healthcare exposure, that’s the next largest sector weighting. The tech weighting came down some from the prior update, which stood at 24%.
CSQ Sector Weighting (Calamos)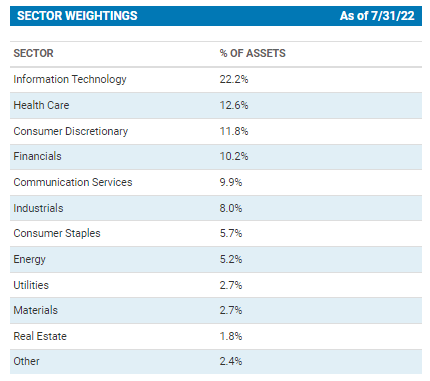
The top ten represent 22.6% of the portfolio. Previously, it accounted for 22.3% of the fund, so not a meaningful change at this time. Overall, CEFConnect reported 812 total holdings at the end of May 2022.
After the top ten, the weightings of the positions fall quite dramatically. This isn’t unusual for a fund that invests in a fair bit of junk-rated bonds and unrated convertibles. The idea would be to spread the risk out over many positions; no single position would be able to have a meaningful impact if they default.
CSQ Top Ten (Calamos)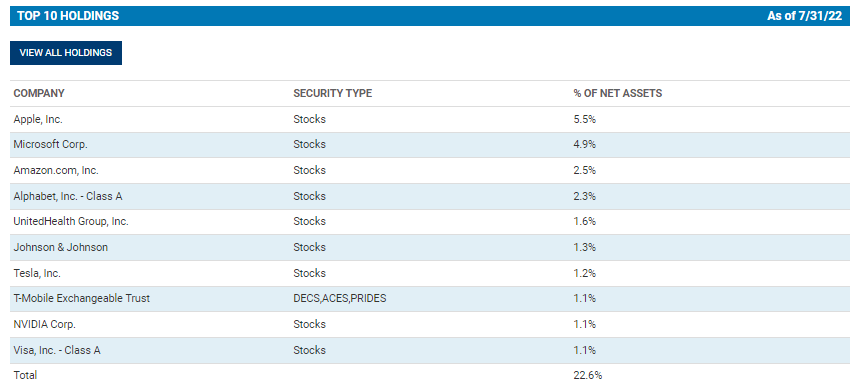
Apple (AAPL), Microsoft (MSFT), Amazon (AMZN) and Alphabet (GOOG) were all positions 1 through 4 in the last update as well. That said, Meta Platforms (META) no longer appear in a top position. It had fallen to a weighting of just 0.85% as of June 30th, 2022.
This isn’t too surprising to see why the position would have dropped so dramatically. Over the last year, META has been a terrible performer. That’s saying a lot when the market overall has been quite terrible too. AAPL has managed to hang onto some gains over the years year.
MSFT is barely hanging on to positive territory. That would be thanks to a mediocre earnings report but guidance that excited investors. AMZN was deeper in losses but had reversed some of those with a stronger earnings report in the latest quarter.
Ycharts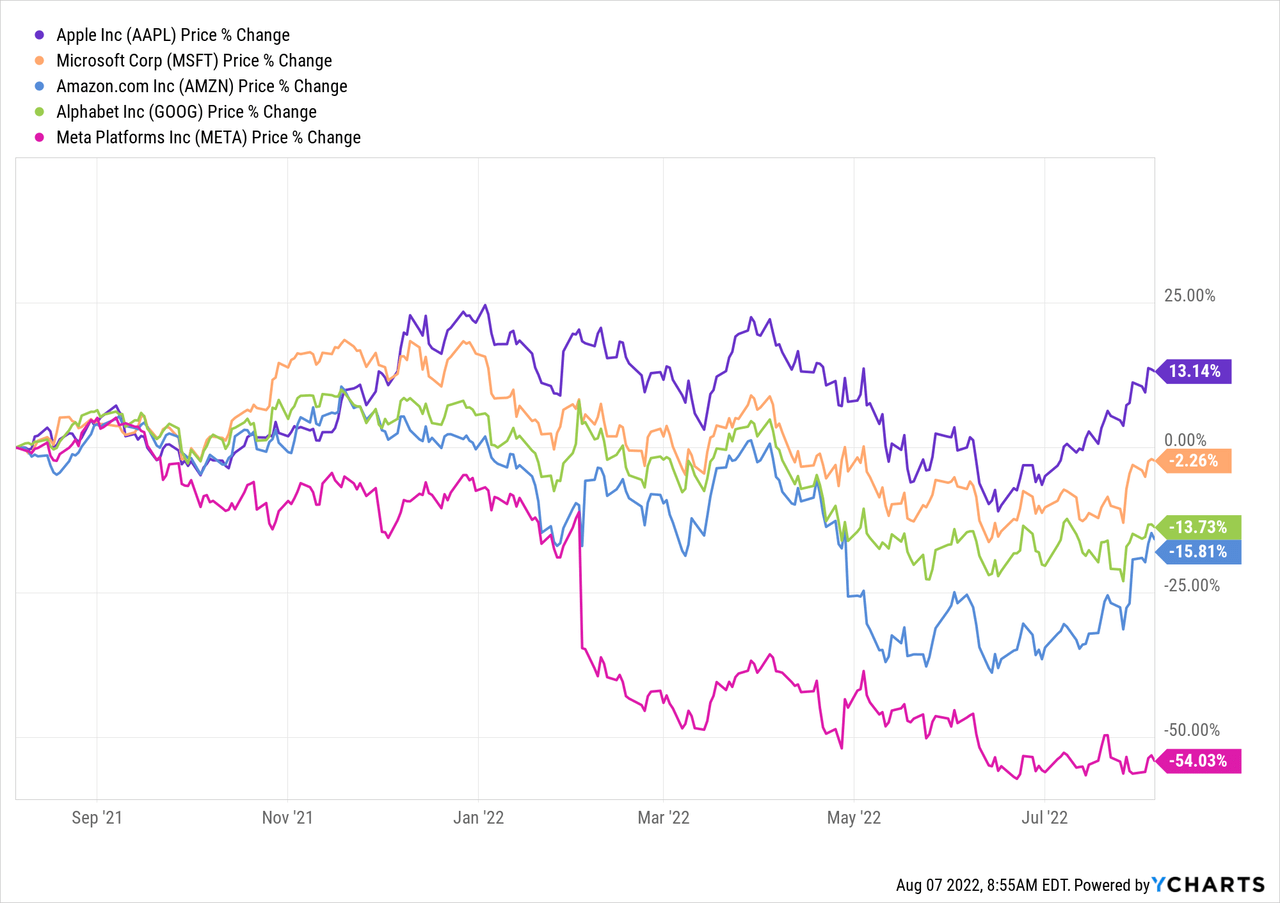
Here’s what the managers had to say in the last quarterly commentary.
After a wild ride, the first half of 2022 is finally over. That’s the good news. The bad news is that we are only at the midpoint of a year that is likely to play out with continued volatility in light of an abundance of investor concerns. What started out as a modest sell-off in the markets this year—brought on by the collective realization that the Federal Reserve had to end its overly accommodative pandemic policies—quickly accelerated into bear market territory in the second quarter as it became clear that the Fed needed to take much more aggressive tack to combat stubbornly high inflation, even though economic growth had peaked.
Given the fund’s expectations for a fairly volatile remainder of 2022, I wouldn’t expect the managers to position the portfolio too much differently. Sticking with a higher allocation of mega-cap tech names has provided stability to the fund. Names such as UnitedHealth Group (UNH) and Johnson & Johnson (JNJ) have been holding up fairly well too. UNH has been strong over the last year, but JNJ has been holding flat. Flat in a bear market can be a relief.
Ycharts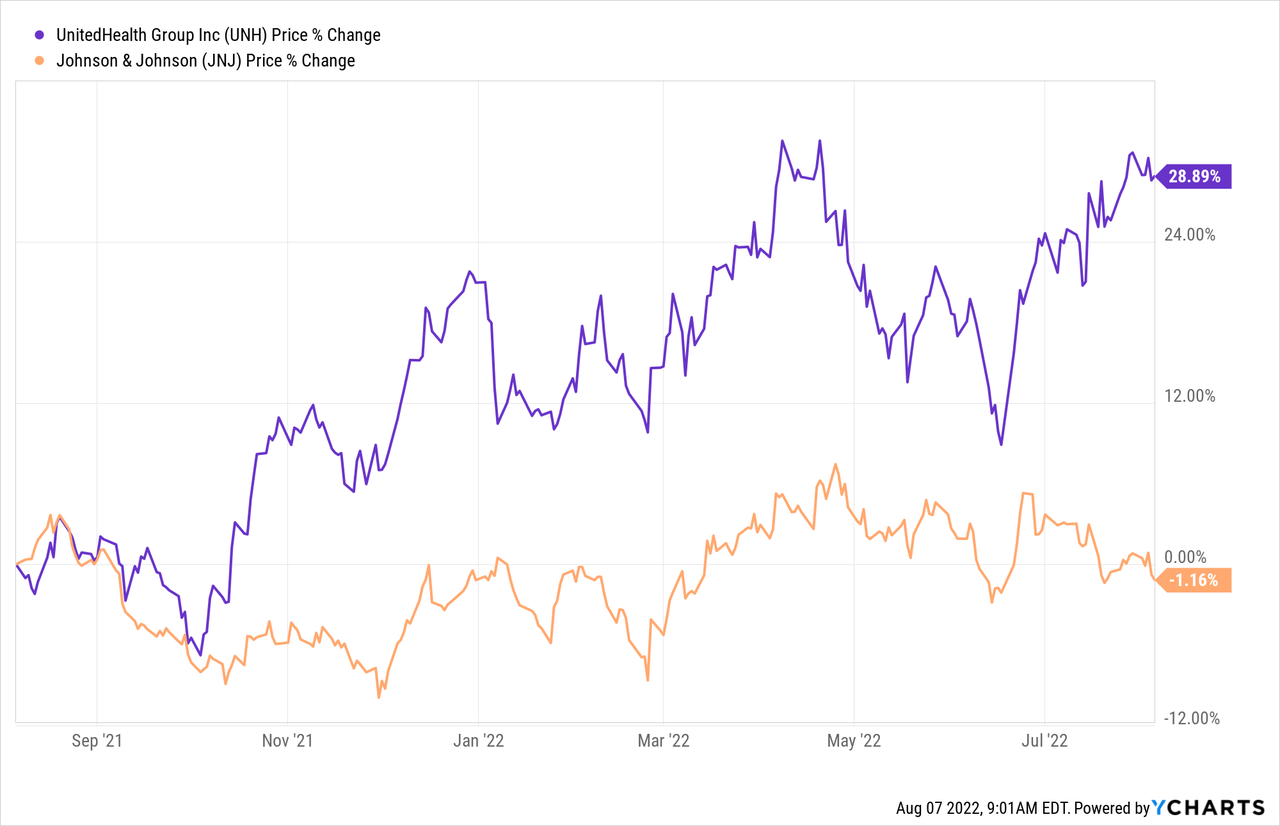
Conclusion
CSQ is rather elevated based on its premium at this time. The fund has regularly been going back and forth between a discount and premium over the last several years now. That being said, it is on the higher end at this time. One of the reasons that it could still be worth buying is that prices are still down from where they were in terms of the underlying portfolio. If entering a position, it seems that a dollar-cost average approach would be the most appropriate.
Be the first to comment