

peshkov/iStock via Getty Images
Reactionary behavior typically creates a pitfall for intuitive responses. Markets, being counterintuitive, consequently take your money away with such an approach. As a result, we need a plan and follow that plan. We want to share our plan for this year when it comes to Bitcoin (BTC-USD). Our main focus is risk control, of course. Especially as the recent deep pullback in Bitcoin has once again shaken the confidence of investors and hodlers while most if not all weak and leveraged hands have been destroyed.
The plan:
As technicians, we like to stack odds from a fundamental and technical perspective to skew a profitable outcome in our favor. For 2022, as a midterm view, we see the following edges as positive support for Bitcoin prices rising.
It is an election year when Democrats will project political pressure upon the Federal Reserve to not risk through aggressive policy changes a stock market collapse to keep their votes. As a result, more money printing expands inflation, which supports the interest for Bitcoin as an inflation hedge. Should we see in opposition for whatever reason a rapid stock market decline, the investor would unlikely be interested in owning stock or bonds. While initially, Bitcoin prices would likely fall alongside the markets, money will likely flow into Bitcoin shortly afterward.
The execution:
With Bitcoin prices suppressed from their recent decline (down 52% from its last all-time high at around US$69,000), we have another edge for minimizing exposure risk.
BTC in US-Dollar, monthly chart, high likely turning points:
Bitcoin in US-Dollar, monthly chart as of January 31st, 2022. (Midas Touch Consulting & The Standard)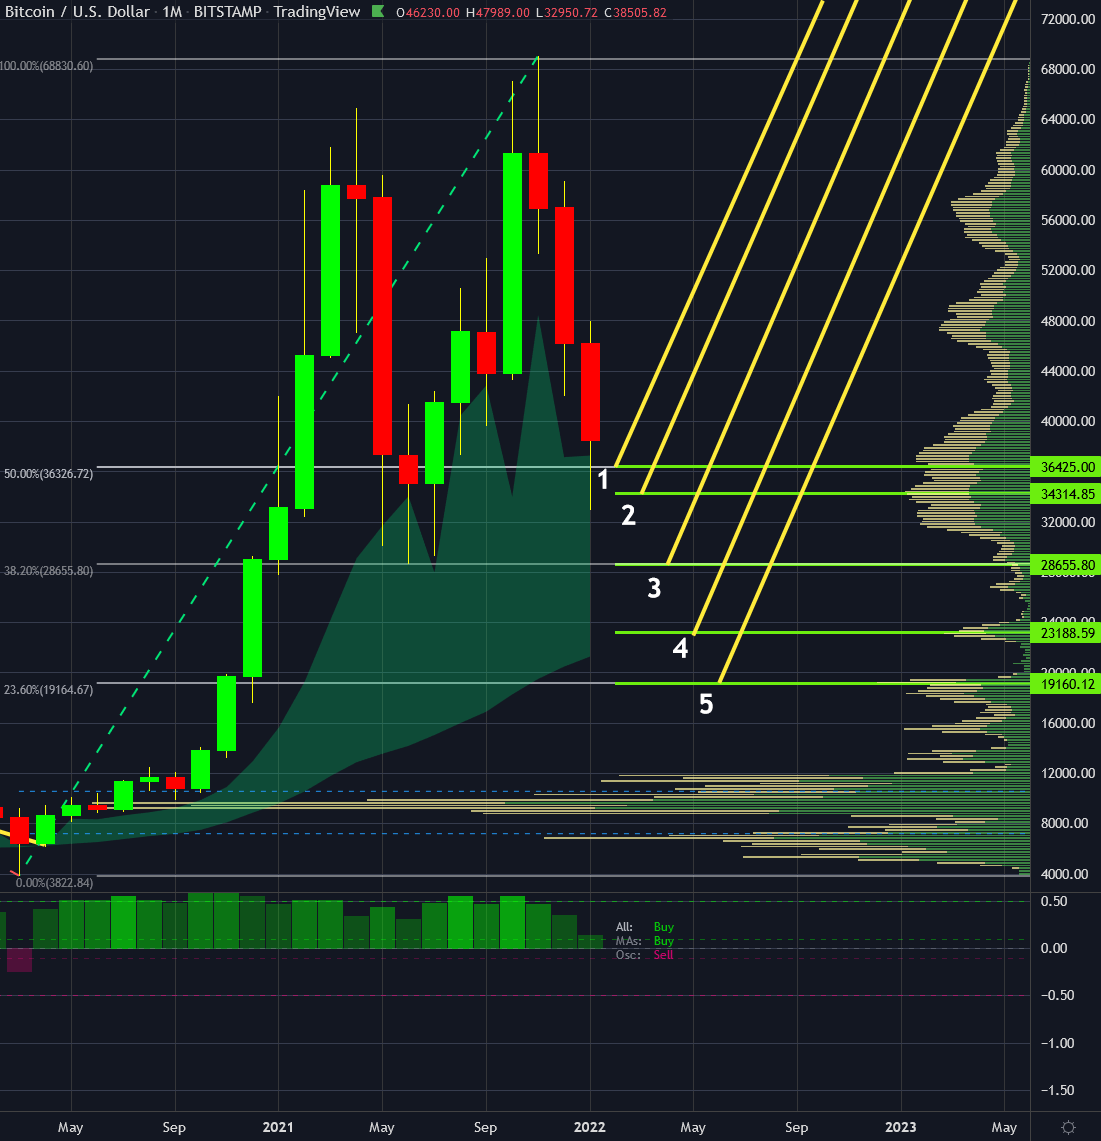
The chart above depicts five supply zones we have our eye on. We will try identifying low-risk entry points on smaller time frames at or near these points and reduce risk further with our quad exit strategy.
We already had entries near zone 1 and 2 and posted those live in our free Telegram channel.
BTC in US-Dollar, weekly chart, Bitcoin, the plan, and its execution, reload trading:
Bitcoin in US-Dollar, weekly chart as of February 1st, 2022. (Midas Touch Consulting & The Standard)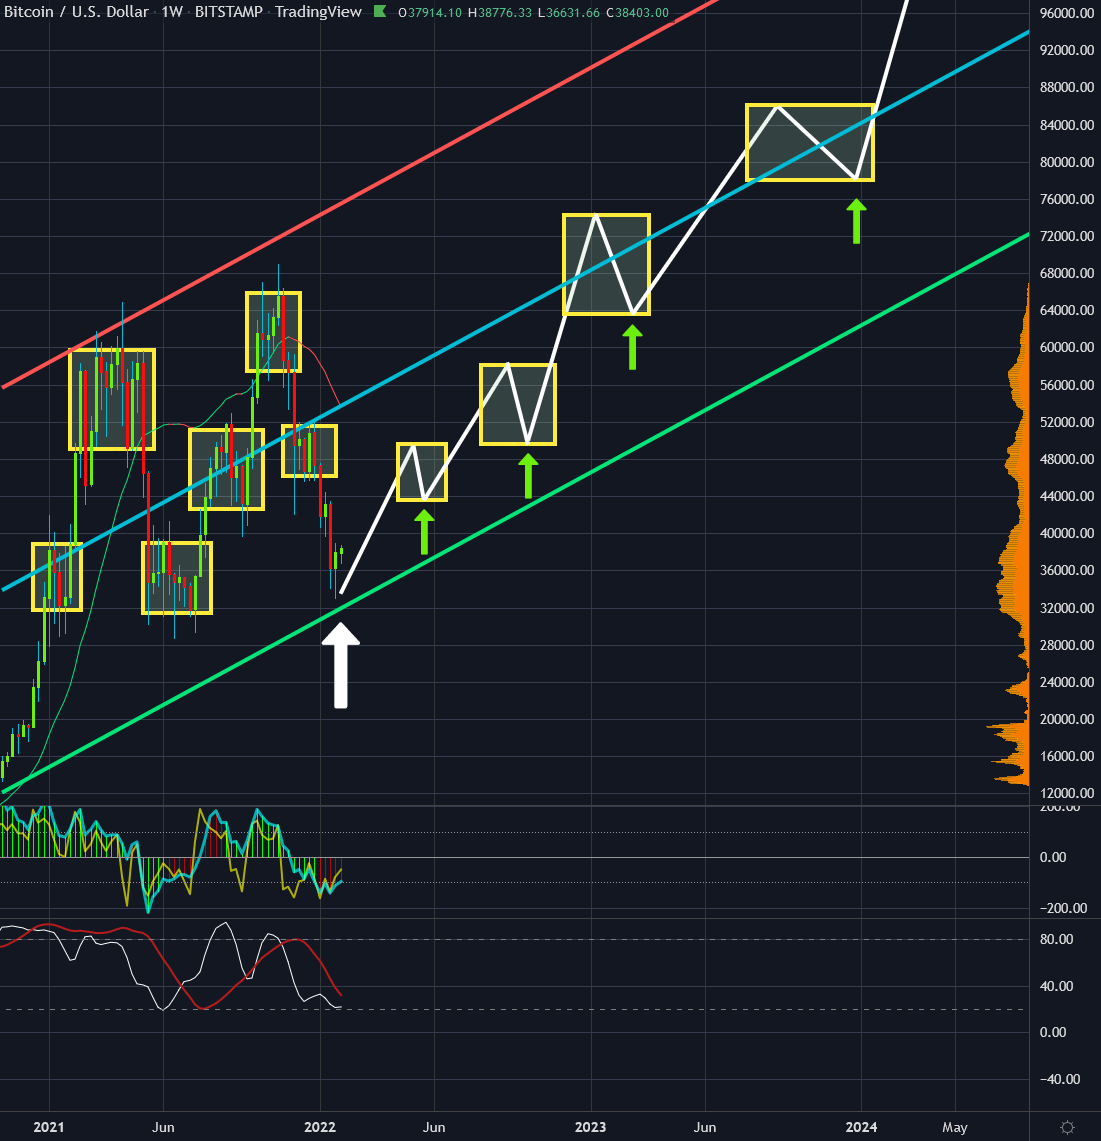
Once the more significant time frame turning point is identified (white arrow), we will add what we call ‘reload’ trades (see chart above) on the smaller weekly time frame.
We do so by identifying low-risk entries in congestion zones (yellow boxes) on the way up. We aim to arrive near the elections in November with a sizable position that is due to our exit strategy being risk-free. Playing with the market’s money will allow for positive execution psychology and ease us to observe our position through an expected volatility period, with further profit-taking into possible volatile upswings that are only temporary in nature.
BTC in US-Dollar, quarterly chart, long-term profit potential:
Bitcoin in US-Dollar, quarterly chart as of February 1st, 2022. (Midas Touch Consulting & The Standard)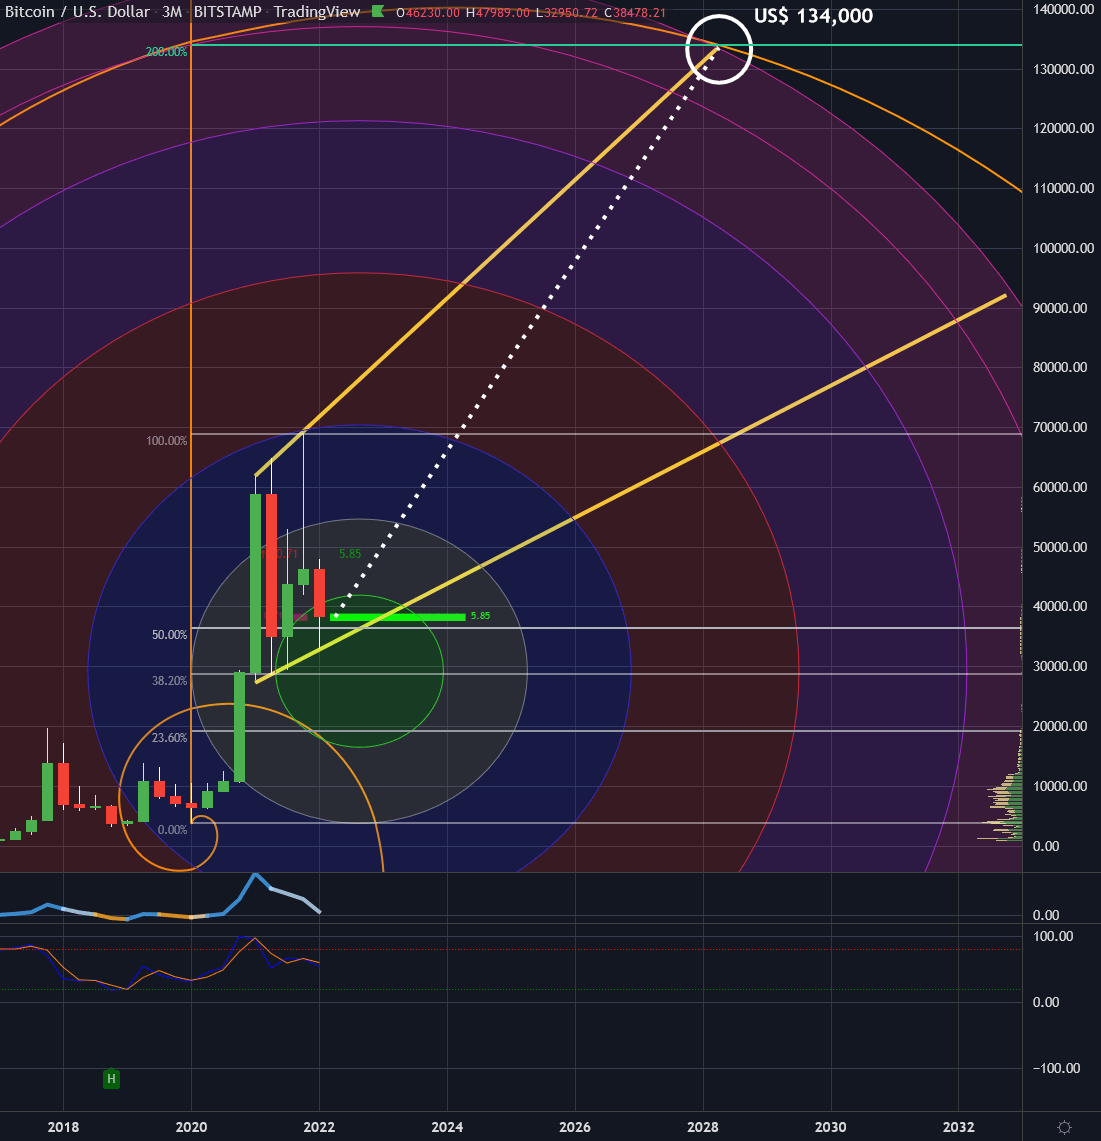
While this year’s midterm trading on the long side of the Bitcoin as well as the Grayscale Bitcoin Trust (OTC:GBTC) market could provide for substantial income from the 50% profit-taking of each individual trade and reload based on our quad exit strategy, the real goal is to have a remaining position size that could potentially go to unfathomable heights, since we see in the long term the inflation problem not going away but rather culminating in a Bitcoin rise that could be substantially much larger in percentage than alternative inflation hedges like real estate, gold, silver and alike. Not to say that we find it also essential to hold these asset classes for wealth preservation.
The quarterly chart above illustrates the potential of such a position. We illustrated both in time (six years) and price (US$134,000) our most conservative model in this chart.
Bitcoin, the plan, and its execution:
We see no scenario where inflation is just going away. The above narrative shows that a short-term fuelling of inflation is likely. Furthermore, a high-risk scenario is fuelling inflation even more. Should markets decline rapidly, it can be expected that money printing and buying up the market is the most predominant solution applied by central bankers.
Consequently, the average investor would wake up relieved that prices wouldn’t decline any further. And liquidating their holdings in a further inflated fiat currency will have massively decreased purchasing power. Hence, we continue to believe that holding Bitcoin is essential for wealth preservation. We already had entries near zone 1 and 2 at around US$34,000 and at around US$36,000, which we posted live in our free Telegram channel.
Be the first to comment