

Crude Oil Price Talking Points
The rally in the price of oil appears to be unraveling as the Organization of Petroleum Exporting Countries (OPEC) show a greater willingness to boost production, and recent developments in the Relative Strength Index (RSI) point to a larger pullback in crude as it falls below 70 to indicate a textbook sell signal.
Crude Oil Price Pullback Triggers RSI Sell Signal
The price of oil has fallen more than 10% after trading to a fresh yearly high ($130.50) as United Arab Emirates (UAE) Ambassador Yousef Al Otaiba states that “we favor production increases and will be encouraging OPEC to consider higher production levels.”
The statement goes onto say that “stability in energy markets is critical to the global economy,” and it remains to be seen if OPEC+ will adjust the output schedule as the group plans to “adjust upward the monthly overall production by 0.4 mb/d for the month of April 2022.”
As a result, limited supply may keep the price of oil afloat as fresh figures from the Energy Information Administration (EIA) show weekly field production unchanged for the fifth consecutive week, with US output holding steady at 11,600K in the week ending March 4.
In turn, the recent weakness in the price of oil may turn out to be a correction in the broader trend as OPEC appears to be in no rush to respond to the Russia-Ukraine war, and crude prices may continue to squeeze higher in 2022 as US production remains subdued.
With that said, the price of may stage further attempts to test the July 2008 high ($147.27) ahead of the next OPEC+ Ministerial Meeting on March 31 amid the ongoing disruption caused by the Russia-Ukraine war, but the Relative Strength Index (RSI) warns of a larger pullback in crude as it falls below 70 to indicate a textbook sell signal.
Crude Oil Price Daily Chart
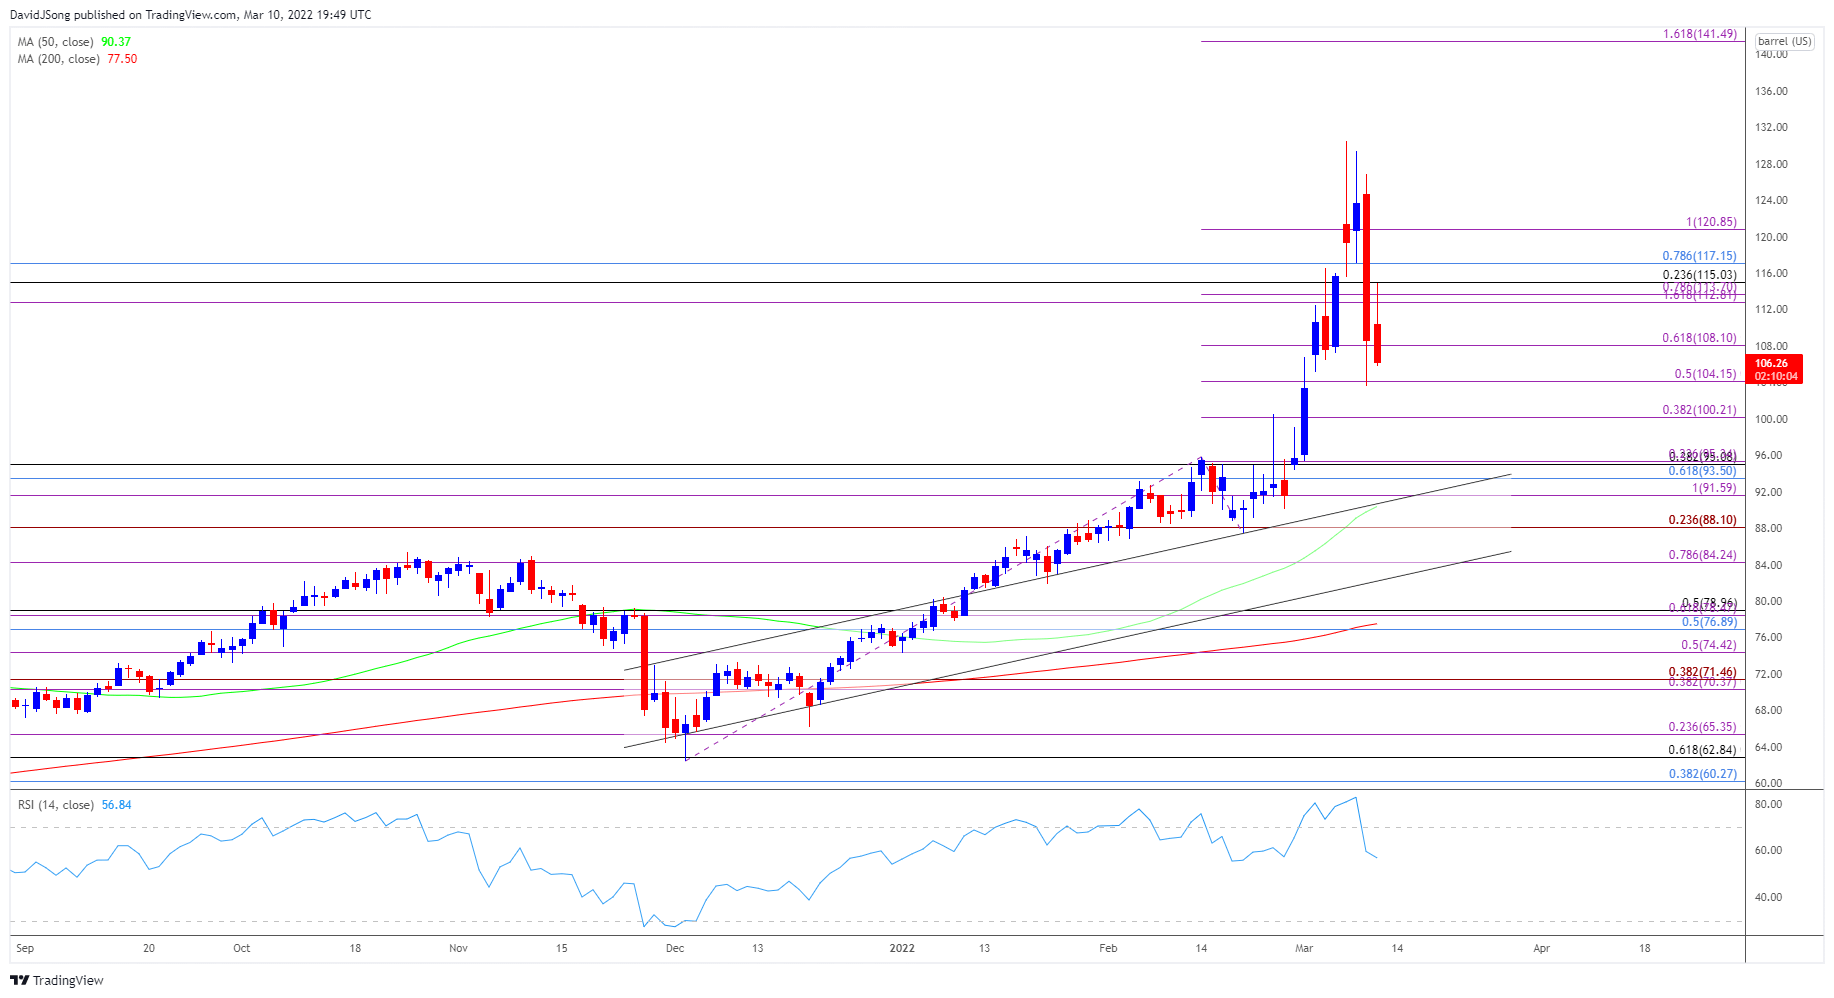
Source: Trading View
- The price of oil cleared the August 2008 high ($128.60) as it jumped to a fresh yearly high ($130.50), with the recent rally pushing the Relative Strength Index (RSI) into overbought territory for the fourth time in 2022.
- However, the price of oil appears to have reversed ahead of the record high high ($147.27) as the RSI falls below 70 to indicate a textbook sell signal, and failure to hold above the $104.20 (50% expansion) region may push crude towards the $100.20 (38.2% expansion) area as the bullish momentum abates.
- It remains to be seen if the recent weakness in the price of gold will turn out to be a correction in the broader trend as both the 50-Day SMA ($90.38) and 200-Day SMA ($77.51) reflect a positive slope, and crude may stage further attempts to test the July 2008 high ($147.27) as long as it manages to hold above the former resistance zone around $95.10 (38.2% retracement) to $95.20 (23.5% expansion).
— Written by David Song, Currency Strategist
Follow me on Twitter at @DavidJSong
Be the first to comment