

Crude Oil, API Inventory, EIA, Inventory, Prompt Spread- Talking Points
- Oil rises alongside broader market as risk aversion pulls back
- EIA inventory data eyed after API shows US inventory draw
- Technical outlook puts December high in focus after gains
Oil prices are rising through Asia-Pacific trading after a pullback in risk aversion surrounding Covid fears boosted the commodity. A bullish inventory report from the American Petroleum Institute (API) was the spark that sent prices higher from the overnight US session. The API report revealed a 3.67 million barrel reduction in crude oil inventories for the week ending December 17. Analysts expected a draw of 2.63 million barrels.
Energy traders will look to the Energy Information Administration’s (EIA) report due out tonight to confirm the inventory reductions. Analysts expect to see a draw in line with what the API reported. The government report, being the EIA, typically gives a more significant reaction in oil prices. That is because analysts generally regard the EIA’s numbers as more accurate, which is due to oil firms’ legal obligations to report accurate and timely information to the US government.
Tonight’s report will also have a strong focus on stockpiles at Cushing, Oklahoma – the major US storage hub where futures contracts are priced. That metric has a strong influence on crude oil’s prompt time spread, which is the difference in price between the current contract and the following month’s contract. A reading above 0 indicates a market in backwardation, a structure typically seen as more bullish for prices. Alternatively, a reading below 0 shows a market in contango, indicating less demand on current supply and thus being bearish for prices.
Currently, that chart shows the market structure moving further into backwardation, indicating demand may be increasing. However, the oil market’s backwardation is much less steep than in late October and early November. Watching this spread following tonight’s inventory data may provide a hint at where prices are going in the short term.
Chart created with TradingView
Crude Oil Technical Forecast
Crude oil prices broke above a descending trendline from November and the 20-day Simple Moving Average overnight. The next level that may pose as resistance is the falling 26-day Exponential Moving Average (EMA). Piercing above that EMA would open the door for a test of the December swing high at 73.30. A move back to the downside may see prices bounce off the November trendline.
Crude Oil Daily Chart
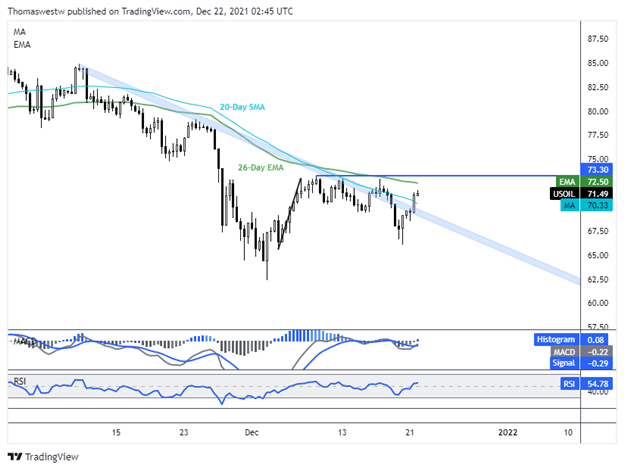
Chart created with TradingView
— Written by Thomas Westwater, Analyst for DailyFX.com
To contact Thomas, use the comments section below or @FxWestwateron Twitter
Be the first to comment