

Oil Price Talking Points
The price of oil bounces back from a fresh monthly low ($61.95) after showing a limited reaction to the less-than-expected rise in US inventories, but recent developments in the Relative Strength Index (RSI) warn of a larger correction in crude as the indicator snaps the upward trend from earlier this year.
Oil Price Forecast: Crude Establishes Double Top Formation in May
The price of oil appears to have established a double-top formation following the failed attempt to test the March high ($67.98) as it snaps the opening range for May. Lack of momentum to hold above the 50-Day SMA ($62.72) may push crude towards the April low ($57.63) as the Organization of the Petroleum Exporting Countries (OPEC)remains on track to gradually restore production over the coming months.
OPEC and its allies appear to be on a preset course as the most recent Monthly Oil Market Report (MOMR) forecasts world oil demand in 2021 to “increase by 6.0 mb/d, unchanged from last month’s estimate, to average 96.5 mb/d,” but the 1.321M rise in US crude inventories may become a concern for the group as the data warns of a protracted recovery.
It remains to be seen if OPEC+ will stick to the production adjustment table as the resurgence of COVID-19 dampens the outlook for global growth, and the price of oil may face headwinds ahead of the next Joint Ministerial Monitoring Committee (JMMC) meeting on June 1 as it snaps the opening range for May.
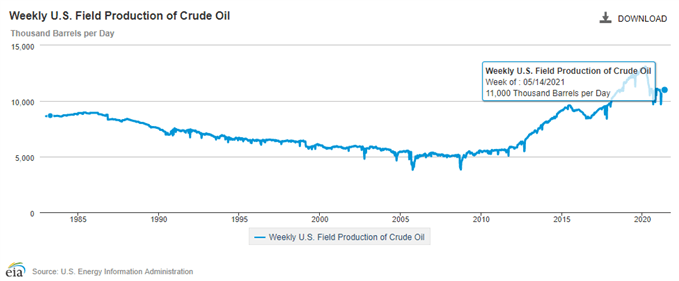
Nevertheless, the ongoing weakness in US production may cushion oil prices as weekly field output prints at 11,000K for the second week, and OPEC and its allies may gradually restore production throughout the first half of 2021 as “the recovery is expected to pick up speed in the second half of the year.”
With that said, the price of oil may track the March range as US crude output continues to sit at its lowest level since 2018, but recent developments in the Relative Strength Index (RSI) warn of a larger correction in crude as the indicator snaps the upward trend from earlier this year.
Oil Price Daily Chart
Source: Trading View
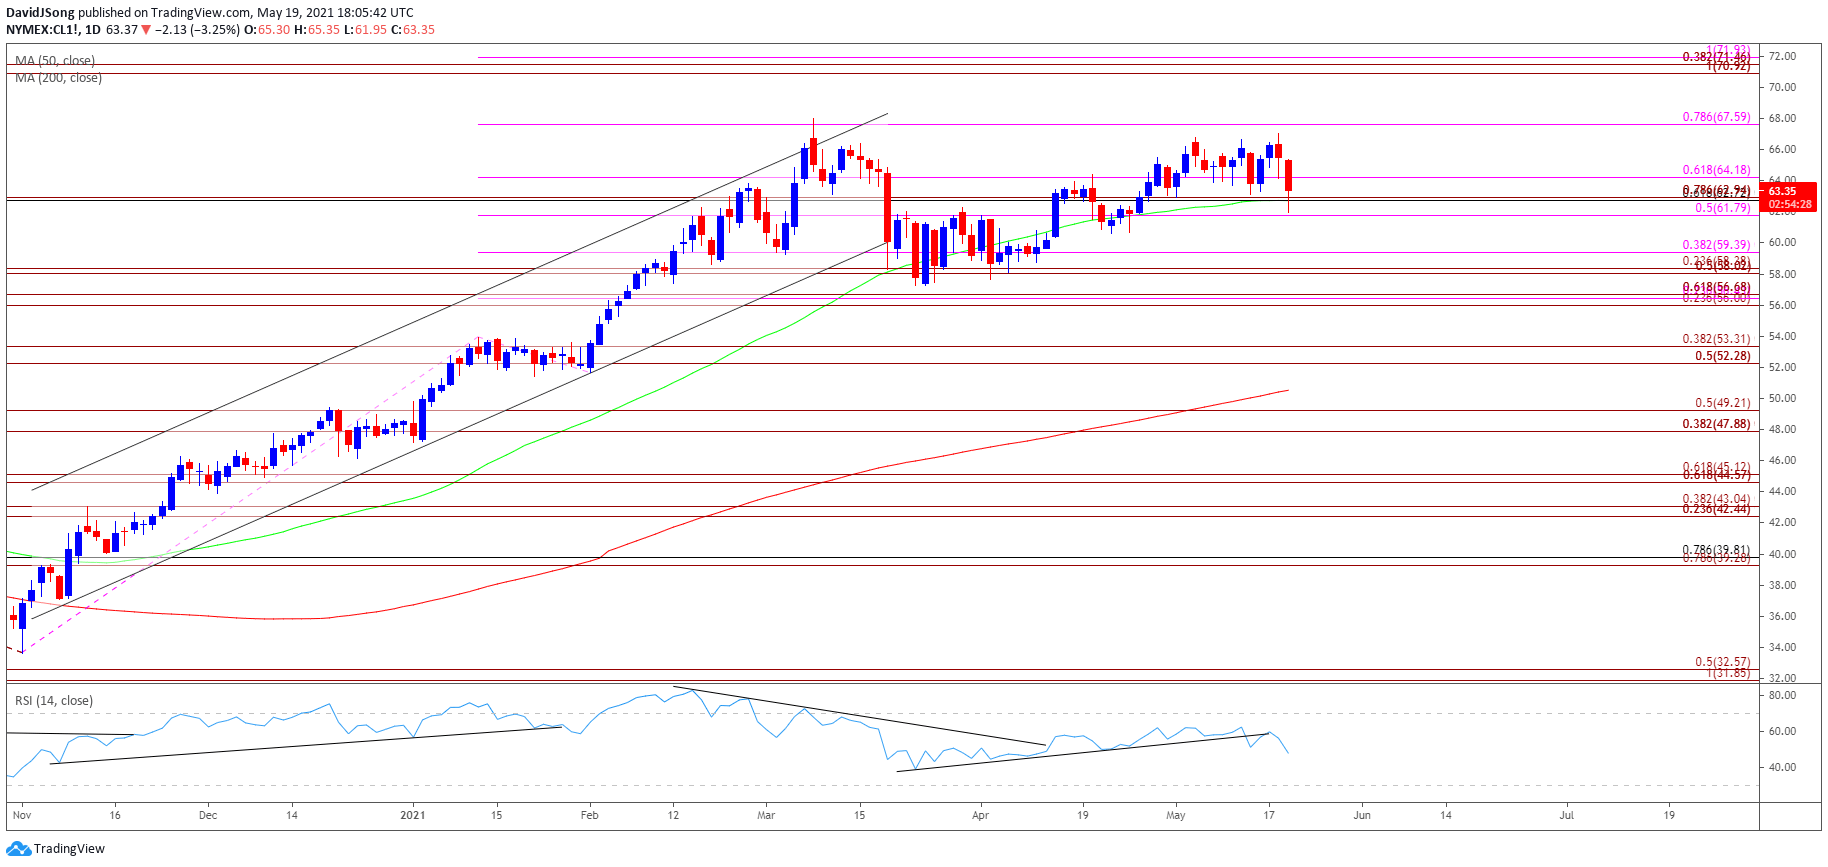
- Keep in mind, crude broke out of the range bound price action from the third quarter of 2020 as it established an upward trending channel, with the price of oil taking out the 2019 high ($66.60) as both the 50-Day SMA ($62.72) and 200-Day SMA ($50.53) still reflect a positive slope.
- It remains to be seen if the decline from the March high ($67.98) will turn out to be a correction in the broader trend or a change in market behavior as the price of oil fails to retain the upward trending channel from late last year, but recent developments in the Relative Strength Index (RSI) warn of a larger decline in crude prices as the indicator snaps the upward trend from earlier this year.
- The price of oil has snapped the opening range for May following the failed attempt to test the $67.60 (78.6% expansion) zone, with a break/close below the $61.80 (50% expansion) area bringing the $59.40 (38.2% expansion) region on the radar.
- Next area of interest comes in around $58.00 (50% expansion) to $58.40 (23.6% expansion), with a move below the April low ($57.63) opening up the Fibonacci overlap around $56.00 (23.6% expansion) to $56.70 (61.8% expansion).
— Written by David Song, Currency Strategist
Follow me on Twitter at @DavidJSong
Be the first to comment