

Eoneren/E+ via Getty Images
Introduction
Following Crestwood Equity Partners (NYSE:CEQP) successfully sustaining their distributions throughout the severe downturn of 2020, by the middle of 2021 it appeared that higher distributions could follow their Stagecoach divestiture, as my previous article discussed. Since well over half a year has now subsequently elapsed, this article provides a refreshed analysis as they seemingly see a new era of distribution growth possibly beginning for their high 8.26% yield following their acquisition of Oasis Midstream with management flagging an upcoming 5% distribution increase.
Executive Summary And Ratings
Since many readers are likely short on time, the table below provides a very brief executive summary and ratings for the primary criteria that were assessed. This Google Document provides a list of all my equivalent ratings as well as more information regarding my rating system. The following section provides a detailed analysis for those readers who are wishing to dig deeper into their situation.
Author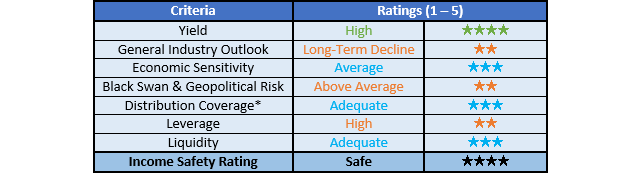
*Instead of simply assessing distribution coverage through distributable cash flow, I prefer to utilize free cash flow since it provides the toughest criteria and also best captures the true impact upon their financial position.
Detailed Analysis
Author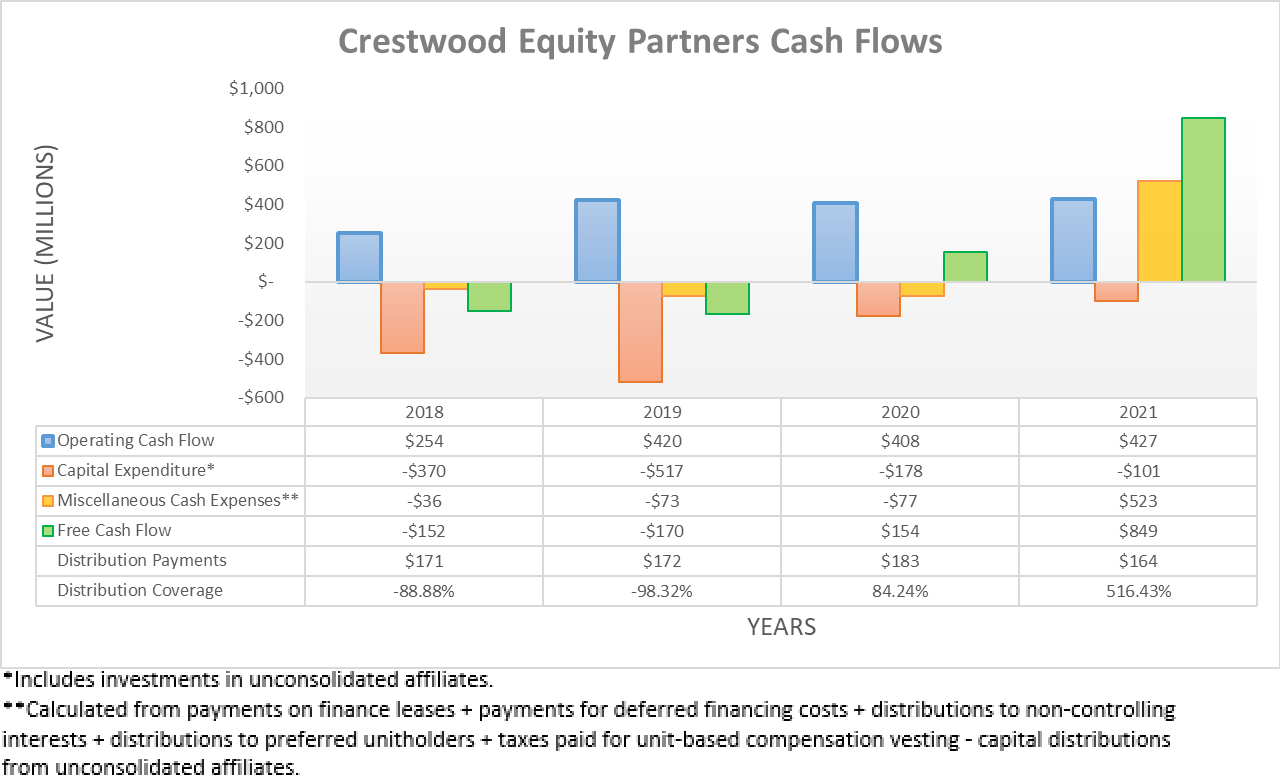
Whilst their cash flow performance was not headline-grabbing during 2021, at least it remained solid with their operating cash flow increasing slightly to $427m and thus managing to narrowly set a new record atop their previous best of $420m during 2019, plus also obviously besting their previous result of $408m during 2020. They also significantly reduced their capital expenditure with 2021 only seeing $101m and thus well below the $178m during 2020. Even though this helped boost their free cash flow, its exceedingly high result of $849m was aided massively by a $640.9m one-off distribution from unconsolidated affiliates due to their Stagecoach divestiture, as seen within their miscellaneous cash expenses in the graph included above and subsequently discussed. If not for this boost, their free cash flow would have actually been $208m, which would have still provided strong coverage of 127% to their distribution payments of $164m. When looking ahead, the completion of their Oasis Midstream acquisition during the first quarter of 2022 makes for a strong year of growth, as the table included below displays.
Crestwood Equity Partners Fourth Quarter Of 2021 Results Presentation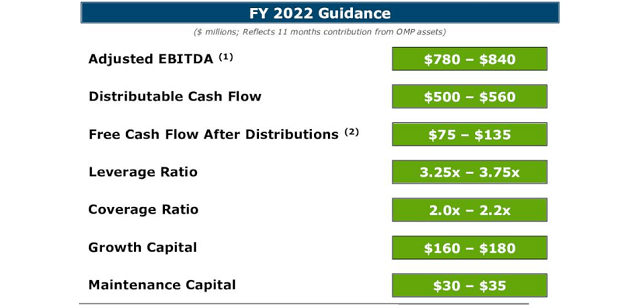
When reviewing their guidance for 2022, it forecasts their adjusted EBITDA to reach $810m at the midpoint, which represents a very large 34.98% year-on-year increase versus their result of $600.1m during 2021, as per their previously linked fourth quarter of 2021 results announcement. Since their operating cash flow during 2021 saw no material working capital movements, their results during 2022 should see a comparable increase to their adjusted EBITDA given their positive correlations, thereby seeing their estimated operating cash flow at circa $576m. Meanwhile, their guidance for 2022 also states growth capital expenditure of $170m at the midpoint, along with maintenance capital expenditure of $32.5m at the midpoint, which makes for a total of circa $202.5m and thus approximately twice its level of $101m during 2021.
Once their capital expenditure guidance for 2022 is subtracted from their estimated operating cash flow, it leaves an estimated free cash flow subtotal of $373.5m before considering their miscellaneous cash expenses. These are primarily comprised of their distributions to non-controlling interests and preferred unitholders, partially offset by their distributions from unconsolidated affiliates, as the table included below displays. Historically speaking, the latter was mostly related to their now divested Stagecoach stake and as a result, their distributions from unconsolidated affiliates will likely be materially lower going forwards and thus by extension, their miscellaneous cash expenses will likely be higher.
Crestwood Equity Partners 2021 10-K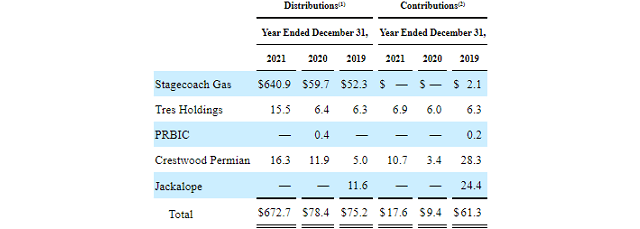
When looking back, their distributions to non-controlling interests and preferred unitholders were $40.2m and $60.1m respectively during 2021, whilst their distributions from unconsolidated affiliates were $31.8m when excluding those relating to their now divested Stagecoach stake. This equates to total miscellaneous cash expenses of $68.5m when aggregated, which seems reasonable to round up to circa $75m when looking into 2022 to account for various other relatively small expenses and provide a margin of safety. After being subtracted from their estimated free cash flow subtotal, it sees their estimated free cash flow for 2022 at circa $300m.
Even after seeing their outstanding unit count surge to 97,978,074 following their Oasis Midstream acquisition, it would only cost roughly $257.2m per annum to fund annual distributions of $2.625 per unit, which represents their forecast upcoming 5% increase for the next quarter versus their previous annual distributions of $2.50 per unit. When compared against their estimated free cash flow for 2022, this would ultimately see adequate distribution coverage of approximately 117%, thereby leaving only thin excess free cash flow after distribution payments.
Since their guidance for 2022 only incorporates eleven months of earnings from Oasis Midstream, it stands to reason that 2023 should see further increases versus 2022 and thus making room for further distribution growth. Although past this point, if they are to safely provide further distribution growth in coming years, they will require a combination of lower capital expenditure and higher earnings since their estimated excess free cash flow after distribution payments would otherwise remain thin and hinder deleveraging, which sits as their number one capital allocation priority, as per slide eleven of their fourth quarter of 2021 results presentation.
Author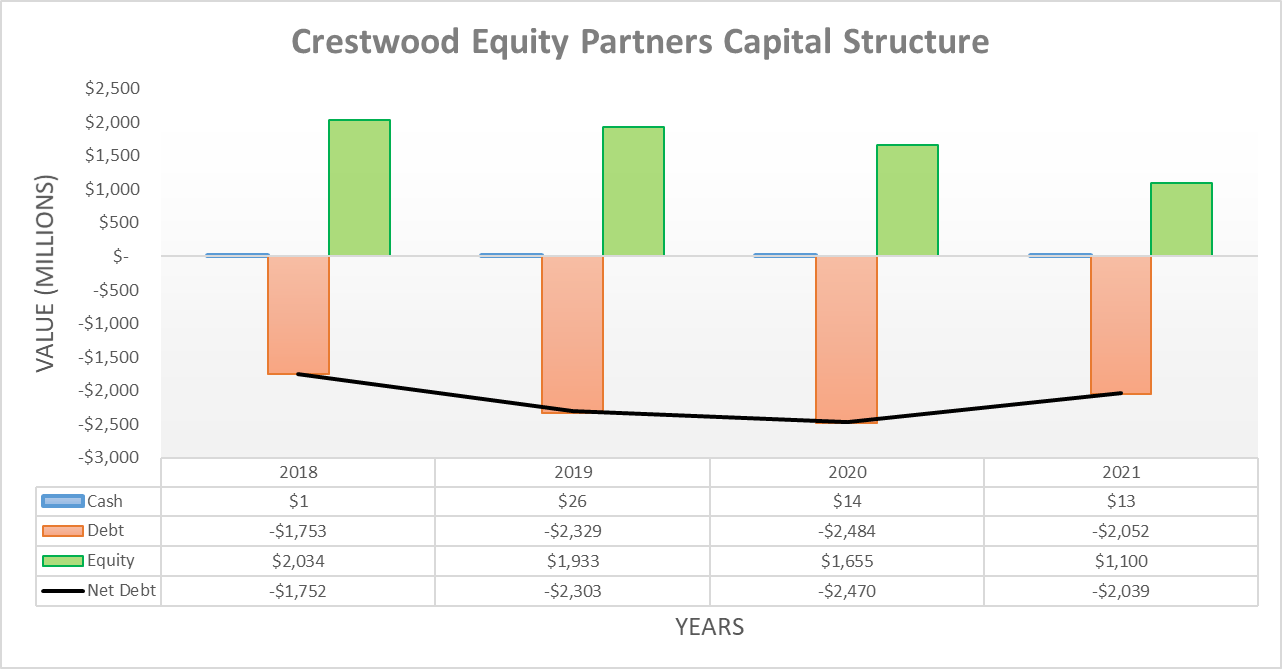
Thanks to their excess free cash flow after distribution payments and Stagecoach divestiture, their net debt ended 2021 noticeably lower at $2.039b versus the $2.47b where it ended 2020. Although this decrease is only short-lived with their Oasis Midstream acquisition seeing the assumption of $828m of debt, as per slide eight of their previously linked fourth quarter of 2021 results presentation. When combined with the further $160m consideration paid for the acquisition, it sees a total increase of $988m versus the end of 2021 and thus pushes their net debt to $3.027b, thereby representing an increase of 48.45% versus the end of 2020. Due to their thin estimated excess free cash flow after distribution payments during 2022, their net debt is not likely to decrease materially and thus barring any divestitures, it will likely remain near $3b heading into 2023, after which the direction will depend upon their currently yet-to-be-seen capital expenditure and earnings.
Author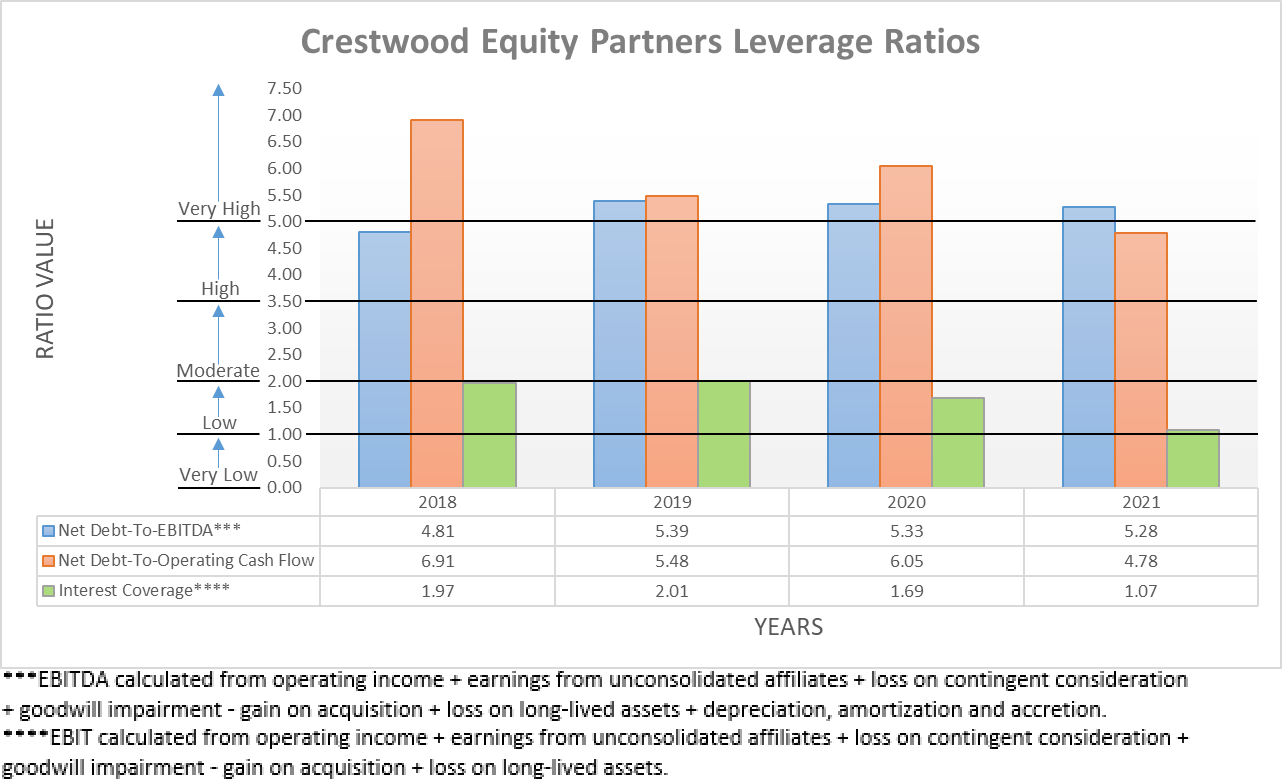
Thanks to their lower net debt and continued solid financial performance, their leverage ended 2021 at the lowest point in recent history since at least the end of 2018 with their net debt-to-operating cash flow at 4.78, thereby under the threshold of 5.01 for very high leverage and down significantly versus its previous result of 6.05 at the end of 2020. Whilst their net debt-to-EBITDA ended 2021 at 5.28 and thus above this threshold and barely any lower than its previous result of 5.33 at the end of 2020, this was merely due to $120.4m of losses arising from their unconsolidated affiliates. If this was removed, it would see their net debt-to-EBITDA at only 4.03 and thus within the high territory of between 3.51 and 5.00, similarly to their net debt-to-operating cash flow.
When looking ahead into 2022, since their net debt appears poised to increase by almost 50% and thus more than the forecast circa 35% to their earnings after their Oasis Midstream acquisition, it means that their leverage will almost certainly increase, unless their earnings significantly surprise to the upside. If these percentages come to pass, they would see their net debt-to-operating cash flow reach 5.25, thereby sitting above the threshold of 5.01 for the very high territory, which highlights the need for deleveraging and thus makes further distribution growth in coming years dependent upon seeing a combination of lower capital expenditure and higher earnings.
Author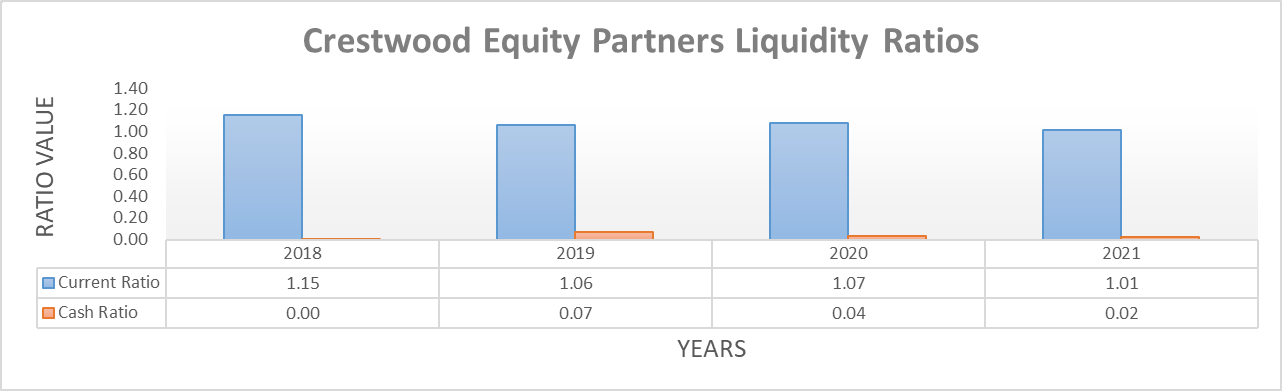
Following the end of 2021, their liquidity remained broadly unchanged with their respective current and cash ratios of 1.01 and 0.02 being very similar to their previous respective results of 1.07 and 0.04 at the end of 2020. Meanwhile, it was positive to see the outstanding balance on their credit facility decrease significantly during 2021 whilst their 2023 senior notes were also effectively refinanced out till 2029, as the table included below displays. Whilst this helps improve their breathing room with a sizeable $1.218b remaining available under their credit facility, it does not resolve the issues clouding the outlook for further distribution growth in the coming years.
Crestwood Equity Partners 2021 10-K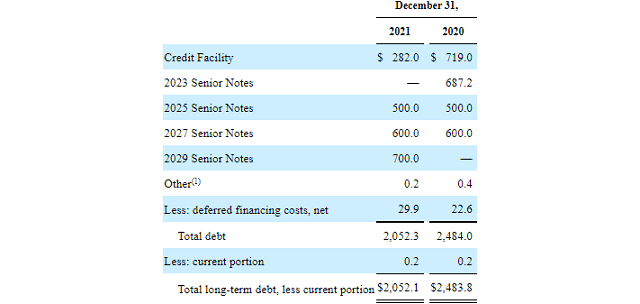
Conclusion
After successfully winning the fight to sustain their distributions throughout the turmoil of 2020, they appear to have seen an era of growth beginning during 2022 with a modest circa 5% increase merely weeks away. Whilst undoubtedly exciting, their ability to safely provide further distribution growth in coming years remains uncertain given their limited excess free cash flow, although at least their current distributions appear safe and thus as a result, I nevertheless still believe that their high 8%+ yield makes maintaining my buy rating appropriate.
Notes: Unless specified otherwise, all figures in this article were taken from Crestwood Equity Partners’ SEC filings, all calculated figures were performed by the author.
Be the first to comment