

6381380/iStock Editorial via Getty Images
Coterra Energy Inc. (NYSE:CTRA) initially came to my attention with its low hedging ratio, which has been a differentiator from other natural gas (NG1:COM) producers that missed out on the gas windfall due to adverse hedges. My cost basis in Coterra is around $20, and, while I think there could be more upside from where it is now, I have been a bit puzzled by calls that it should be a $50+ stock.
Coterra tracks nicely the natural gas futures, so it is a reasonable way to get exposure to gas pricing. However, the $4.5 billion per year free cash flow (or FCF) projection in the latest management presentation is based on 2022 pricing. Gas futures are heavily backwardated and suggest that 2023 Henry Hub pricing could be around $5-$6 per mmbtu, not the $9-$10 we see right now. The $5-$6 range would be amazing by historical standards, coming after multiple years of $2-$3 natural gas, so it’s hardly something to complain about. However, it makes Coterra’s valuation multiple a lot less impressive. Neither is it clear that the cost side of the FCF estimates will remain static. Oilfield services inflation and the maturing shale basins both suggest future production may come at a higher cost.
Who is Coterra?
Coterra is the product of the 2021 merger between Cabot Oil & Gas, a Marcellus based player, and Cimarex Energy, focused on the Permian:
Coterra Energy Presentation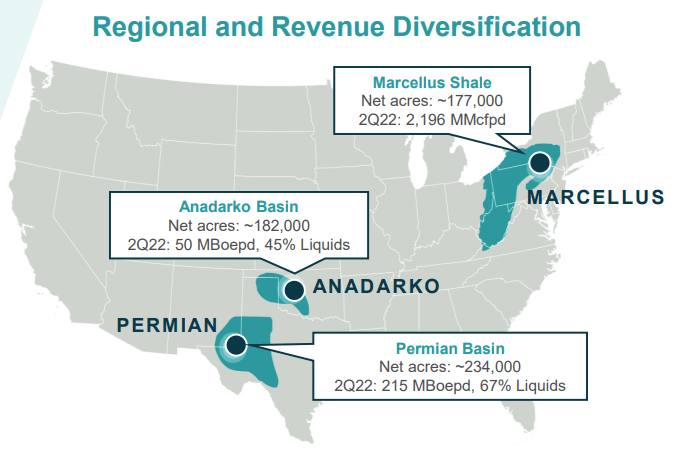
The combined company’s output is 75% natural gas (dry gas), measured by production, although by revenue gas is only 56%, the remainder being crude oil and NGLs. Coterra is one of the very lightly hedged players out there and currently only about 25% of the gas production is hedged.
What is the bull case?
The nice thing about Coterra is that it tracks very closely the market’s expectations of future natural gas prices in the United States (more on U.S. vs. Europe gas below). Here is how CTRA has done over the last year compared to the average of the gas contracts expiring in 2023:
barchart.com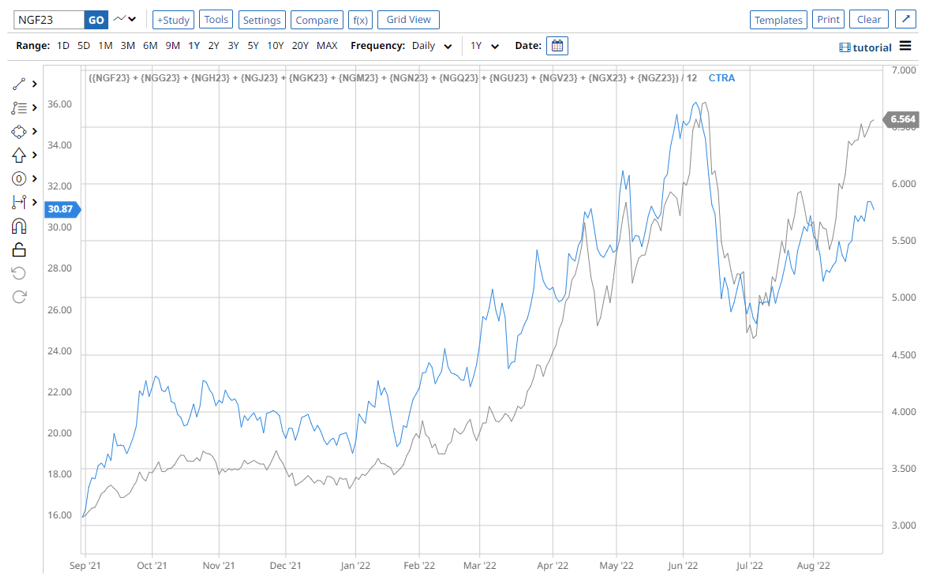
With the exception of the last month, when CTRA appears to be lagging Henry Hub, suggesting some mispricing, gas prices have been reflected timely into the stock price.
The correlation doesn’t say though if the company is under or overvalued in an absolute sense. The August 2 management presentation states that the 2022 projection for FCF at current strip prices is $4.5 billion. With about $26.5 billion enterprise value (or EV), Coterra trades at 5.9x EV / FCF multiple which suggests undervaluation (assuming we think an 8-10x multiple is appropriate).
If we think that the EV / FCF multiple should be 10x, consistent with a 10% return on capital, then we can get from the $30 price now to a $50 target (Coterra has very little debt, so there isn’t as much “torque” for the equity).
Is $10 natural gas now the baseline?
I don’t know, and I don’t necessarily believe that the futures curve is correct either. However, since the 2023 futures trade in the $5-$6 range right now, I think it is prudent to evaluate how a $5 or $6 long-term pricing assumption affects the valuation multiples.
Price differentials aren’t great
Second, Coterra’s realized pricing is at some disadvantage to Henry Hub. The realized (unhedged) sales price for Q2 was $5.78/mcf:
Coterra Energy 10-Q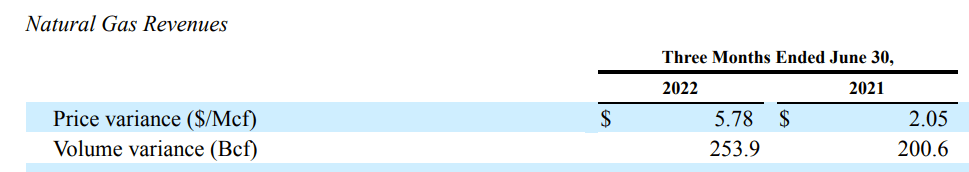
Expressed as $/mcf, Henry Hub averaged $7.21 during Q2, so Coterra’s realization was only about 80% of that. For Q1, Coterra realized $4.33/mcf vs. $4.49/mcf for the benchmark, which was a lot better.
However, compare this to Antero Resources (AR) which also has significant exposure to the Marcellus:
Antero Resources 10-Q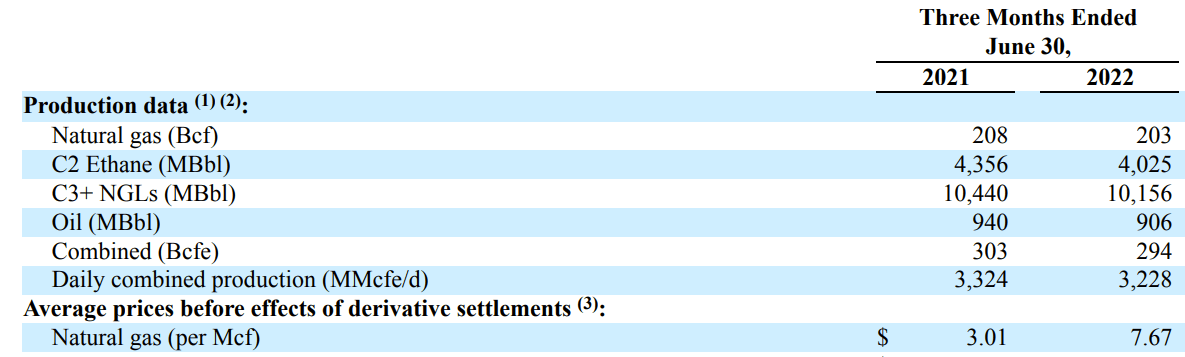
For the same Q2, Antero realized $7.67/mcf, which was actually at premium to Henry Hub. Another Marcellus player, Range Resources (RRC), realized $6.91/mcf for the same time period:
Range Resources Corporation 10-Q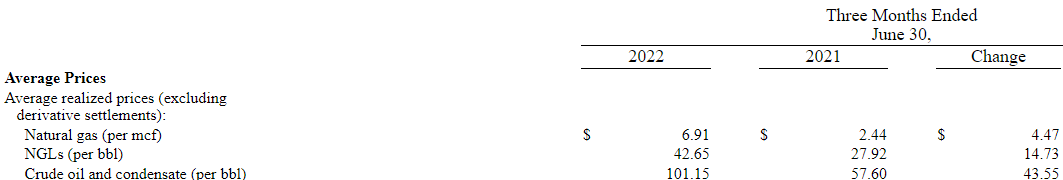
Coterra’s pricing is likely pulled down by the Waha Hub close to the Permian, but still the fact remains that the realized pricing is not as good as what other U.S. gas players enjoy. For my modelling exercise, I have (probably generously) assumed that Coterra will achieve 90% realization of Henry Hub forward.
The valuation isn’t cheap with 2023 pricing
Reflecting the highly uncertain nature of the commodity price, many companies present sensitivity scenarios that show how FCF may be expected to change in a different pricing environment. Coterra, unfortunately, isn’t as generous with information and its presentation doesn’t really do this, except for a reference to a $40 WTI (CL1:COM) / $2.25 Henry Hub “breakeven point.” The breakeven point isn’t very useful here though. By definition, FCF is zero then. It signals some safety cushion, but can’t really inform the valuation.
So to get a sense of what $10 vs. $5 gas means, I resorted to some basic modelling. My production volume and unit cost assumptions are based on the 2022 guidance in the management’s presentation. The areas in which I expect my calculation to be least accurate are production taxes, which would vary with the realization price, as well as the fixed differentials I had to assume. I also (unrealistically) follow management’s guidance for 75% cash tax/ 25% deferred for all price levels.
With these caveats in mind, here is how FCF may move with gas prices, at least directionally:
| Scenario | #1 | #2 | #3 | #4 | #5 | Management presentation |
| WTI, $/bbl | 90 | 90 | 90 | 90 | 90 | ’22 strip |
| Henry Hub, $/mmbtu | 9.0 | 8.0 | 7.0 | 6.0 | 5.0 | ’22 strip |
| Enterprise value ($b) | 26.5 | 26.5 | 26.5 | 26.5 | 26.5 | 26.5 |
| Hedged FCF ($b) | 4.7 | 4.0 | 3.3 | 2.7 | 1.9 | 4.5 |
| EV / FCF | 5.6x | 6.6x | 7.9x | 10.0x | 13.7x | 5.9x |
With $9 gas pricing we indeed see a nice 5-6x multiple, but if we assume that the futures market is correct in anticipating lower 2023 prices, Coterra quickly stops looking cheap. A 10x multiple is consistent with a 10% return on capital (equity plus debt), so one could argue that matches the company’s cost of capital.
In other words, whether Coterra is cheap depends on whether the futures market is wrong. If we stay with $9-$10 or higher gas past this year, then one can see the company as undervalued.
Marginal costs are rising
One worrying data point from the Q2 presentation is the capex budget increase from February to August:
Coterra Energy Presentation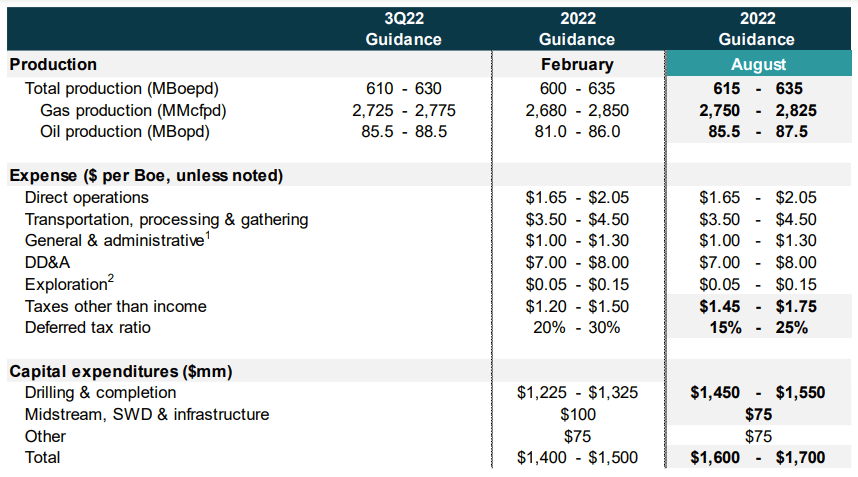
This is a 13% increase over 6 months. Coterra now assumes 20% to 25% annual inflation. This may remain a 2022 artifact, but one has to at least allow for the possibility that tightness in the oilfield services market may persist for longer. Unlike the pricing realizations, this isn’t a problem specific to Coterra either. However, valuations should still account for it.
Another point to consider is that, similarly to others, Coterra is exploiting a depletable resource. Without additional technological breakthroughs, the marginal cost of future production should naturally rise. Here is for example, an excerpt from the EIA’s latest drilling productivity report for Appalachia:
Energy Information Administration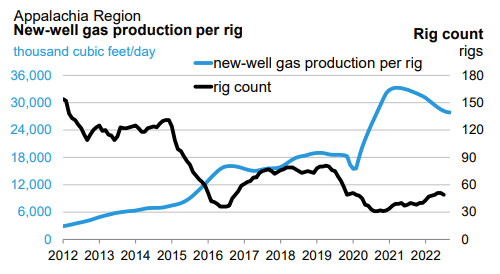
After the abnormal rise due to operators cannibalizing their drilled-but-uncompleted wells during COVID, productivity it is on the decline again. It remains to be seen where we will end up compared to 2019, but the chart suggests in 2019 productivity was already plateauing.
I also examined some more company specific data from ShaleProfile for the Marcellus:
Novi / Shaleprofile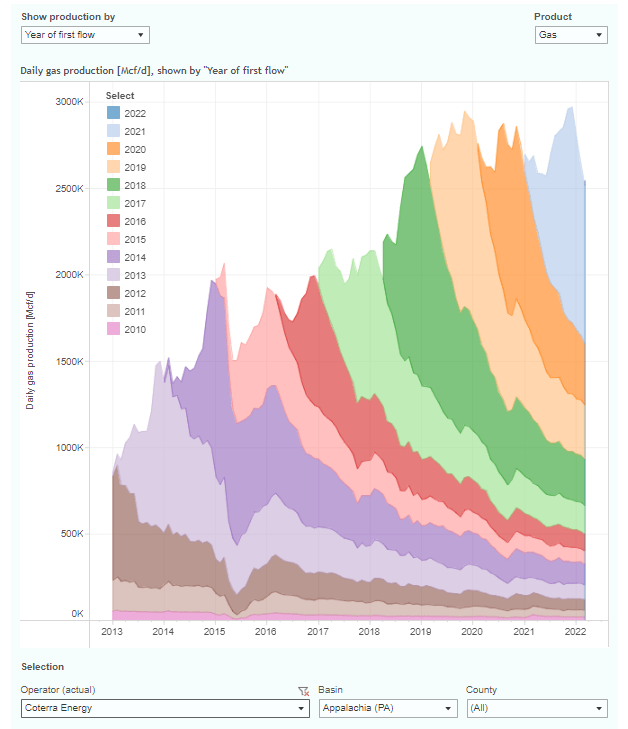
In the more recent years, the production decline over the first year of the new wells appear to be steepening. Looking at total production divided over total wells in place, it appears that 2019 was the most recent peak year, with slight declines following since then.
These are of course circumstantial observations as only Coterra knows what it can expect from its remaining inventory. However, what bothers me a bit is that while other companies are more transparent about their years of remaining inventory, as well as the assumptions under which it is economical, Coterra appears so far be silent. See, for example, a chart from Range Resources’ presentation:
Range Resources Presentation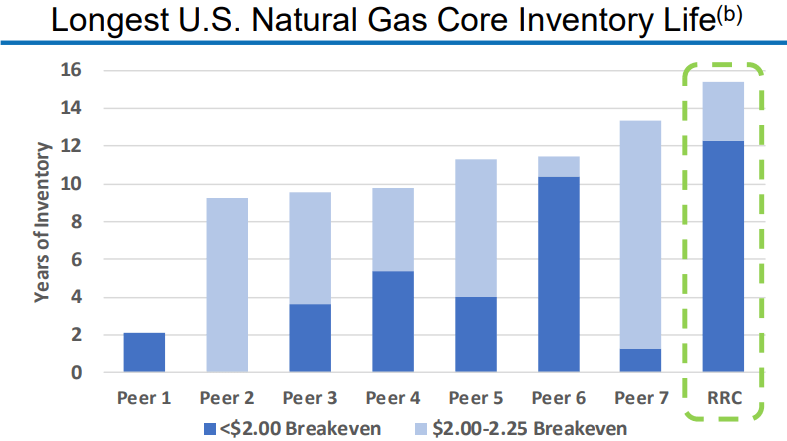
The combined Coterra company is of course less than a year old, so let’s hope we are going to see more detail in their future presentations and guidance.
The case for American LNG
The geopolitical issues in Europe will likely provide robust support for U.S. natural gas for a while. As of the time of writing, the January 2024 Dutch TTF natural gas contract was at about $63/mmbtu, after briefly going above $100/mmbtu. Ultimately, it doesn’t matter if European gas is at $100, $60 or even just $25. Liquefaction costs are probably about $3/mmbtu on average and regasification is less than $1, so the arbitrage between U.S. and European gas prices will persist.
The constraint is of course our limited export infrastructure. However, the International Gas Union projects that global liquefaction capacity will increase from 500 mtpa to over 900 mtpa by 2027:
International Gas Union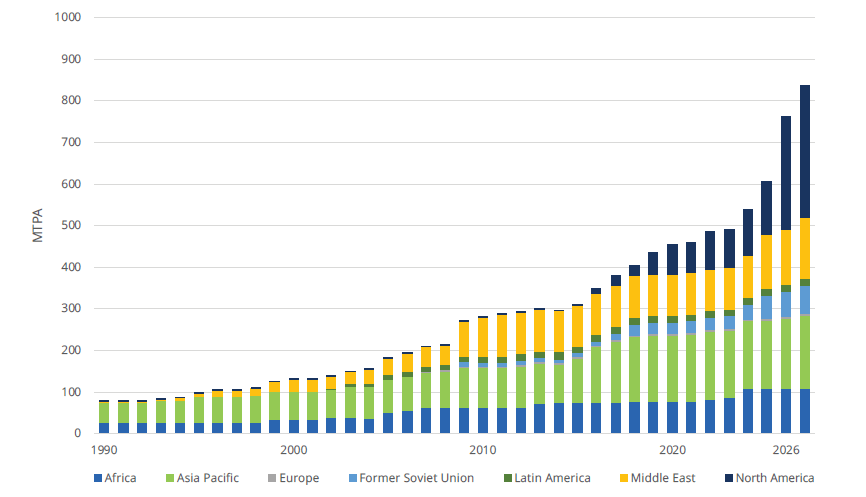
Most of it, as the chart shows, will come from North America. Ignoring the Freeport LNG outage, the U.S. seems to export about 11-12% of its domestic gas production via LNG. By 2027 this could maybe be 15-20% if production remains steady.
The long-term trend for U.S. gas producers is positive and at this point I doubt we will see $2 or $3 gas soon. However, whether the long-term equilibrium price will settle at $5-6 or at $9-10 makes a big difference for the valuation of companies like Coterra.
Shareholder returns
One positive for Coterra has been its generous cash return policy, mostly through a variable dividend and buybacks:
- 80% of FCF returned to shareholders in Q2
- base plus variable dividend at combined 9% annual yield
- repurchased $303 million worth of shares
Investors have shown a preference for oil and gas companies that are transparent about their cash return strategy. However, both the variable dividend and the buyback targets are defined relatively to FCF. So the main question remains if FCF projections should be based on $9-10 or $5-6 natural gas.
Conclusion
Coterra Energy is a nice way to get exposure to the U.S. natural gas prices. The company is weighted much more toward dry gas than oil or liquids and has a light hedge book.
However, the company’s valuation is not really cheap when looking at the 2023 and beyond natural gas pricing implied by futures markets. Coterra only appears cheap if we have reasons to believe that the $9-$10/mmbtu gas pricing will stay around for the 2020s.
Be the first to comment