


Joe Raedle/Getty Images News
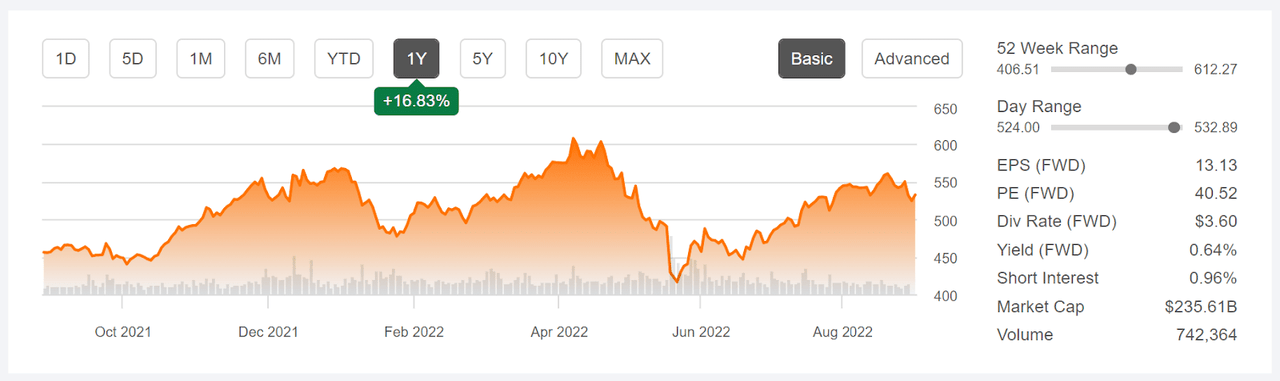
Costco (NASDAQ:COST) shares have rallied over the past year, with a return of 19.1%, as compared to -9.2% for Walmart (WMT), -3.4% for discount stores overall (as categorized by Morningstar) and -7.9% for the S&P 500 (SPY). COST is currently trading at about 12.7% below the 12-month high closing price of $608.05 on April 7th.
Seeking Alpha
12-Month price history and basic statistics for COST above.
COST is widely admired and the most recent earnings report is a great example of why this is the case. For FY Q3 results, reported on May 26th, EPS beat expectations and came in higher than for Q3 of last year. Operating income for Q3 was up 8% and pre-tax income was up 11% YoY. Membership renewal rates were also at all-time highs. Simply put, Costco has managed the inflationary environment masterfully. The consensus outlook is for continuing earnings growth, with FY Q4 EPS expected to come in 36% higher than Q3 and 6% above Q4 of last year.
ETrade
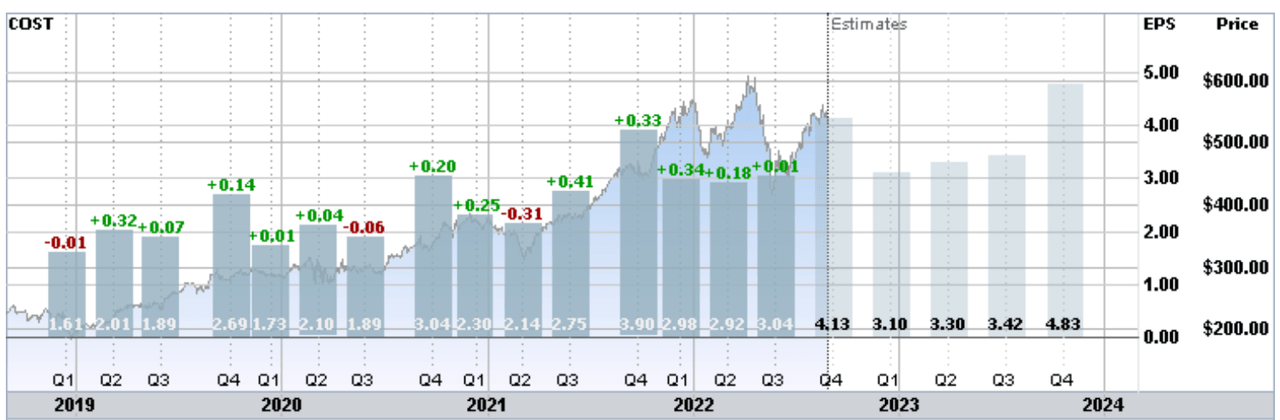
Historical (4 years) and estimated future quarterly EPS for COST above. Green (red) values are amounts by which EPS beat (missed) expectations
The market has priced COST to reflect the company’s impressive and consistent performance and this is where the challenge comes in for investors. Even acknowledging that discount retailers should perform well relative to higher-priced alternatives with rising inflation, as well as COST’s growing e-commerce business (which supports a higher valuation), COST looks expensive. COST’s trailing and forward P/E is much higher than WMT’s values, for example. Even allowing for Costco’s best-in-class status, the spread is high. Indeed, COST is trading at a substantial premium to a number of major tech firms. Perhaps investors can take some solace from the fact that COST is still much cheaper than Amazon.
|
Company |
TTM P/E (GAAP) |
Forward P/E (GAAP) |
|
Costco (COST) |
41.9 |
40.6 |
|
Apple (AAPL) |
27.1 |
26.8 |
|
Alphabet (GOOG) |
20.5 |
21.3 |
|
Amazon (AMZN) |
116.0 |
2,901.7 |
|
Microsoft (MSFT) |
27.8 |
26.5 |
|
Walmart (WMT) |
26.3 |
24.5 |
Trailing 12-month (TTM) and forward P/E ratios for Costco vs. a selection of other stocks above.
The fundamental dilemma is that Costco is a wonderful company that is trading at a substantial premium, with a P/E that is close to 10-year highs.
I last wrote about COST on December 29, 2021, at which time I maintained a neutral rating on the stock. At that time, COST was trading at $561.35. Since this post, COST has returned -5.4% (including dividends) vs. -14.5% for the S&P 500. For this analysis, COST was trading at a TTM P/E of 47.4 and valuation was the main concern. The Wall Street consensus rating for COST was bullish, but the consensus 12-month price target was slightly below the share price. Along with fundamentals and the Wall Street consensus outlook, I also consider the forward view implied by the prices of call and put options on a stock, the market-implied outlook. In late December of 2021, the market-implied outlook to the middle of 2022 was slightly bullish, but the outlook to January of 2023 was slightly bearish.
For readers who are unfamiliar with the market-implied outlook, a brief explanation is needed. The price of an option on a stock is largely determined by the market’s consensus estimate of the probability that the stock price will rise above (call option) or fall below (put option) a specific level (the option strike price) between now and when the option expires. By analyzing the prices of call and put options at a range of strike prices, all with the same expiration date, it is possible to calculate a probabilistic price forecast that reconciles the options prices. This is the market-implied outlook. For a deeper explanation and background, I recommend this monograph published by the CFA Institute.
Over the 8 months since my last analysis, COST’s valuation has fallen somewhat, but remains very high by historical standards. That said, Costco has turned in 2 solid quarters since then, showing remarkable resilience in a challenging high-inflation environment. I have calculated updated market-implied outlooks for COST and compared these to the current Wall Street consensus outlooks in revisiting my rating.
Wall Street Consensus Outlook for COST
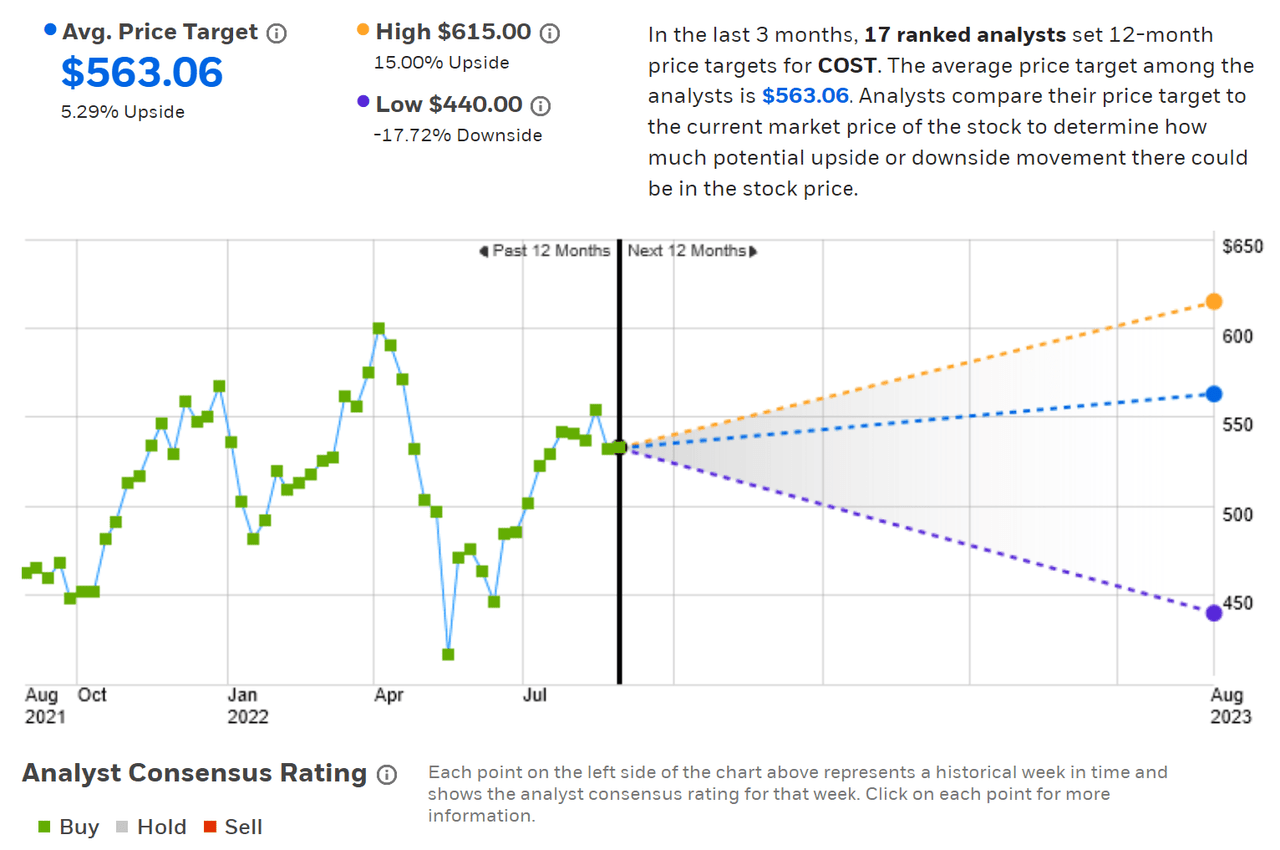
ETrade calculates the Wall Street consensus outlook for COST using price targets and ratings from 17 ranked analysts who have published their views over the past 3 months. The consensus rating is a buy, as it has been for all of the past year, and the consensus 12-month price target is 5.3% above the current share price. The consensus price target is slightly higher than it was at the end of 2021.
ETrade
Wall Street analyst consensus rating and 12-month price target for COST above.
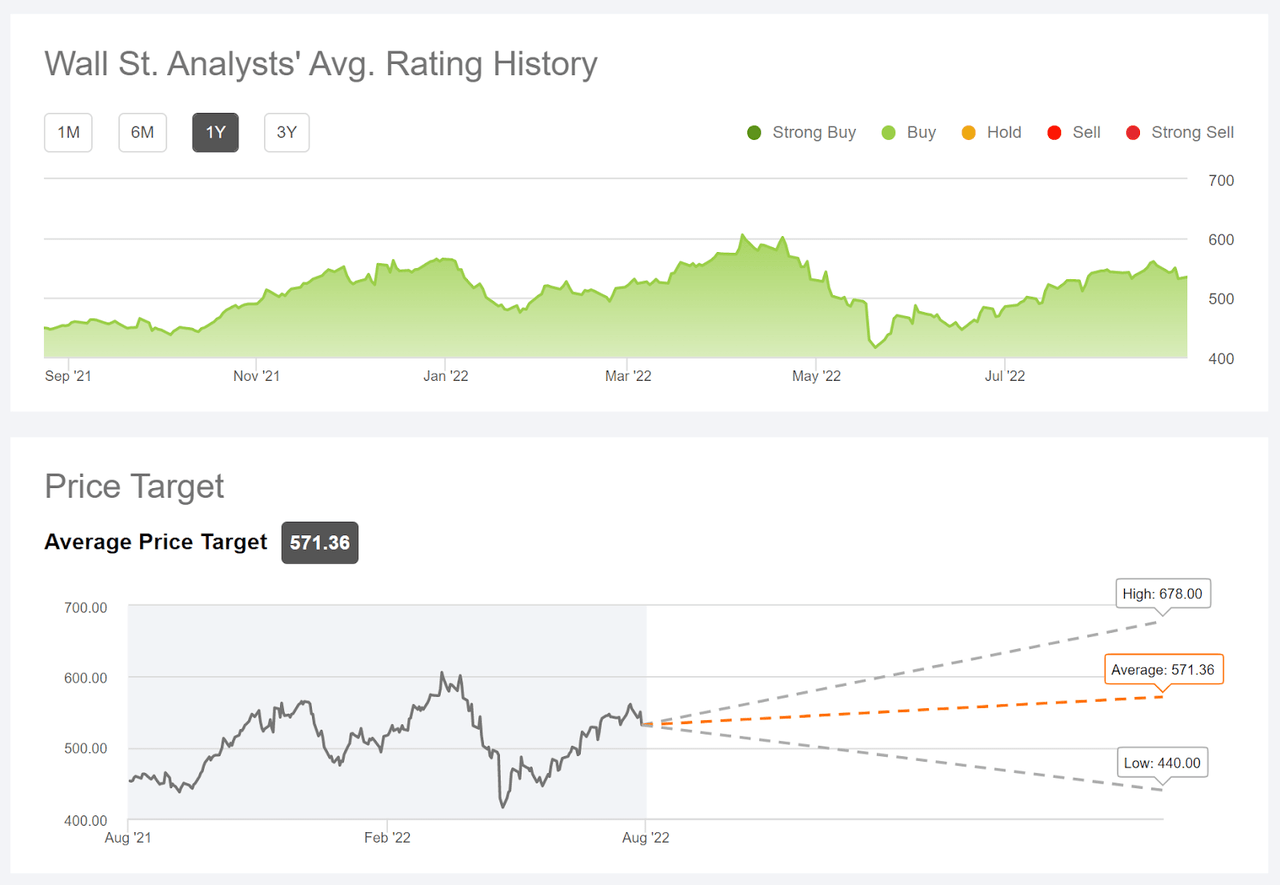
Seeking Alpha’s version of the Wall Street consensus outlook uses ratings and price targets issued by 33 analysts within the last 90 days. The consensus rating is a buy and the consensus 12-month price target is 6.8% above the current share price.
Seeking Alpha
Wall Street analyst consensus rating and 12-month price target for COST above.
COST is in an odd situation with regard to the prevailing analyst view. The consensus rating is a buy, but the 12-month price target is only 5% to 7% above the current share price. This is very little potential price appreciation for the expected volatility (more on this in the next section).
Market-Implied Outlook for Costco
I have calculated the market-implied outlook for COST for the 4.73-month period from now until January 20, 2023 and for the 9.6-month period from now until June 16, 2023, using the prices of call and put options that expire on each of these dates. I analyzed these 2 expiration dates to provide a view through the end of 2022 and to the middle of 2023.
The standard presentation of the market-implied outlook is a probability distribution of price return, with probability on the vertical axis and return on the horizontal.
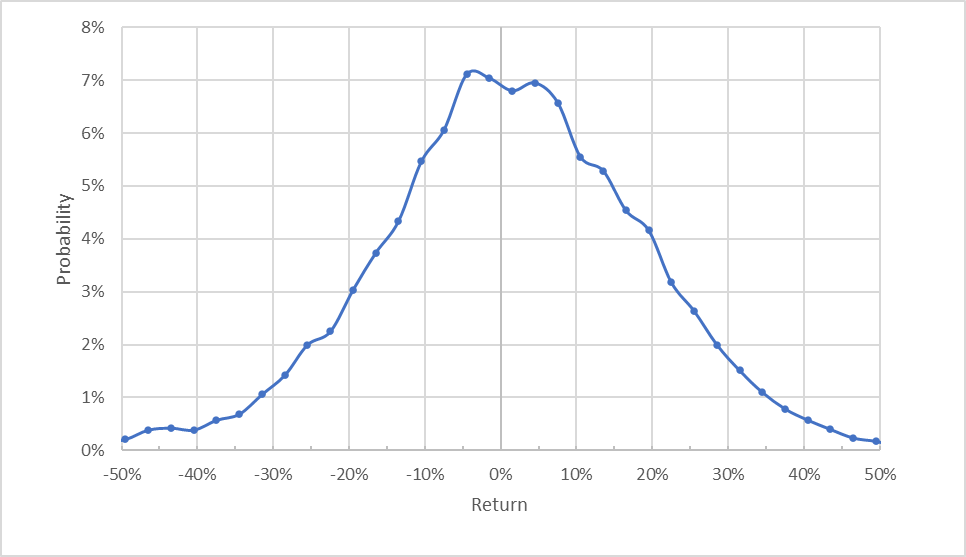
Geoff Considine
Market-implied price return probabilities for COST for the 4.7-month period from now until January 20, 2023 above.
The market-implied outlook to January 20, 2023 is generally symmetric, with comparable probabilities of positive and negative returns of the same magnitude. The expected volatility calculated from this distribution is 29.8% (annualized), slightly higher than the expected volatility at the end of 2021, 27.3%.
To make it easier to compare the relative probabilities of positive and negative returns, I rotate the negative return side of the distribution about the vertical axis (see chart below).
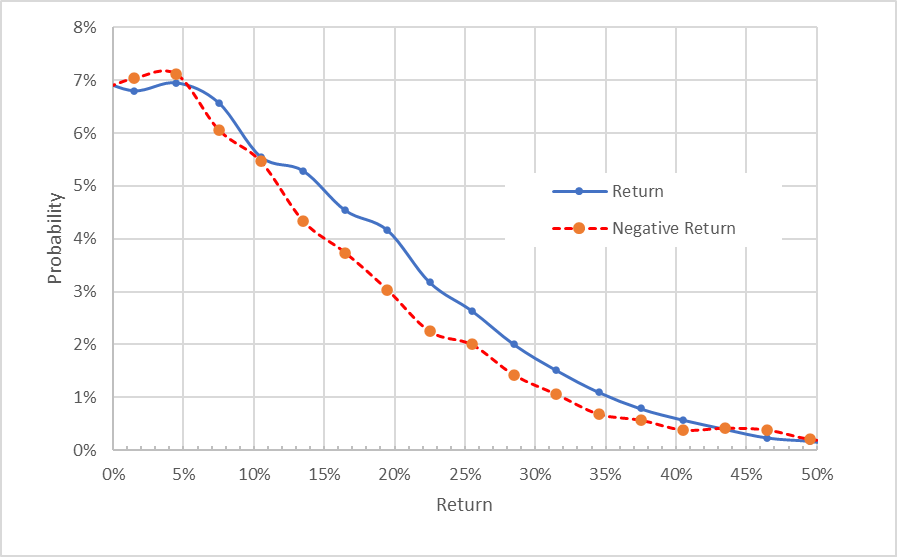
Geoff Considine
Market-implied price return probabilities for COST for the 4.7-month period from now until January 20, 2023, above. The negative return side of the distribution has been rotated about the vertical axis
This view shows that the probabilities of positive returns are consistently higher than the probabilities of negative returns of the same magnitudes (the solid blue line is at or above the dashed red line over almost all of the chart above). This is a bullish outlook.
Theory indicates that the market-implied outlook is expected to have a negative bias because investors, in aggregate, are risk-averse and thus tend to pay more than fair value for downside protection. There is no way to measure the magnitude of this bias, or whether it is even present, however. This potential bias reinforces the bullish interpretation of the market-implied outlook.
The market-implied outlook to June of 2023 is qualitatively similar to the shorter-term outlook, with a consistent bullish tilt. The expected volatility calculated from this outlook is 30.3%.

Geoff Considine
Market-implied price return probabilities for COST for the 9.6-month period from now until June 16, 2023. The negative return side of the distribution has been rotated about the vertical axis above.
The options expiring in January and June of 2023 tell a consistent story. The market-implied outlooks exhibit a consistent tilt favoring positive returns to early 2023 and to the middle of 2023. The expected volatility is stable over these two outlooks. These market-implied outlooks for COST are more bullish than the outlooks from the end of 2021.
Summary
Costco is a consistently strong performer and has managed to grow earnings over the past year, even with surging inflation and supply chain issues. The company has continued to push ecommerce forward, along with growing brick-and-mortar sales. Costco has impressed the market, such that the valuation is at a premium. The results for FY Q4, which will be announced on September 22nd, are expected to be robust. The Wall Street consensus outlook captures the dilemma for investors. The consensus rating is bullish but the consensus 12-month price target implies a modest expected total return of 6.7%. As a rule of thumb for a buy rating, I want to see an expected return that is at least ½ the expected volatility (about 30%). COST falls considerably short of this threshold. The market-implied outlooks for COST to early- and mid-2023 are bullish, however. While I have considerable qualms about buying into COST at the current high valuation, the company’s exceptional execution and results over the past year, along with the bullish Wall Street consensus and market-implied outlooks, convince me to upgrade COST to a buy rating.
Be the first to comment