

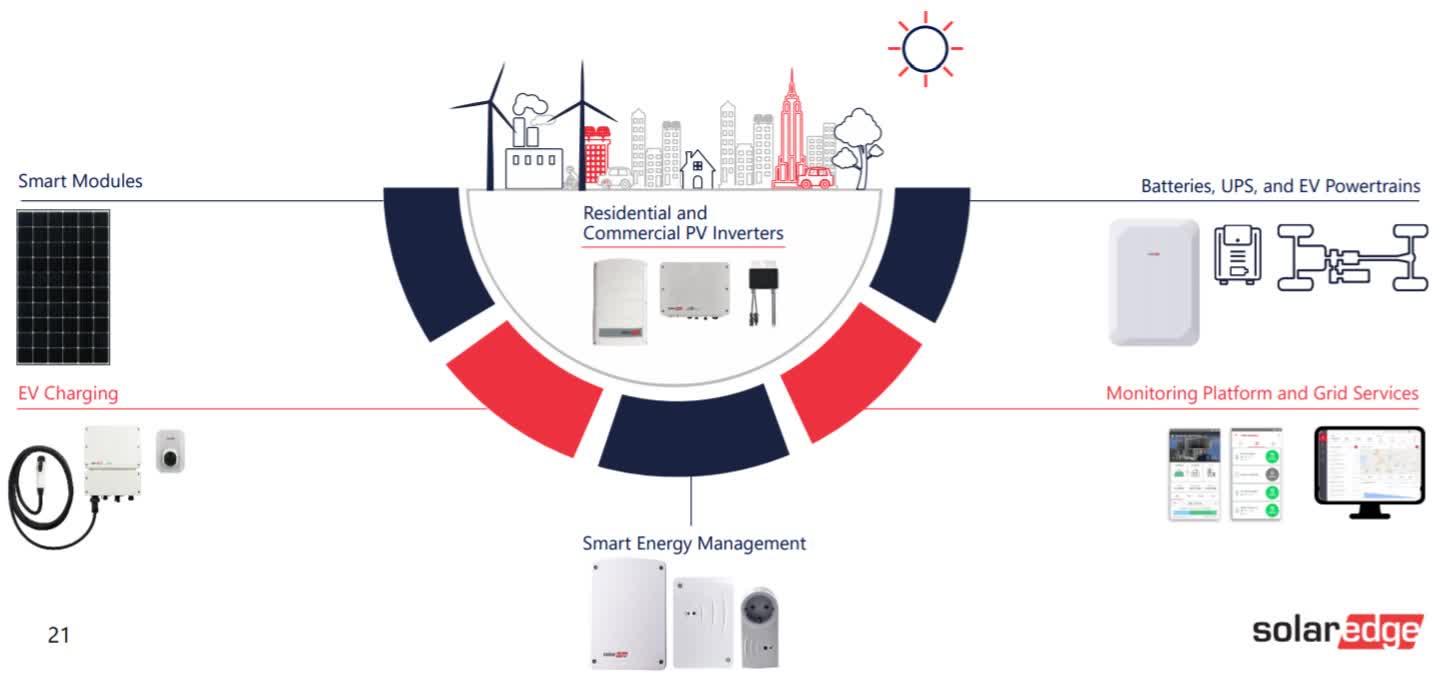
(SolarEdge Technologies’ broad product portfolio has helped the company grow at a CAGR of 35.4% during the past five years.)
Just six weeks into 2020, SolarEdge Technologies (SEDG) is already on pace to match last year’s spectacular gains. The stock’s rally accelerated after SolarEdge released fourth quarter 2019 earnings which resulted in an 11% following day surge. While the company’s headline results easily beat Wall Street expectations, some factors in its report indicate the high growth rates SolarEdge has experienced in the past few years is clearly decelerating. Even though SolarEdge shares have rallied almost 300% since the start of 2019, valuations are still very reasonable but investors need to take into consideration normalized earnings are not as high as the company’s reconciled non-GAAP results in the latest quarter.
Fourth Quarter 2019 Non-GAAP Vs. Normalized Earnings
For Q4 2019, SolarEdge posted $1.65 in non-GAAP EPS on $418.2 million in revenues. At the headline level, non-GAAP EPS was surpassed by $0.40 which represented a 32% upside surprise. Revenues however only beat analysts’ expectations by $4.4 million, or slightly over a 1% upside surprise. Normally, whenever there is such a wide gap in upside surprise between revenue and earnings, there are hidden factors within the report that produces a normalized figure somewhere in between.
The first factor is simple and obvious. In the fourth quarter of 2019, SolarEdge reported an $11.1 million net foreign exchange gain due to the Euro’s strength relative to the USD. Even though foreign exchange translations can work in both directions, it should be omitted from non-GAAP results due to its non-operational nature. Since major currencies are normally stable relative to each other over a longer period of time, net foreign exchange adjustments throughout the course of a year should be minimal. Although 2019 was an exception where the company’s pre-tax net income was negatively impacted by 6% compared to 1.7% in 2018, the average foreign exchange impact is far less than the 21.9% benefit recorded in the latest quarter. Foreign exchange gains accounted for $0.21 of the company’s $0.40 in non-GAAP EPS upside surprise.
Secondly, SolarEdge made an end of year adjustment to its warranty accrual expenses. According to gross margin statements detailed in its fourth quarter earnings conference call, gross margin was positively impacted by about 1.5% or $6 million. Total warranty obligations also only increased by $1.21 million sequentially and reversed the high reserve ratios posted in previous quarters which was one concern I noted investors should keep an eye on in my 2020 solar preview.
| 2017 | 2018 | Q1-Q3 2019 | Q3 2019 | Q4 2019 | |
| Revenues | $607.05 | $937.24 | $1,007.44 | $410.56 | $418.22 |
| Warranty Reserve Increase | $20.44 | $43.02 | $49.53 | $20.72 | $1.21 |
| Warranty Reserve / Revenues | 3.37% | 4.59% | 4.92% | 5.05% | 0.29% |
(Data compiled from SolarEdge’s SEC quarterly and annual reports. Dollar figures in millions.)
While this is a positive and should dispel concerns over recent claims on social media regarding higher failure rates for SolarEdge’s products, the net effect boosted the company’s non-GAAP EPS by $0.11. In response to an analyst question, management stated that part of the expected sequential decline in gross margin in Q1 2020 was due to the non-recurring nature of this warranty adjustment.
So we basically enjoyed a one-time benefit, which means that once you normalize the gross margins the gross margins for Q4 were slightly lower again without this one-time adjustment.
Without these two positive contributing factors to SolarEdge’s non-GAAP EPS, the Q4 2019 upside surprise would have only been approximately $0.09 or 7.2%. Of course, it is still a very clean beat, but just not by the $0.40 figure some headlines indicated. It also explains why Wall Street non-GAAP EPS expectations for 2020 were only raised by 13% from $4.86 to $5.49 following the company’s fourth quarter earnings report instead numbers closer to the 32% headline blowout.
Competition And Revenue Growth
The primary reason for my cautious view on SolarEdge has to do with potential increased competition limiting the company’s market share expansion. As detailed in a prior SolarEdge article, the company’s high revenue growth rates in previous years came at the expense of several competitors. 2019 was no different as SolarEdge posted an annual revenue growth rate that exceeded 50% vs. the 17.5% increase in global solar installations last year.
However recent revenue trends show SolarEdge’s growth rates are slowing. In the latest reported quarter, the company’s solar revenues were almost flat in one of the strongest seasonal quarters for the industry. In contrast, fourth quarter 2018 revenues were up 11% sequentially. SolarEdge did guide for sequential revenue growth in the first quarter of 2020, but with the help of $75 million in forward-pulling first half safe harbor sales. If split equally between the first and second quarter, sequential revenue growth in the US excluding safe harbor could decline more than its main US competitor Enphase Energy (ENPH).
| Q4 2019 Revenues Excluding Safe Harbor | Q1 2020 EST Revenues Excluding Safe Harbor | EST Sequential Change | |
| SolarEdge | $236.60 | $211.80 | -10.48% |
| Enphase | $156.80 | $144.10 | -8.10% |
(Data compiled from SolarEdge’s Q4 2019 earnings and Enphase’s Q4 2019 earnings. Q1 2020 revenue estimates based on 1) each company’s midpoint guidance, 2) constant US geographic exposure, and 3) $37.5 million in safe harbor sales for SolarEdge. US revenue figures in millions.)
The difference may seem small but when compounded over the course of a year can result in meaningful market share loss for SolarEdge. The chart below shows how the company’s power-optimizer shipments declined sequentially in the latest quarter in contrast to Enphase’s continued shipment rise of micro-inverters. While power-optimizers and micro-inverters are different products, they are competing products such that the use of one excludes the use of the other. The cumulative effects of these trend dynamics have resulted in analysts projecting a lower revenue growth rate for 2020 at 28% compared to 52% last year.
 (Data compiled from SolarEdge’s Q4 2019 operational metrics sheet and Enphase’s quarterly reports. Shipment figures in millions of units.)
SolarEdge does already generate revenue from non-solar products which mainly consists of battery products. Since this segment generated non-GAAP operational losses in 2019 as the table below shows, investors should not be too quick to include its revenue contribution as a positive factor for the company’s earnings potential. Although the low gross margin posted in the fourth quarter included end of year write-downs, non-solar revenues would need to more than double to reach operational non-GAAP break even based on fiscal 2019 full year metrics.
Operating Metrics For SolarEdge’s Non-Solar Segment
| Q1 2019 | Q2 2019 | Q3 2019 | Q4 2019 | FY 2019 | |
| Revenues | $18.80 | $18.30 | $22.80 | $29.20 | $89.10 |
| Gross Margin | 13.10% | 14.90% | 29.50% | 4.90% | 14.98% |
| Gross Profit | $2.46 | $2.73 | $6.73 | $1.43 | $13.35 |
| Operating Expenses | $5.26 | $7.93 | $7.03 | $12.28 | $32.50 |
(Data compiled from SolarEdge’s Q2 2019 and Q4 2019 earnings conference calls. Dollar figures in millions.)
Final Thoughts
Some may feel I am negative on SolarEdge’s outlook based on the content presented above. This is not the case and as I outlined in my 2020 solar preview article, I noted SolarEdge’s competitive position within the solar sector should lead to growth rates at least in line with the industry. However, micro-level changes that have emerged in the past two quarters indicate SolarEdge may be closer to a short-term ceiling in its business relative to other US-listed solar equipment providers. Thus, the goal of this article is to bring into attention these subtle operating dynamic shifts to help investors identify potential red flags. In my opinion, it is just as important to recognize early warning signs and know when to potentially sell than to just know all the positive reasons to buy or remain long.
For example, in the same annual preview article, I highlighted negative trends in upstream component pricing which could affect Jinko Solar’s (JKS) operating metrics in the near term. Investors could then use this information to follow future upstream component pricing trends to see if it reverses or continues and potentially affects Jinko Solar’s earnings to the downside. However, despite this concern, I still ranked Jinko Solar above average due to its single-digit earnings multiple. Thus, my performance ranking not only considers the direction of potential earnings surprises, but also the stock’s relative market valuation.
The same applies here for SolarEdge. There are enough signals that if recent trends continue, the company may not be able to sustain market share gains posted in recent years. All this means is 50% plus annual revenue growth may come down to the industry average which has ranged between 15-25% in recent years. With the stock trading in the mid-twenties current year P/E multiple even after its massive 300% gain in the past five quarters, SolarEdge is far from overpriced and arguably cheap in a market where money-losing momentum stocks trade at the same multiple to sales.
Lastly, there are indications the company has been losing some residential market share to its main competitor Enphase, especially in the US market. This may continue outside the US after Enphase signaled it intends to double its European revenues in 2020. If SolarEdge cannot continue to make gains in the commercial segment as reported in the latest quarter, there could be potential for below industry growth. Even though 20x forward earnings is not expensive relative to the overall stock market, it is the second highest normalized forward multiple among the seven largest US-listed solar equipment manufacturers. Relative valuations as well as SolarEdge’s operating trends detailed above should be the key factors investors should continually weigh moving forward.
Disclosure: I am/we are long ENPH. I wrote this article myself, and it expresses my own opinions. I am not receiving compensation for it (other than from Seeking Alpha). I have no business relationship with any company whose stock is mentioned in this article.
Be the first to comment