

sololos
Introduction
Constellation Software (OTCPK:CNSWF) (TSX:CSU:CA) posted strong results last Thursday. Revenue was up quite substantially, and so was net income. Cash flows were the lowlight, but we need quite a bit of context to understand what’s really happening there. As is always the case for Constellation, pretty much all numbers need some explanation and the ability to zoom out to understand them. This article’s goal is to simplify this for you.
Without further ado, let’s start by looking at the market’s reaction to earnings.
The market’s reaction
Constellation’s stock had a very similar reaction to earnings as last quarter. Initially, the stock dropped and opened down almost 4%. However, it recovered quite well during the day despite indexes being in the red:
YCharts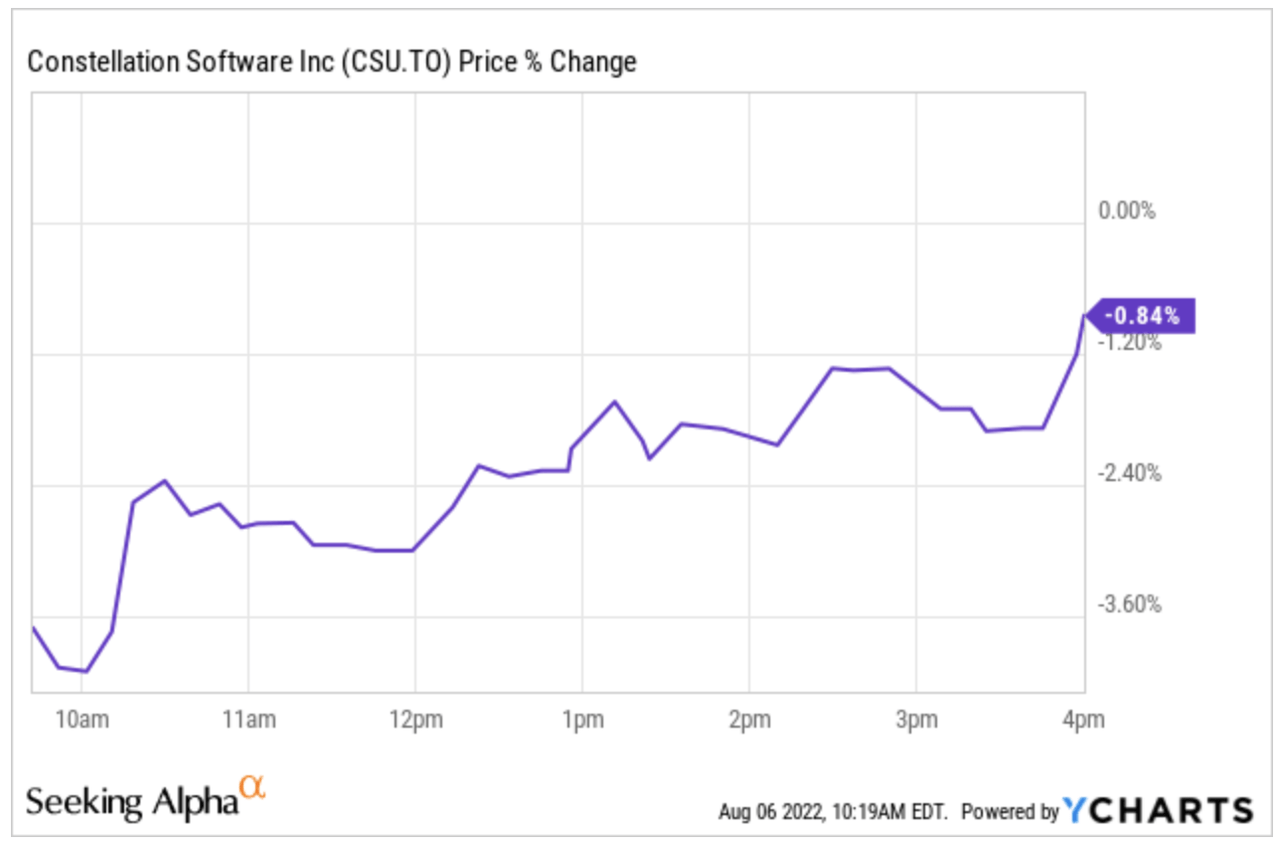
We wouldn’t take the market’s reaction as indicative of anything. This holds true for any position, but more so when it comes to Constellation because its results can’t be interpreted as fast as those of other companies.
If we zoom out, we can see that Constellation’s stock has recovered quite a bit from the lows, and it’s now only 10% off its all-time high:
YCharts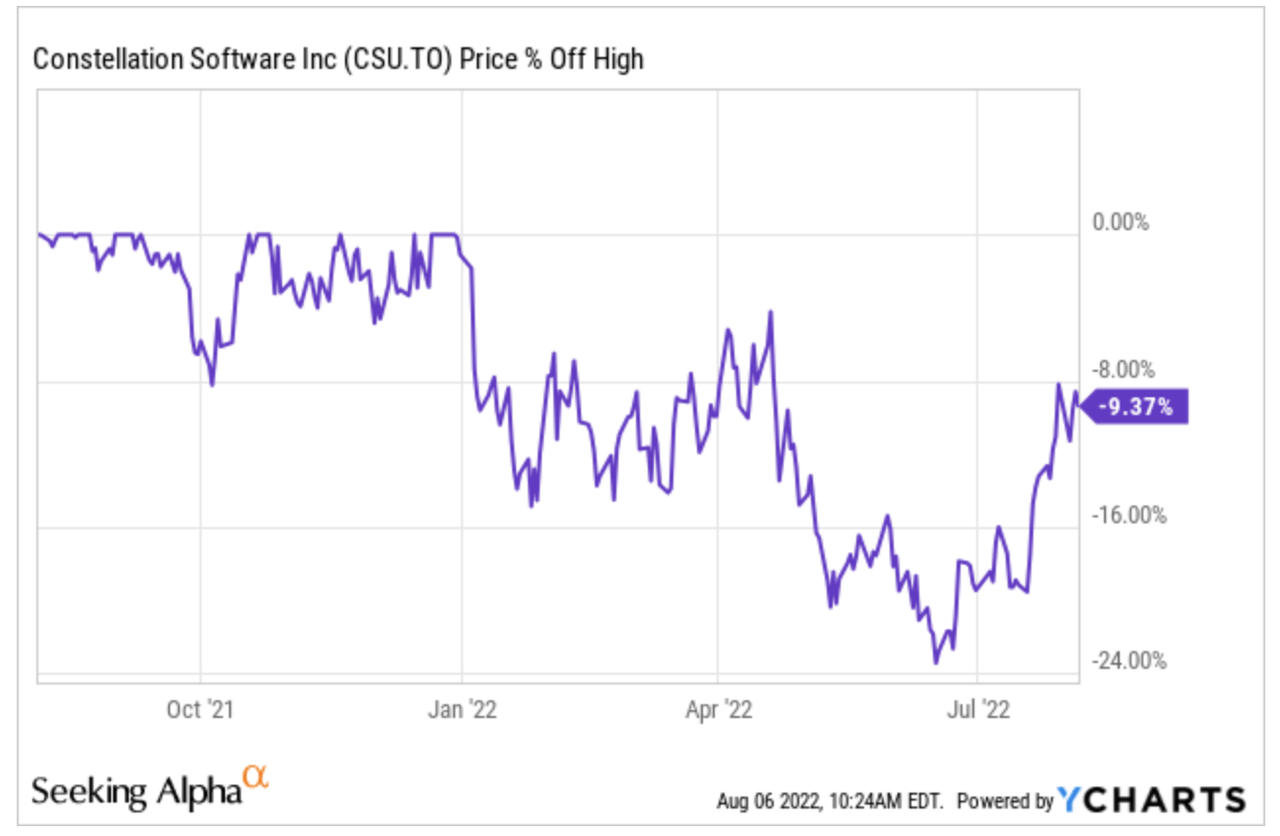
Up to now, Constellation’s stock seems to live up to its low volatility history. We hope it can also live up to its history of above-average returns.
Let’s take a look at the numbers!
The numbers
The headline numbers were excellent. However, as is always the case for Constellation, there are some metrics that we must dig deeper into to really understand them. For Q2, this metric was cash flows, which showed substantial decreases from the comparable period. We’ll take care of that later. First, we look at the headline numbers.
Revenue grew 30% Y/Y to $1.62 billion, and net income increased 73% Y/Y to $134 million (consolidated). However, net income was not fully comparable because Q2 2021 carried a non-recurring expense from the redeemable preferred shares both for Topicus and Constellation:
Made by Best Anchor Stocks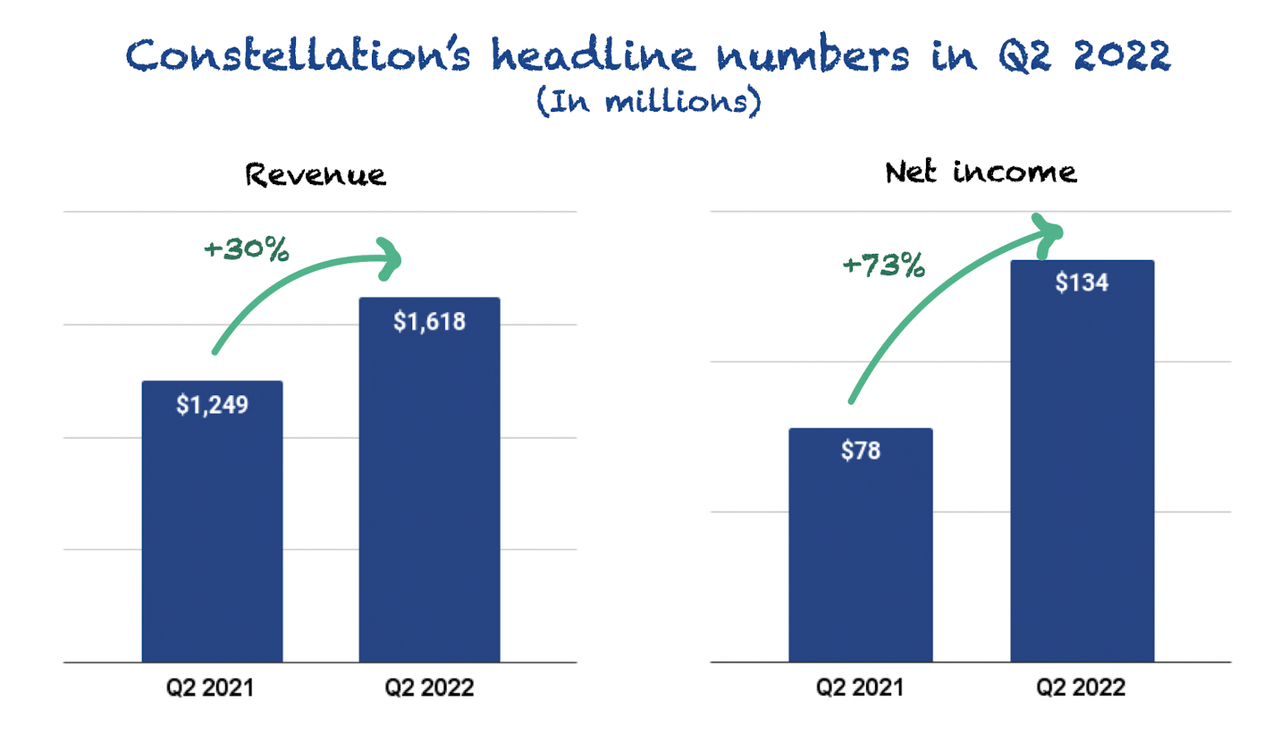
If we take out Topicus’ non-controlling interest (‘NCI’), net income grew 43% to $126 million. However, this is still not comparable because the expense from the redeemable preferred shares occurred at the Constellation and the Topicus level in the comparable quarter. I think you already start to see why you need context here.
Revenue accelerated quite significantly and illustrated once again why we should be cautious in rushing to conclusions based on quarterly numbers for Constellation or Topicus. Most revenue growth corresponds to acquisitions, which highly correlates to capital deployment.
Let’s dig a bit deeper into revenue.
Digging deeper into revenue
Constellation has two sources of revenue growth: acquisitions and organic growth. Once again, acquisitions were responsible for most of this quarter’s revenue growth.
Organic growth suffered increased headwinds from foreign currency rates and came in at -2%. However, when adjusted for these headwinds, the company posted organic growth of 2%:
Made by Best Anchor Stocks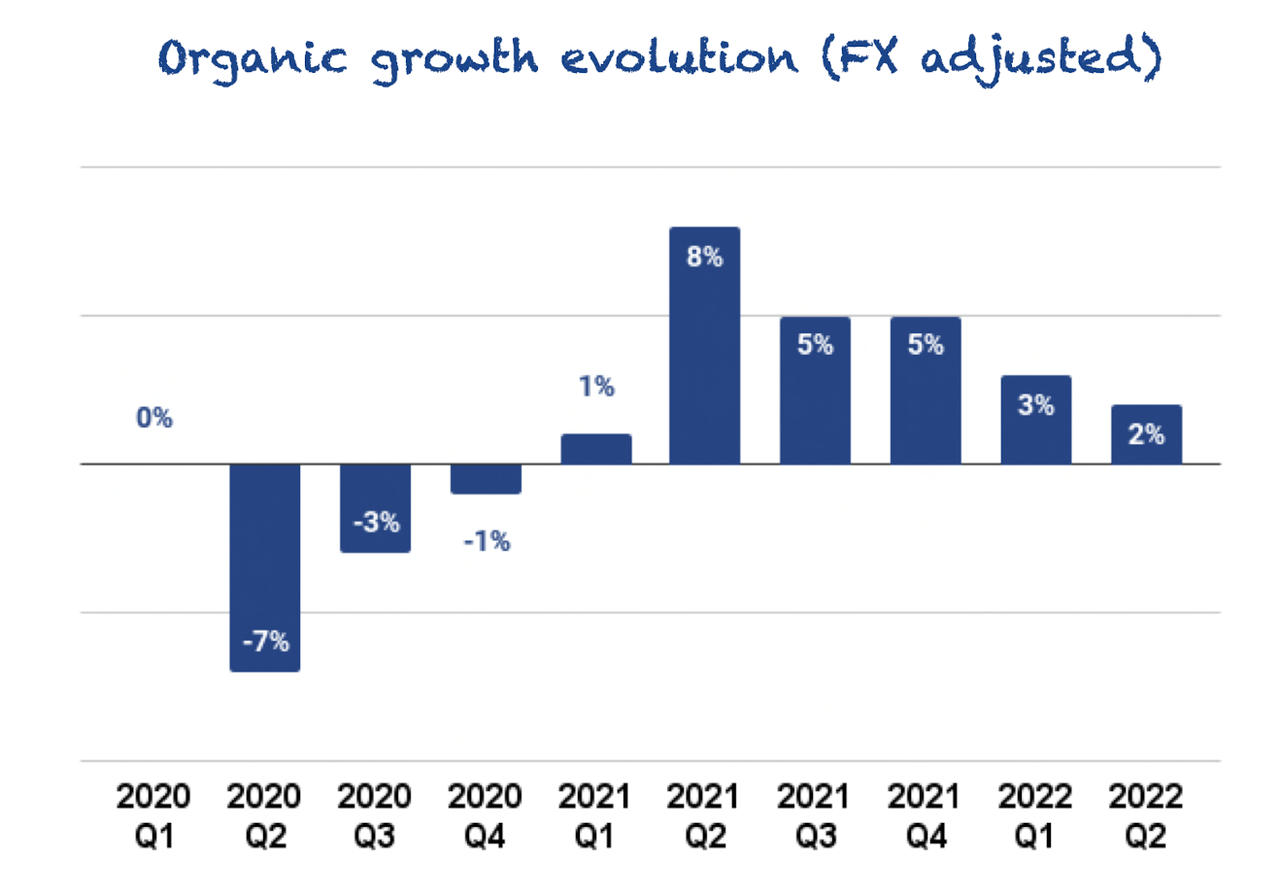
Q2 marked the second consecutive sequential decline in organic growth. While this might seem worrying at first sight, we must have all the context before coming to conclusions.
It’s pretty evident that Constellation’s management preferred revenue source is maintenance and recurring. They have been growing this revenue stream throughout the years, and now, with 70.9%, it makes up a considerable portion of the company’s total revenue:
Made by Best Anchor Stocks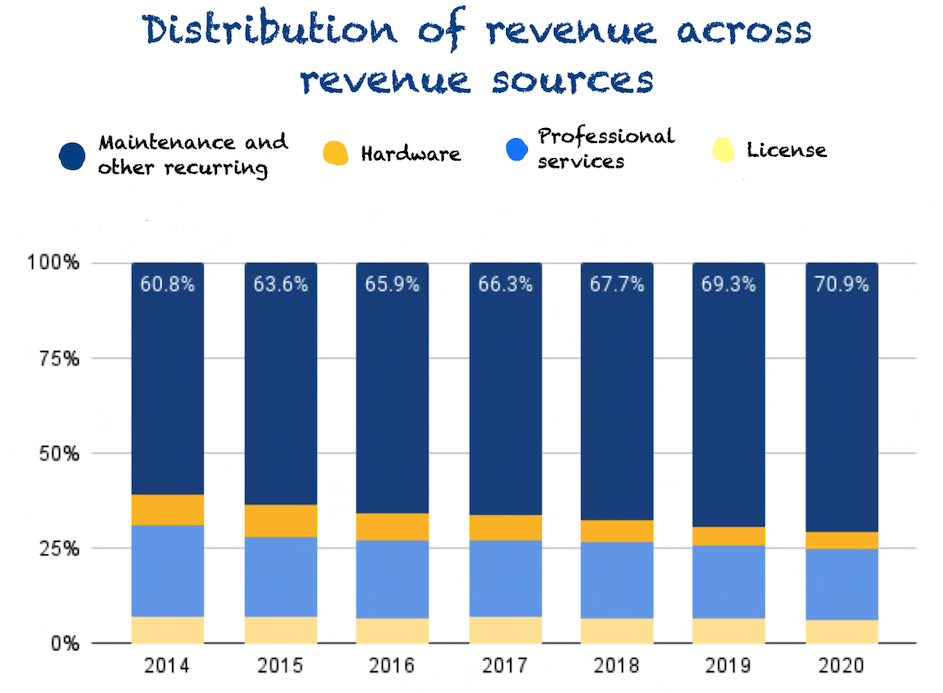
Organic growth for this revenue stream has been much more robust than the headline organic growth metric portrays. Maintenance and recurring organic revenue grew 6% Y/Y (FX adjusted) and outpaced the organic growth of the rest of the revenue streams. In fact, it was the only revenue stream that enjoyed positive FX-adjusted organic growth during the quarter:
Made by Best Anchor Stocks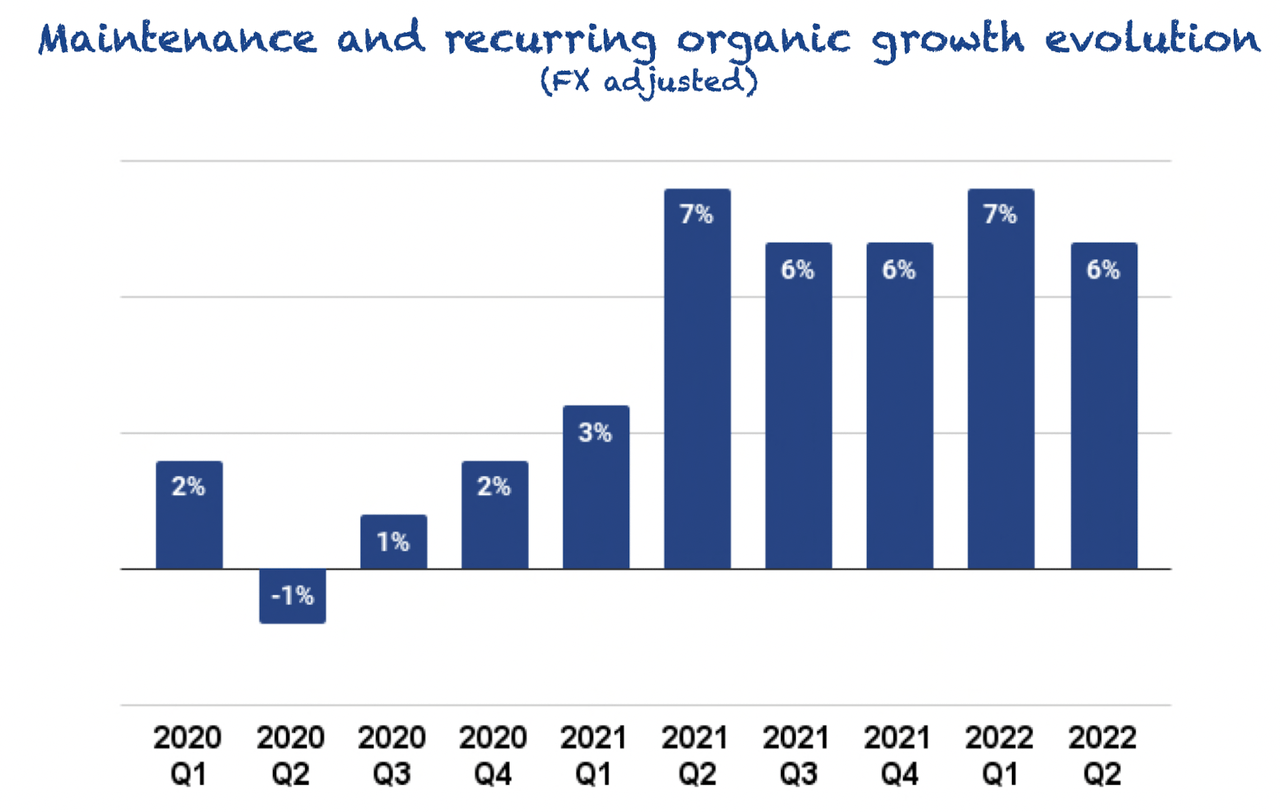
It has grown for the last 8 quarters and has remained somewhat stable in the last 5. As maintenance and recurring makes a more significant portion of overall revenue, maintaining a high organic growth rate in this stream will have a more substantial impact on the company.
We already saw how management is growing maintenance and recurring as a portion of total revenue, and this quarter was no exception, with this stream growing faster than total revenue:
Made by Best Anchor Stocks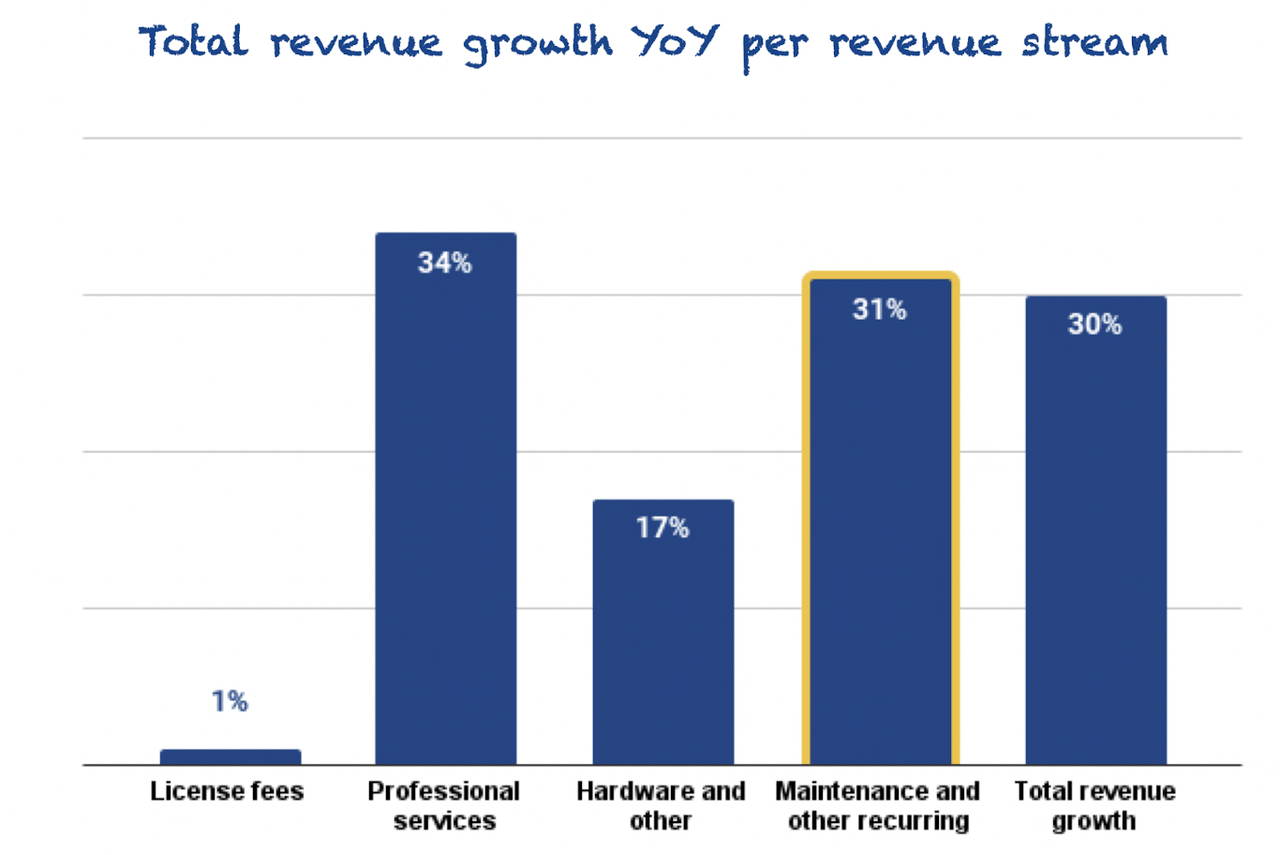
It’s also still early to analyze what role Topicus is playing in accelerating organic growth at the Constellation level, but signs are encouraging. For example, this quarter, Topicus added an entire point to maintenance and recurring organic growth (FX adjusted):
Constellation MD&A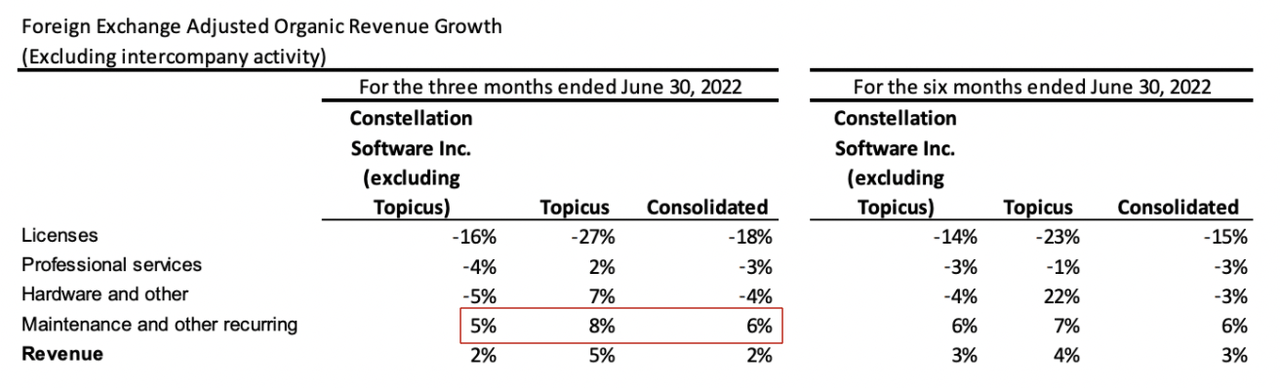
We believe there’s still room for Constellation to improve its organic growth practices, but it’s great to see Topicus already contributing. However, organic growth suffered a headwind during the quarter, from Altera.
Altera is what you might know as Allscripts, the largest acquisition of Constellation’s history. It had the opposite effect than Topicus and shaved off one entire point of maintenance and recurring organic growth and total organic growth:
Constellation MD&A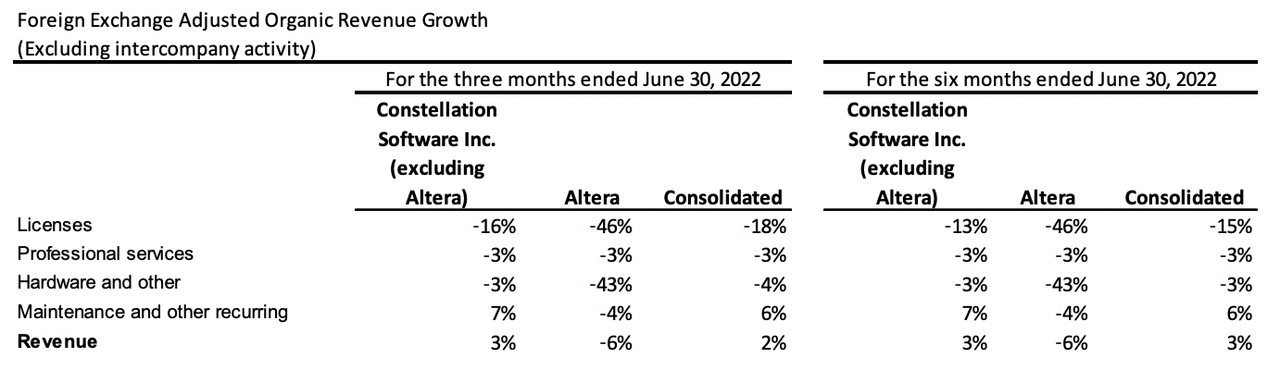
As you can see, Altera is shrinking. However, it’s still early after the acquisition to conclude anything from these numbers because Constellation hasn’t had time to turn the business around or exploit synergies with its other VMS businesses.
We also got to see Altera’s financials since the date the transaction closed (in May):
Constellation MD&A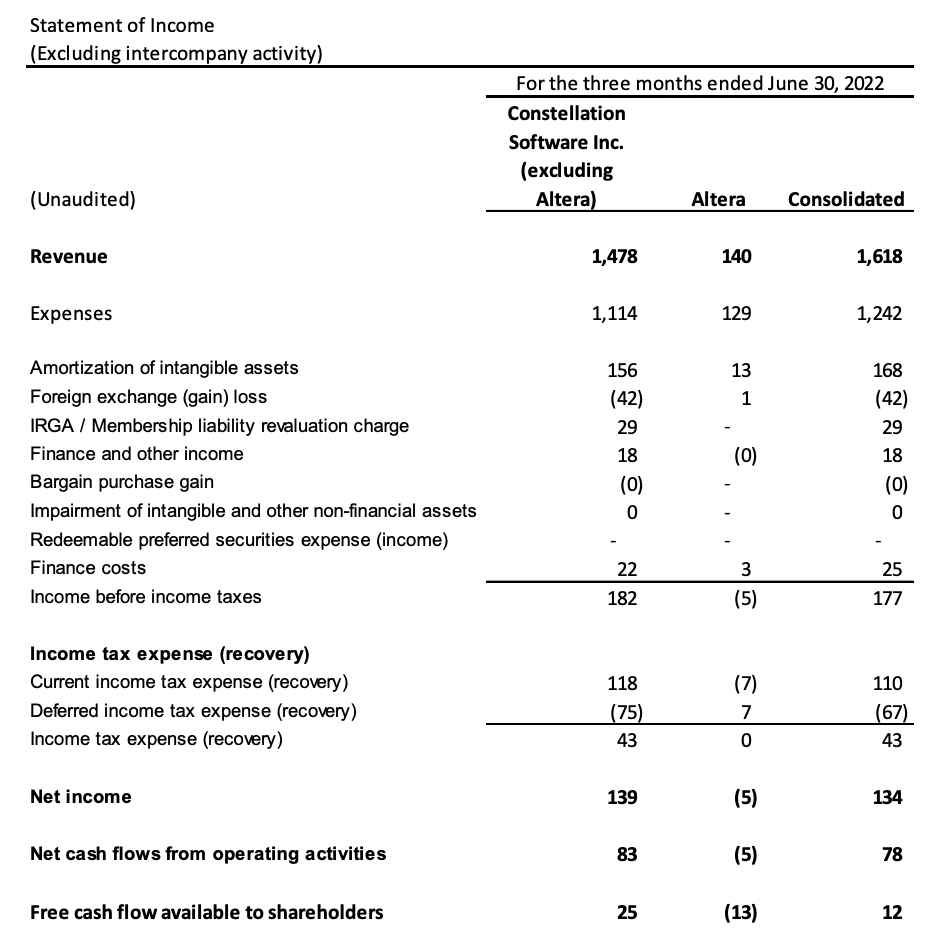
The acquisition mainly penalized profitability-related metrics: operating income, net income, and cash flows. However, if we do some quick calculations, we can see that Constellation didn’t pay a high price for it. Altera is generating around $840 million in revenue, and Constellation paid $725 million, so 0.86x sales. Of course, the business doesn’t look very healthy now, which is why Constellation was able to purchase it so cheaply. We’ll have to wait and see how it plays out over the next years, but Constellation has a great track record when it comes to these types of companies.
Looking at the expense side
Operating expenses grew faster (+36% Y/Y) than revenue, so there was margin contraction with regard to Q2 2021:
Made by Best Anchor Stocks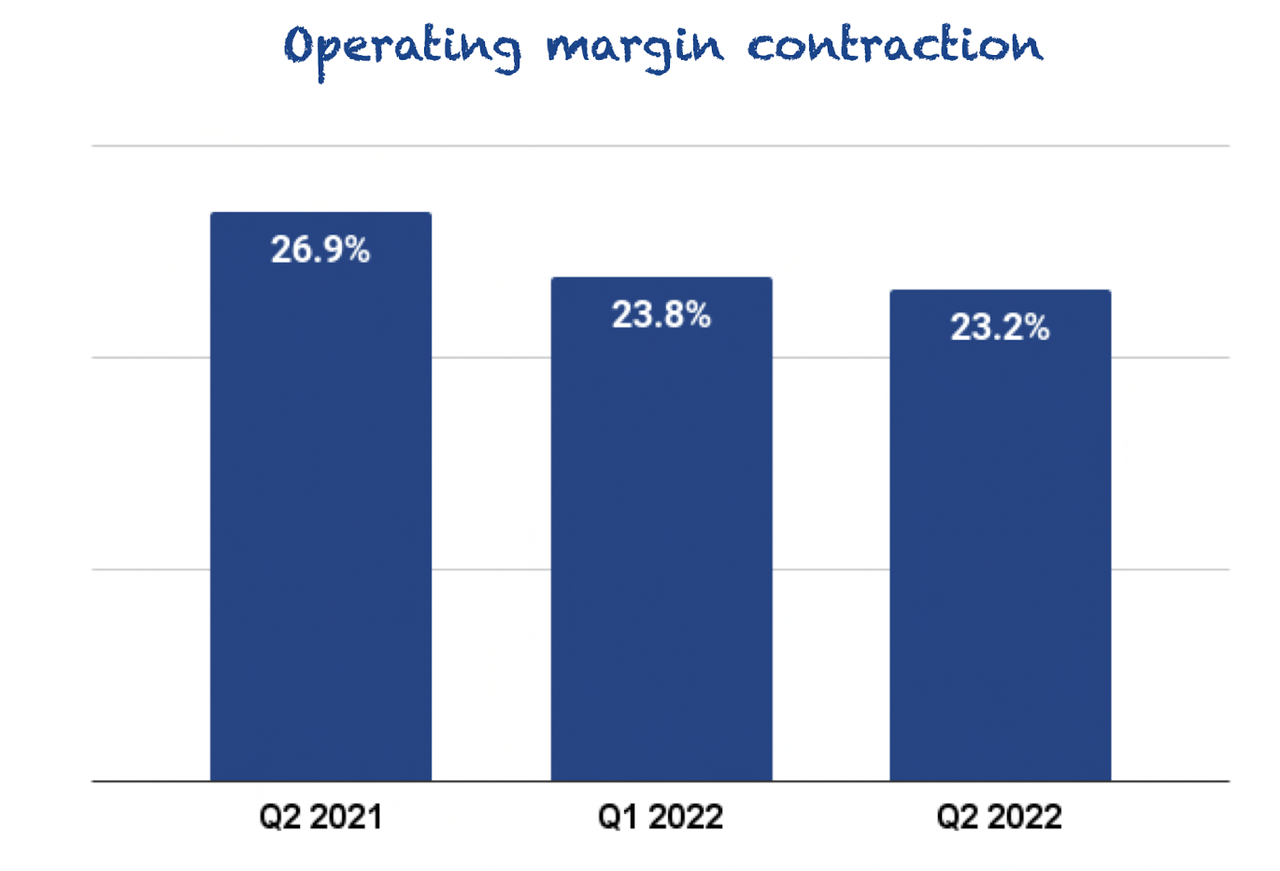
As we saw before, revenue took a hit from foreign exchange rates, so was this one of the reasons for the margin contraction? The answer is no. Constellation has revenue and expenses distributed almost equally across geographies, so foreign exchange rates don’t impact margins too much. In fact, as more expenses are denominated in other currencies than the dollar, an appreciation of the dollar is a slight tailwind:
Constellation MD&A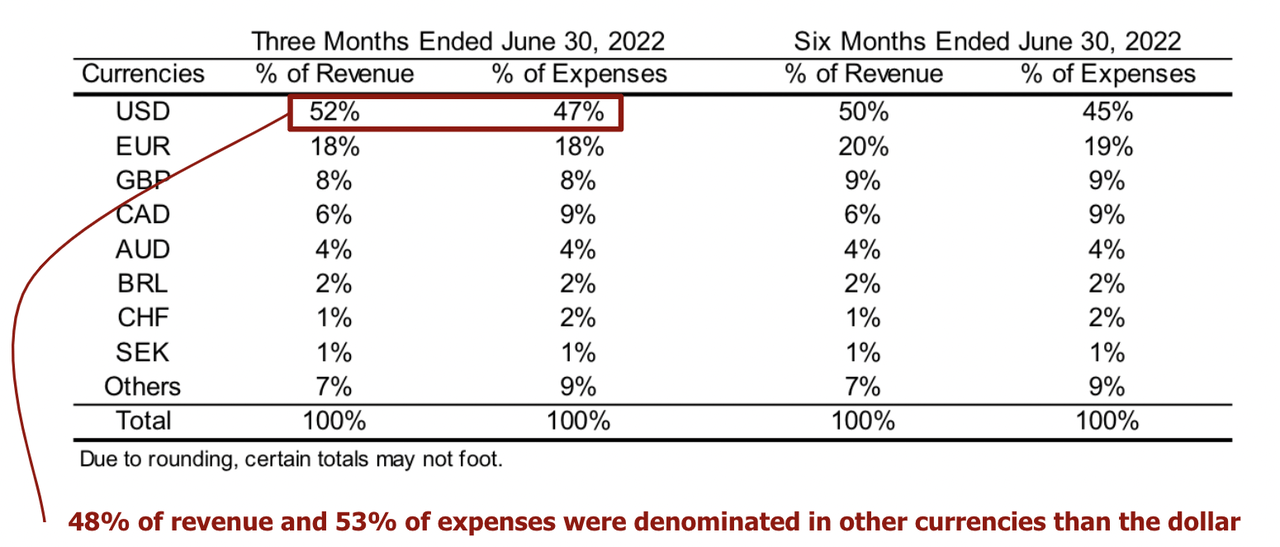
The company enjoyed a 5% exchange rate tailwind, protecting margins.
Due to the company’s decentralized organizational structure, most revenue and expenses are attributable to acquired companies with expenses in the same currency in which they generate revenue. For example, if Constellation buys a Spanish company, it’ll almost certainly let the business operate independently, so revenue and expenses will continue to be generated and incurred in euros. This is different for companies such as Meta, which generate revenue in many currencies but incur most of its expenses in US dollars due to the company being run in its majority in the US. In Meta’s case, a strong dollar might impact margins due to similar expenses distributed across a lower revenue base.
This expense increase came from various sources, none of which are too relevant to comment on. However, it’s essential to understand that expenses are rarely optimized in any given quarter, especially in those quarters where Constellation has deployed a big amount of capital.
As the company acquires other companies, their expenses automatically appear in Constellation’s consolidated statements. Many of these companies have yet to optimize their costs by taking advantage of Constellation’s central services, exploiting synergies with other companies in the portfolio, etc. It’s a bit harsh to say it this way, but we doubt we’ll see Constellation’s true margin potential as long as it keeps acquiring companies.
Last quarter, we analyzed contingent consideration, which management defines as follows:
The contingent consideration expense amounts recorded for the three and six months ended June 30, 2022 related to an increase in anticipated acquisition earnout payment accruals primarily as a result of increases to revenue forecasts for the associated acquisitions.
Source: Constellation MD&A
This can be interpreted as follows: if an acquisition does better than management expected, they have to pay a bit more for it.
Contingent consideration is an expense, but if we look at it through the lens of M&A, we want it to be positive because it signals that some acquisitions are going better than expected. This quarter, the contingent consideration was $3 million, and in the first half of 2022, the company has almost equaled the contingent consideration paid in the full year 2021:
Made by Best Anchor Stocks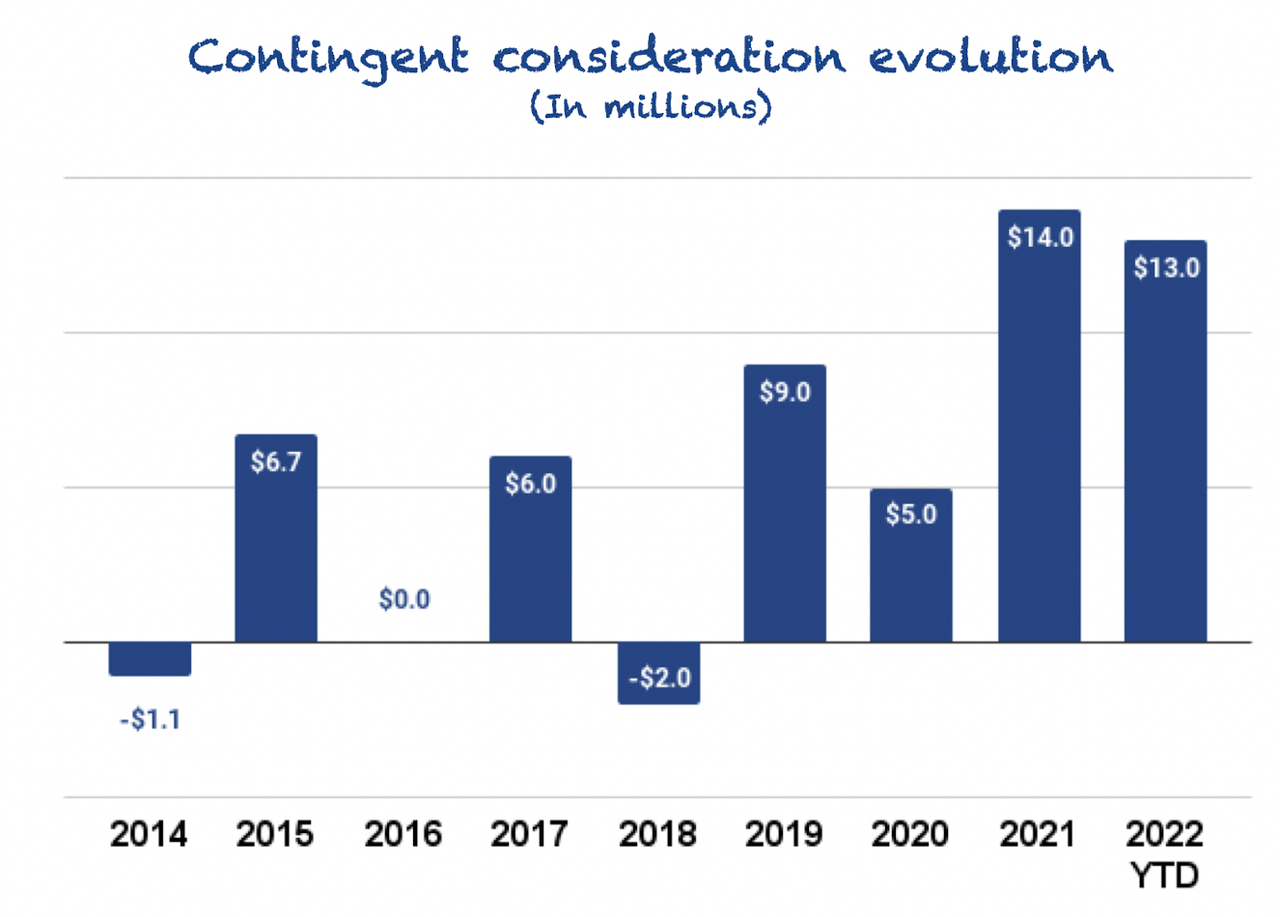
We can interpret this as:
On average, acquisitions are proving to be better than expected.
However, this interpretation might be misleading for two reasons. First, it only considers those acquisitions that explicitly note in the acquisition terms that the acquisition price will increase if specific targets are met. Secondly, this is only half of the story because Constellation also records impairments when acquisitions are not going as expected.
This quarter, Constellation took $300k in impairments, so the year seems to be shaping up well from this perspective too when compared to the two previous years:
Made by Best Anchor Stocks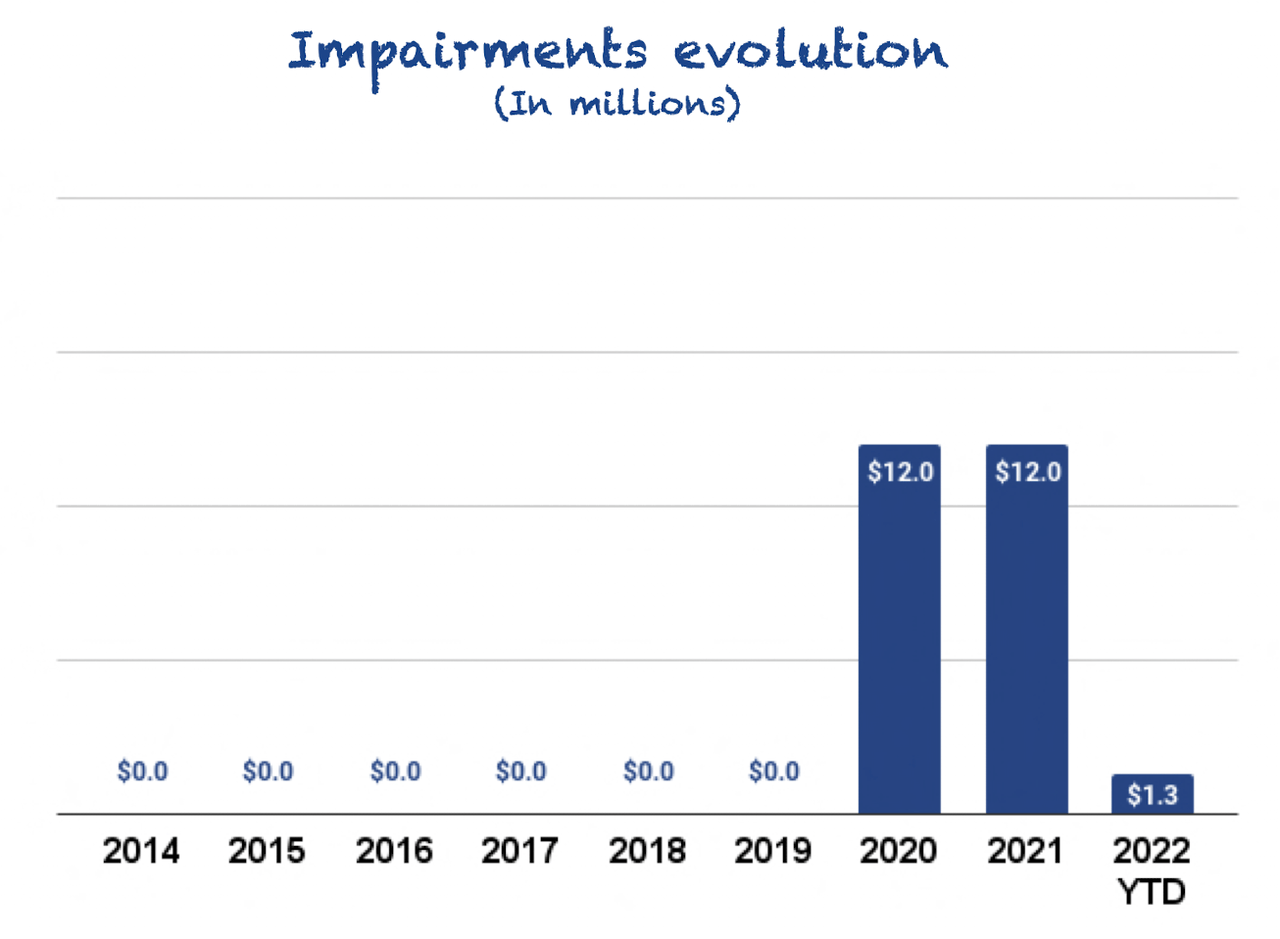
It’s also important to understand that these two metrics are volatile, so we shouldn’t extrapolate what has happened during the first half of the year to the second half. We really don’t know what can happen during the second half. If we net both metrics, we could argue that Constellation’s M&A is going better than expected, but the limitations in contingent considerations make us cautious of making this conclusion.
Another metric we can look at to grab an idea of what type of companies Constellation buys is the bargain purchase gain. As per Constellation:
Results from the fact that the fair value of the separately identifiable assets and liabilities acquired exceeded the total consideration paid, principally due to the acquisition of certain assets that will benefit the Company that had limited value to the sellers.
Source: Constellation MD&A
Some assets on their own might be worth little, but when combined with Constellation’s portfolio of VMS companies, they are worth more. This is one of the reasons why Constellation can achieve high IRRs (Internal Rates of Return). There is asymmetric information so to say, because the seller doesn’t really know how much value that asset has for Constellation; they just know how much it’s worth to them.
Looking at cash flows – understanding the drop
Constellation’s cash flows are very volatile. The only thing we can be confident about regarding the timing of cash flows is that Q1 is always the quarter with the highest cash flow. This is because most of Constellation’s acquisitions invoice customers at the start of the year, so they operate with negative working capital (i.e., they have self-funding, so to say). Besides this, it’s complicated to make any conclusion based on quarterly cash flow numbers, and this quarter was simply an example.
Operating cash flow decreased 55% Y/Y while FCFA2S (Free cash flow available to Shareholders) decreased 92% Y/Y:
Made by Best Anchor Stocks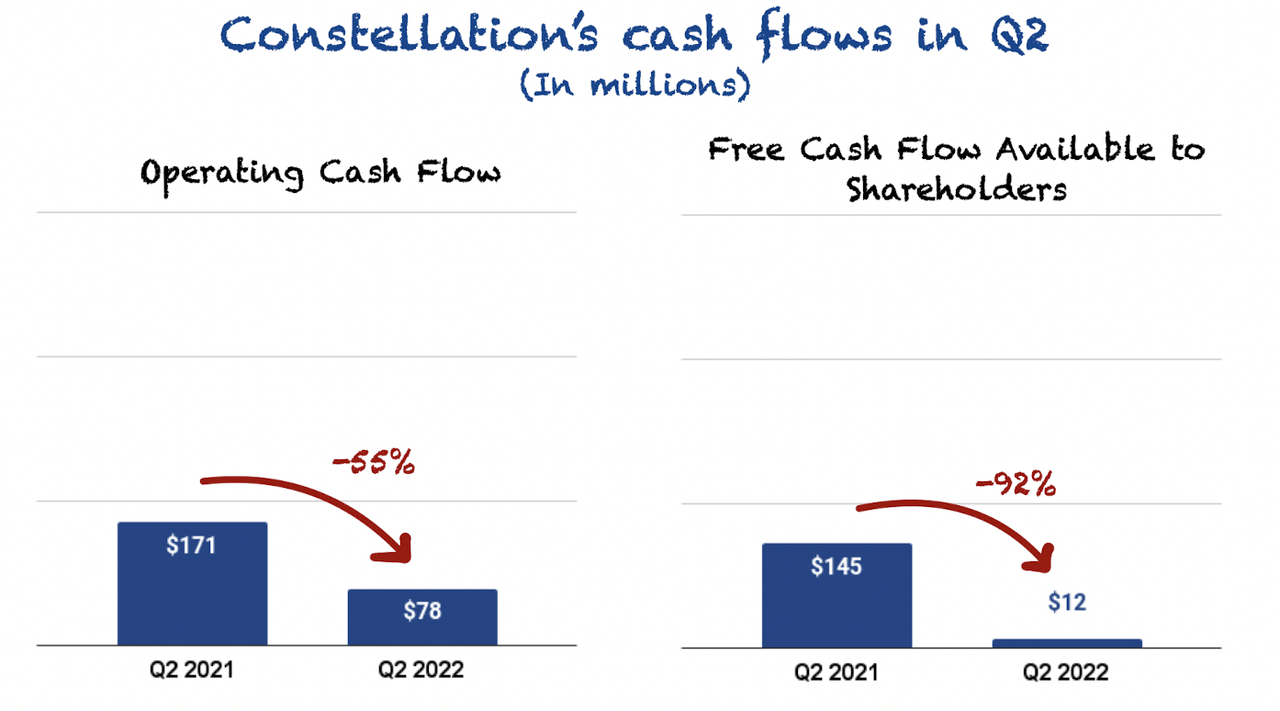
I agree this looks pretty worrying at first sight, but we really should try to wait until the year is over to see where cash flows end up. There were two main reasons for the quarterly decrease, in order of relevance:
-
The company took a hit in non-cash operating working capital
-
Cash taxes
Let’s briefly go over each of these.
(‘A’) The company took a hit in non-cash operating working capital
Operating working capital measures the money the company needs to conduct business in the short to medium term and is typically calculated as current assets minus current liabilities. If positive, it means the company has enough assets to cover its short-term operating liabilities, and if negative, it means the company is funding its operations with its customers or suppliers (for example, by paying them later despite receiving their money soon).
As we said before, Constellation’s companies typically operate with negative working capital because they receive the money before performing the services. This money flows into deferred revenue, which is a liability. Of course, it also flows into cash, but as we are talking about non-cash operating working capital, we get a negative reading when deferred revenue increases.
This quarter, cash flows took a substantial hit from changes in this metric:
Constellation MD&A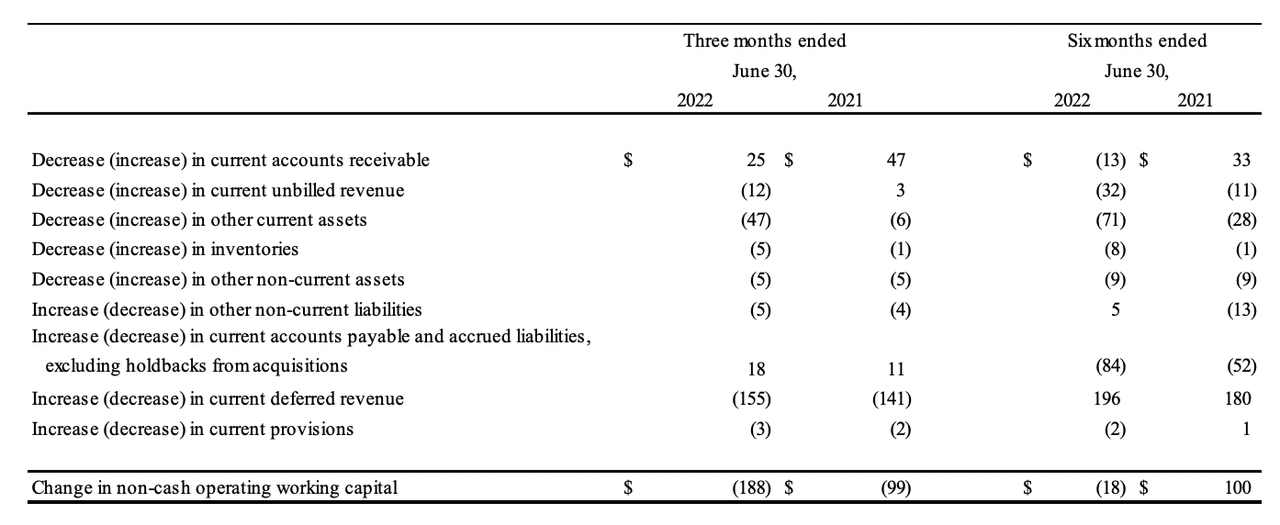
The larger impact came from deferred revenue, a muted decrease in accounts receivables, and other current assets (shown below):
Constellation MD&A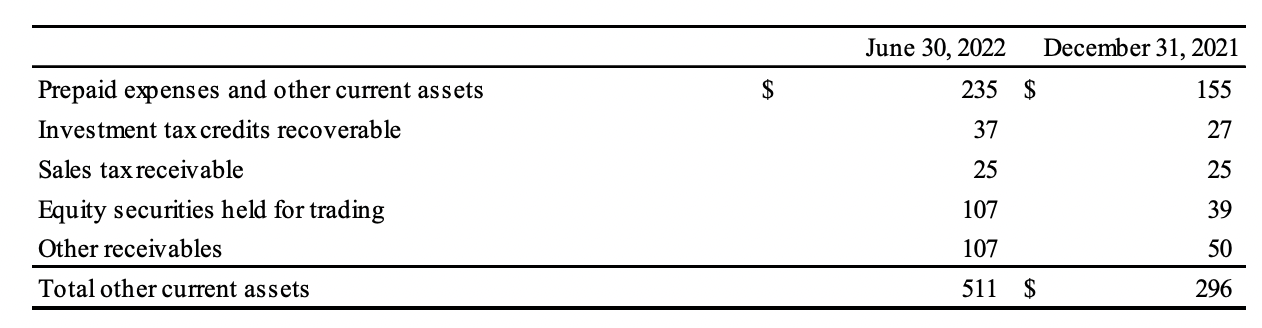
So, summarizing, the company prepaid more money this quarter, had more deferred revenue, and received less of its accounts receivable balance than in the comparable quarter, all of which negatively impacted cash flow.
Management explained it as follows:
The primary reason for the decline in CFO for the three and six months ended June 30, 2022 is that CFO includes the impact of changes in non-cash operating assets and liabilities exclusive of effects of business combinations or “changes in non-cash operating working capital.
There are many reasons contributing to the non-cash operating working capital variance none of which are indicative of an underlying concern with the Company’s overall non-cash operating working capital balance. Specifically, no concerns with accounts receivable or unbilled revenue aging.
Source: Constellation MD&A
The above is basically management telling us that it was more a timing issue than any sign of deteriorating fundamentals. We agree the message may come across as a bit cryptic, but the only thing we can do right now is trust management and wait until the year is over to see if it was indeed a timing issue. As of now, we don’t have any reason to distrust management’s word. In the past, they have proven to be very trustworthy many times over.
(‘B’) Cash taxes
In Q2, income taxes paid increased 50% Y/Y. The increase was created by a change in the Tax Cuts and Jobs Act which became effective in 2022:
Effective for 2022, research and experimentation (R&E) expenditures are no longer allowed to be deducted as incurred for US entities. The Tax Cuts and Jobs act mandates that, for tax years beginning after December 31, 2021, R&E expenditures be deferred and amortized.
Source: Constellation MD&A
Simply put, these expenses are now deducted over a more extended period. US-based expenditures will be amortized over 5 years, and non-US-based expenditures will be amortized over 15. The expense is still deductible in full, but as the company can only take a little bit of the expense at a time, this increases net income for every year and thus taxes paid. As in Q2 2021 Constellation deducted the full expense, it paid fewer taxes, so Cash Flows came in higher. There’s little the company can do about this, and this distortion will last for the remainder of the year.
All in all, cash flows for Q2 were weak, but one of the issues seems to be a timing issue, and the other one is something the company can do very little about (regulation). We must have the ability to zoom out and focus on yearly cash flow. Inside a given quarter, there can be many variables impacting the metric, but things should start to normalize as we zoom out. Sometimes it requires even more than that!
Acquisitions – Record quarterly cash deployment
Constellation reported its strongest quarter to record when it comes to M&A activity. The company deployed $1.06 billion (yes, “billion,” you read that right) into acquisitions during the quarter. If we compare it with the last few quarters, we can see how impressive this was:
Made by Best Anchor Stocks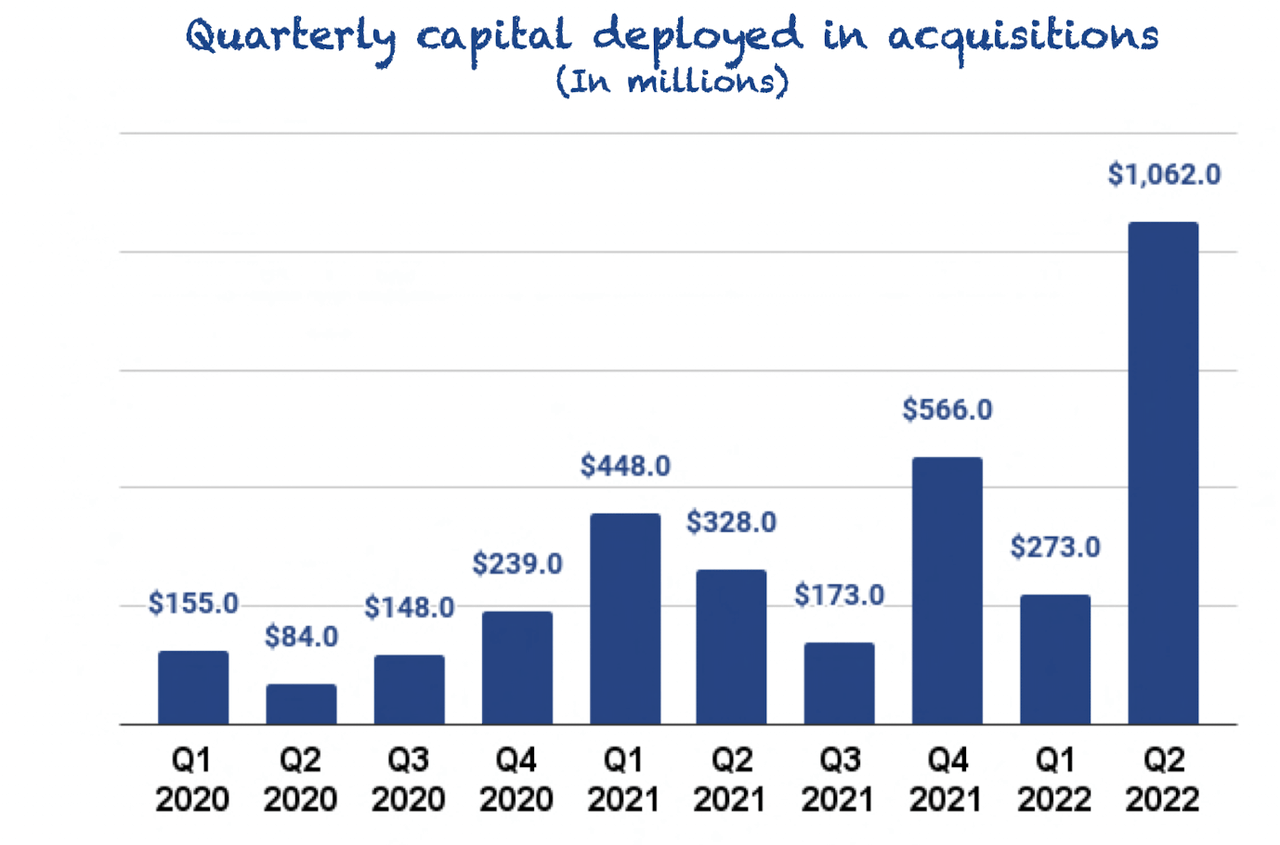
This quarter was so impressive that if we compare the capital deployed in the first half of 2022 with yearly metrics, we can see that we are close to the annual record achieved last year. The YTD metric also includes the capital that Constellation deployed in July ($164 million):
Made by Best Anchor Stocks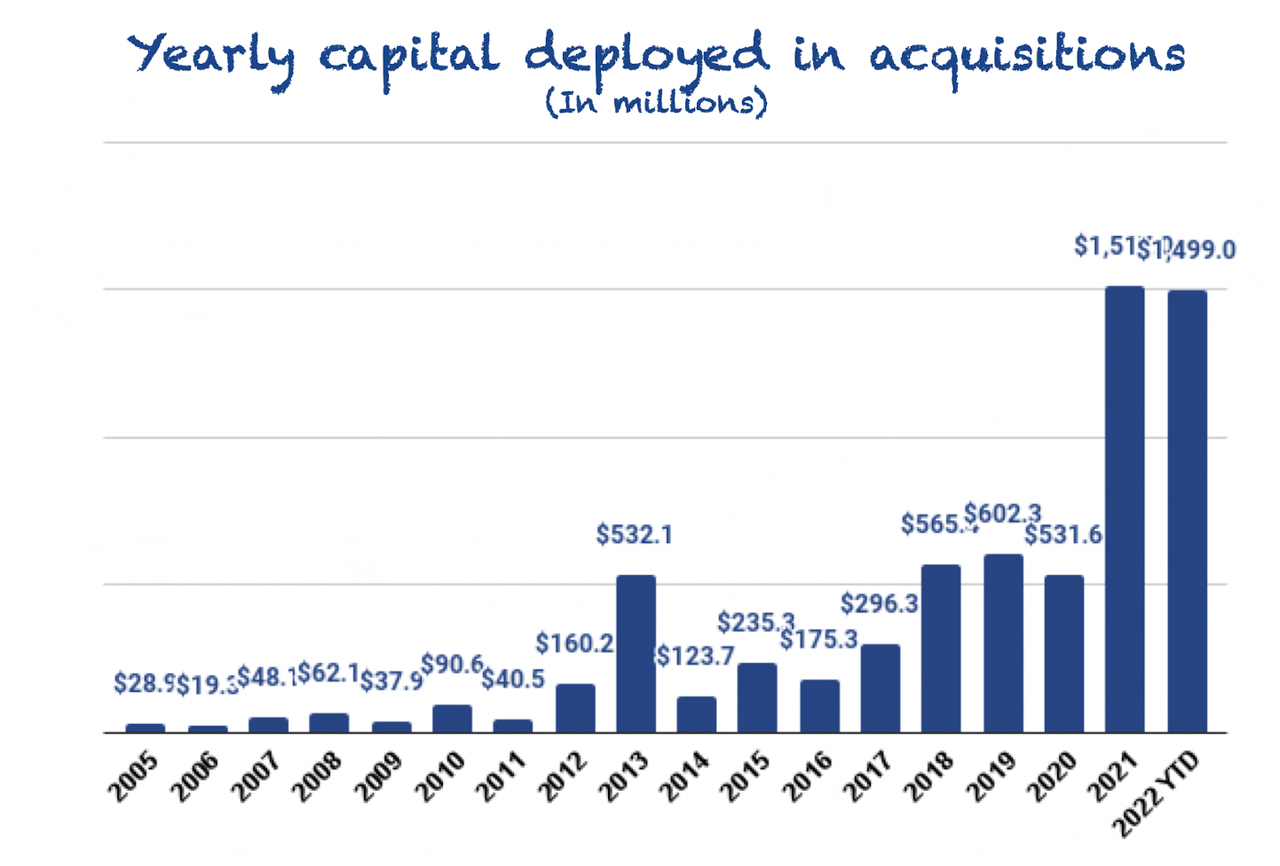
We don’t really know how the rest of Q3 and Q4 will go, but we are fairly confident that 2022 will be another record year in capital deployment.
Of course, a large chunk of this quarter’s capital deployed was attributable to the Allscripts acquisition, but if we net this out, capital deployed was still very decent:
Made by Best Anchor Stocks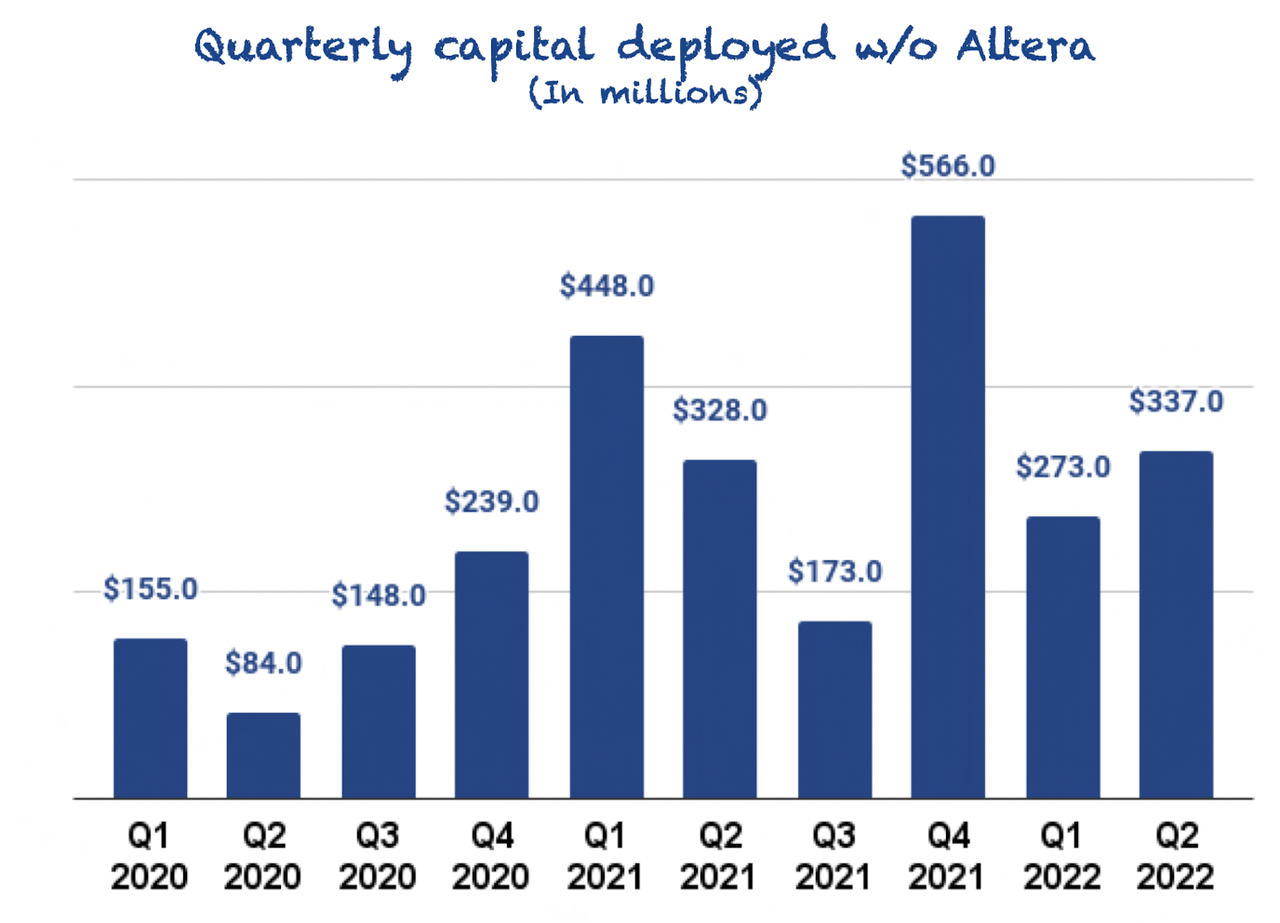
Capital deployed is also a metric that suffers from significant volatility due to the impossibility of timing acquisitions. Still, when we zoom out, we can see how Constellation’s M&A keeps scaling. We don’t know if the company will be able to achieve its desired long-term organic growth rate, but if it does, it can be a very profitable combination for shareholders.
Leveraging the balance sheet
Despite a large amount of capital deployed during the first 6 months, the company’s cash balance didn’t change substantially. Constellation ended the quarter with $676 million in cash compared to $763 million as of December 31st, 2021.
However, this money has to come from somewhere, and it came from an increased reliance of the company on debt. Debt has increased substantially since the end of 2021, but most of this increase has occurred in debt without recourse to Constellation:
Made by Best Anchor Stocks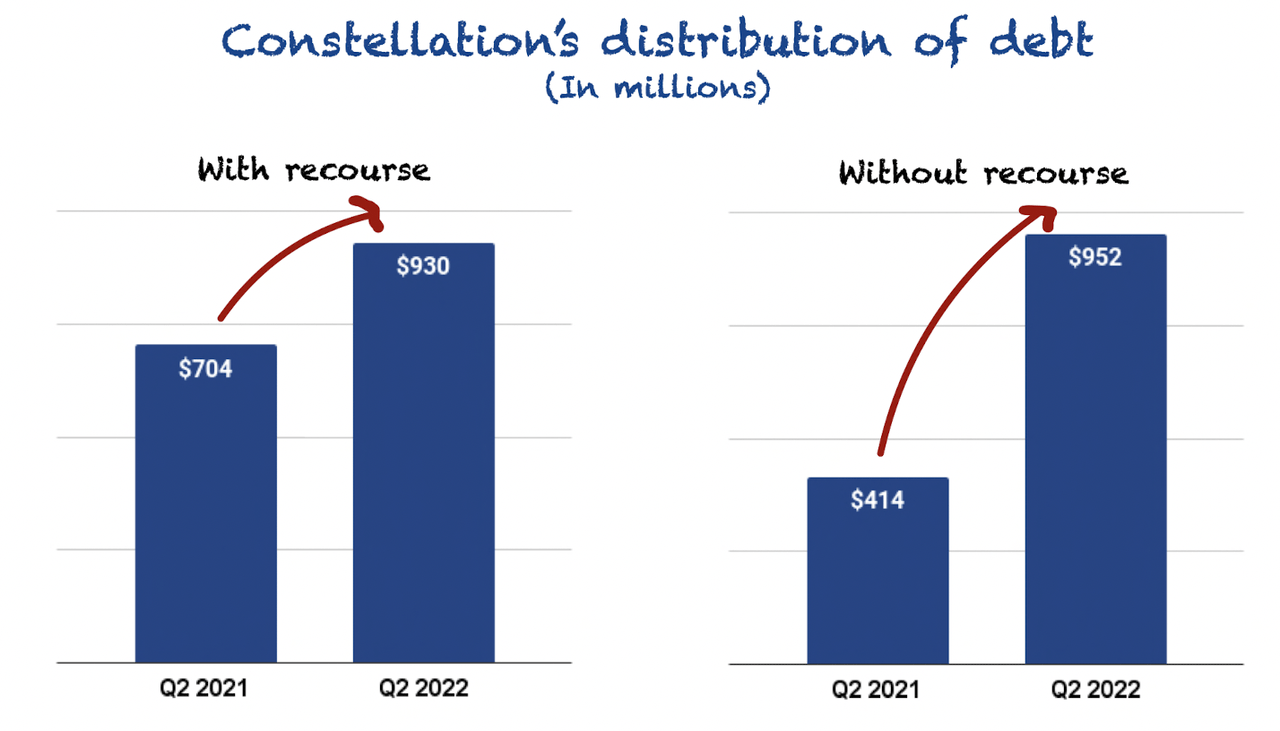
Constellation is now in a net debt position, but we are not worried. We believe the predictability and resilience of cash flows should help the company carry more debt than it currently has without compromising its financial strength. In fact, Constellation is known for being too conservative in leveraging its balance sheet to make acquisitions compared to its competition.
Conclusion
All in all, we think it was a solid quarter for Constellation. Revenue and organic growth remained strong, and quarterly capital deployed set a new record. Margins and cash flows were the “lowlight,” so to speak, but we really need to zoom out to understand that some of these impacts are temporary in nature.
Be the first to comment