

Diego Thomazini/iStock via Getty Images
By Gargi Pal Chaudhuri
KEY TAKEAWAYS
- Commodity indexes have rallied amid heightened geopolitical uncertainty and structural supply shortages
- Commodities have historically shown resiliency in rising rate environments and can help investors hedge against rising inflation and diversify portfolios
- Commodity exchange traded funds (ETFs) offer convenient and affordable access to a broad range of commodities
Heightened geopolitical and inflationary pressures this year have put a spotlight on commodities, with investors using the asset class for a dual purpose: a potential hedge against inflation and adding diversification to a broader portfolio in a rising rate environment. As a result, we’ve seen an increase in prices and volatility across the commodity asset class as a whole.
COMMODITIES AND INFLATIONARY FORCES
Commodities, as represented by the S&P GSCI — a benchmark of 24 commodities in agriculture, energy, and metals — is one of the top-performing asset classes year to date, up 34.52% through March 22nd, outpacing all other asset classes1.
Structural drivers – such as strong demand from economies reopening from COVID-19 restrictions, localization of supply chains, and historical under-investment in commodity production — mean that the supply and demand mismatch could persist. Meanwhile, heightened geopolitical risk may be supportive of continued commodity strength. The current disruption in energy and commodity supplies could impact the inflation outlook significantly. 40% of Europe’s natural gas is sourced from Russia; the country is also responsible for 43% of global palladium, while Russia and Ukraine combined account for nearly 30% of global wheat exports.2
We see specific themes in commodities that could benefit from the transition to a low carbon economy. For example, we see persistent demand due to the vital role commodities play in renewable technologies, specifically metals such as copper, nickel, and aluminum. Copper, in particular, will be key to the low carbon transition. The metal is highly conductive and malleable. On average, a battery electric vehicle uses 183 lbs. of copper versus only 18-49 lbs. required by an average internal combustion vehicle.3
We believe exposure to commodities could help hedge against inflation. Notably, commodities like crude oil and natural gas are components within the energy portion of the Consumer Price Index, which measures inflation. Not only does energy make up 7.4% of this inflation gauge, but it also impacts the costs many businesses bear in producing goods and services in the economy.
2022 Commodities Performance vs. S&P 500 & Bloomberg US Bond Aggregate Index
Source: Bloomberg, as of March 22, 2022.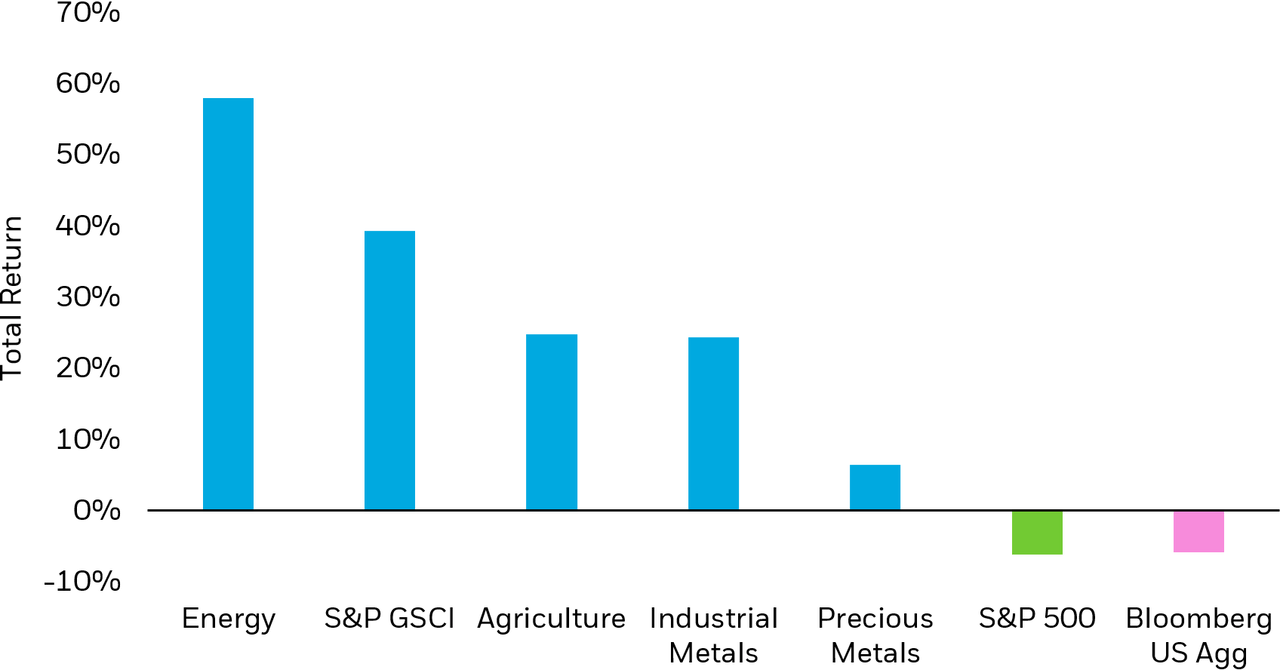
Chart by iShares Investment Strategy. Energy represented by Bloomberg Energy Subindex Total Return (BCOMENTR Index), S&P GSCI represented by S&P GSCU Dynamic Roll TR (SPDYCITR Index), Agriculture represented by Bloomberg Agriculture Subindex Total Return (BCOMAGTR Index), Industrial Metals represented by Bloomberg Industrial Metals Subindex Total Return (BCOMINTR Index), Precious Metals represented by Bloomberg Precious Metals Subindex Total Return (BCOMPRTR Index), S&P 500 Index (SPX Index), Bloomberg US Agg Return Value Unhedged USD (LBUSTRUU Index). Index performance does not reflect any management fees, transaction costs or expenses. Indexes are unmanaged and one cannot invest directly in an index. Past performance does not guarantee future results.
COMMODITIES AS PORTFOLIO DIVERSIFIERS
On average, since 1997, commodities have historically outperformed the S&P 500 in the first 12 months after the beginning of a rate hiking cycle.5 They have exhibited relatively low correlation to equities and bonds over time, adding diversification to multi-asset portfolios6. Moreover, commodity sectors typically have a low correlation to each other. For instance, precious metals and livestock are two commodities sectors that have been negatively correlated in the last 10 years7. Therefore, broad commodity exposures could provide a source of diversification against equity and bond volatility within a rising environment.
We are seeing sentiment towards gold strengthening as geopolitical uncertainty continues. Gold’s low-to-negative correlation to equities has been sought as equity volatility has increased in recent weeks.8 We believe the precious metal could benefit in the case of a negative growth shock — an economic shock that decreases potential GDP caused by the rising commodity prices. A negative growth shock could slow central bank appetite for rate hikes, decreasing the opportunity cost of holding gold in portfolios.
ETFs FOR ACCESS TO COMMODITY INDEXES
Investors are increasingly using commodities in their portfolios for diversification of returns and to help mitigate other risks in their portfolios, like inflation. Demand for broad, diversified commodities ETFs that give investors access to commodity exposures across the energy, metals, agriculture, and livestock sectors has continued to increase in 2022, bringing in $6 billion YTD after $8.4 billion in 20219. Gold-focused ETFs also saw more than $9 billion of inflows as investors seek portfolio resilience.
2022 Cumulative Commodities Flow
Source: BlackRock, Bloomberg, as of March 22, 2022.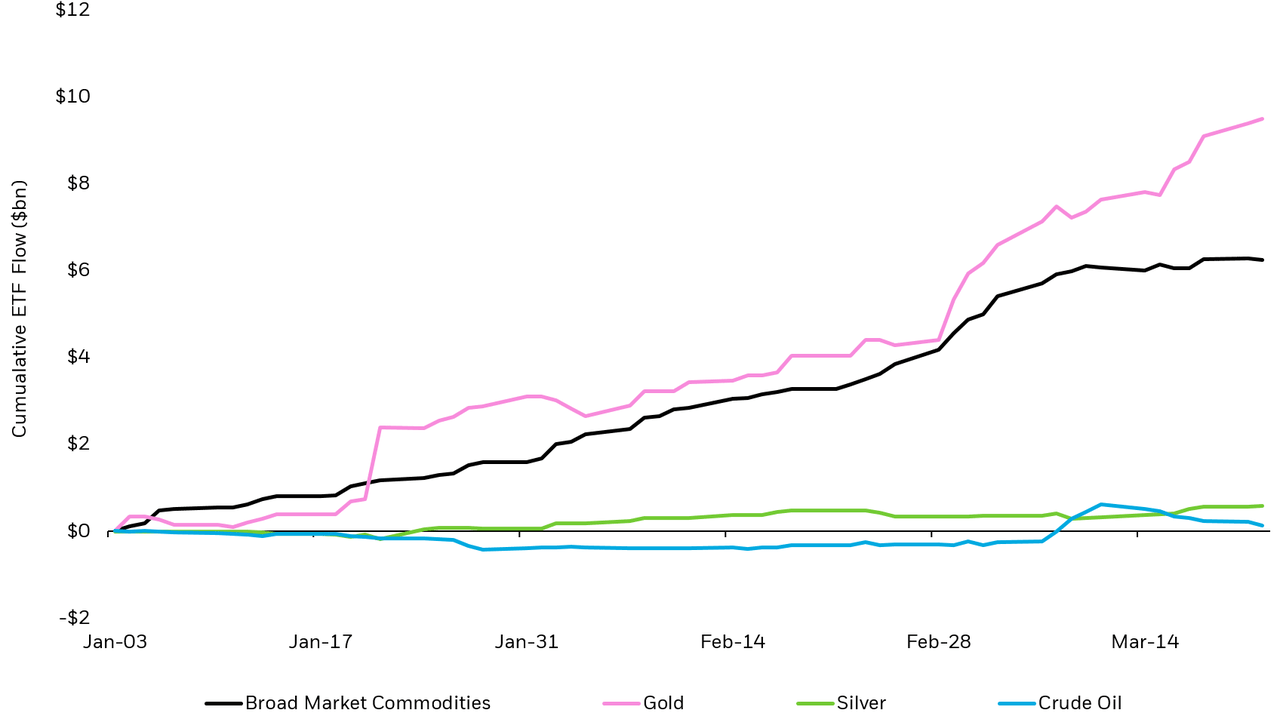
Chart by iShares Investment Strategy. ETF groupings determined by Markit. Broad Market Commodities are defined as ETFs that have exposure to more than one commodity.
Commodity ETFs offer convenient, affordable access to broad commodities exposures and can help investors align their portfolios with their views on inflation and economic outlook.
© 2022 BlackRock, Inc. All rights reserved.
1 Source: Bloomberg. As of March 22, 2022.
2 Source: Financial Times, “European industry braced for pain from latest surge in oil and gas prices.” As of March 7, 2022.
3 Source: Copper Development Association Inc., “Copper Drives Electric Vehicles.” As of June 2017.
4 Source: U.S. Bureau of Labor Statistics. As of February 11, 2022. Energy weight in the Consumer Price Index for All Urban Consumers (CPI-U). There are two indexes available for two population groups: a CPI for All Urban Consumers which covers approximately 93% of the total population and a CPI for Urban Wage Earners and Clerical Workers (CPI-W) which covers 29% of the population. CPI-U is the more widely used metric and is synonymous with CPI.
5 Source: Bloomberg. As of March 22, 2022. Based off analysis by iShares Investment Strategy of four rate hiking cycles since 1997. First rate hikes dates in each cycle are 3/25/1997, 6/30/1999, 1/31/2006, 12/17/2015. Commodities represented by S&P GSCI Dynamic Roll TR (SPDYCITR Index), equities represented by S&P 500 (SPX Index).
6 Source: Bloomberg. As of March 22, 2022. Commodities represented by S&P GSCI Dynamic Roll TR (SPDYCITR Index), equities represented by S&P 500 (SPX Index), bonds represented by the Bloomberg US Aggregate Bond Index (LBUSTRUU Index).
7 Source: Bloomberg. As of March 22, 2022. Livestock represented by Bloomberg Livestock Subindex Total Return (BCOMLI Index), Precious Metals represented by Bloomberg Precious Metals Subindex Total Return (BCOMPR Index).
8 Source: Bloomberg. As of March 22, 2022. Gold represented by Gold United States Dollar Spot (XAU Curncy), equities represented by S&P 500 (SPX Index).
9 Source: Bloomberg. As of March 22, 2022. ETF grouping determined by Markit.
Carefully consider the Funds’ investment objectives, risk factors, and charges and expenses before investing. This and other information can be found in the Funds’ prospectuses or, if available, the summary prospectuses, which may be obtained by visiting the iShares Fund and BlackRock Fund prospectus pages. Read the prospectus carefully before investing.
Investing involves risk, including possible loss of principal.
Commodities’ prices may be highly volatile. Prices may be affected by various economic, financial, social and political factors, which may be unpredictable and may have a significant impact on the prices of commodities.
Investing in commodity-linked derivatives and commodity-related companies may increase volatility. Price movements are outside of the Fund’s control and may be influenced by weather and climate conditions, livestock disease, war, terrorism, political conflicts and economic events, interest rates, currency and exchange rates, government regulation and taxation. Commodity futures trading may be illiquid. In addition, suspensions or disruptions of market trading in the commodities markets and related futures markets may adversely affect the value of the Fund.
Commodity futures exposure is achieved through investments in, but not limited to, commodity-linked notes, swap agreements, commodity options, futures and options on futures.
The price of gold and precious-metal related securities historically has been very volatile and may adversely affect the financial condition of those companies. The production and sale of precious metals can be affected by economic, financial and political factors, which may be unpredictable and significantly impact supply and prices.
This material represents an assessment of the market environment as of the date indicated; is subject to change; and is not intended to be a forecast of future events or a guarantee of future results. This information should not be relied upon by the reader as research or investment advice regarding the funds or any issuer or security in particular.
The strategies discussed are strictly for illustrative and educational purposes and are not a recommendation, offer or solicitation to buy or sell any securities or to adopt any investment strategy. There is no guarantee that any strategies discussed will be effective.
The information presented does not take into consideration commissions, tax implications, or other transactions costs, which may significantly affect the economic consequences of a given strategy or investment decision.
This material contains general information only and does not take into account an individual’s financial circumstances. This information should not be relied upon as a primary basis for an investment decision. Rather, an assessment should be made as to whether the information is appropriate in individual circumstances and consideration should be given to talking to a financial professional before making an investment decision.
The information provided is not intended to be tax advice. Investors should be urged to consult their tax professionals or financial professionals for more information regarding their specific tax situations.
The Funds are distributed by BlackRock Investments, LLC (together with its affiliates, “BlackRock”).
The iShares Funds are not sponsored, endorsed, issued, sold or promoted by Bloomberg, BlackRock Index Services, LLC, Cohen & Steers, European Public Real Estate Association (“EPRA®”), FTSE International Limited (“FTSE”), ICE Data Indices, LLC, NSE Indices Ltd, JPMorgan, JPX Group, London Stock Exchange Group (“LSEG”), MSCI Inc., Markit Indices Limited, Morningstar, Inc., Nasdaq, Inc., National Association of Real Estate Investment Trusts (“NAREIT”), Nikkei, Inc., Russell or S&P Dow Jones Indices LLC. None of these companies make any representation regarding the advisability of investing in the Funds. With the exception of BlackRock Index Services, LLC, which is an affiliate, BlackRock Investments, LLC is not affiliated with the companies listed above.
Neither FTSE, LSEG, nor NAREIT makes any warranty regarding the FTSE Nareit Equity REITS Index, FTSE Nareit All Residential Capped Index or FTSE Nareit All Mortgage Capped Index. Neither FTSE, EPRA, LSEG, nor NAREIT makes any warranty regarding the FTSE EPRA Nareit Developed ex-U.S. Index or FTSE EPRA Nareit Global REITs Index. “FTSE®” is a trademark of London Stock Exchange Group companies and is used by FTSE under license.
© 2022 BlackRock, Inc. All rights reserved. BLACKROCK, BLACKROCK SOLUTIONS, BUILD ON BLACKROCK, ALADDIN, iSHARES, iBONDS, FACTORSELECT, iTHINKING, iSHARES CONNECT, FUND FRENZY, LIFEPATH, SO WHAT DO I DO WITH MY MONEY, INVESTING FOR A NEW WORLD, BUILT FOR THESE TIMES, the iShares Core Graphic, CoRI and the CoRI logo are trademarks of BlackRock, Inc., or its subsidiaries in the United States and elsewhere. All other marks are the property of their respective owners.
iCRMH0422U/S-2098963
This post originally appeared on the iShares Market Insights.
Editor’s Note: The summary bullets for this article were chosen by Seeking Alpha editors.
Be the first to comment