

Cryptocurrency And Mobile Technology solarseven
Investment Thesis
Coinbase (NASDAQ:COIN) has declined 80% since reaching its all-time high of $360 in November last year, eroding $48 billion of its value. So, what has happened? There are several causes. Firstly, general trend of growth stocks being hammered at times of rising interest rates and increasing equity premiums. Second, the bitcoin price collapse of 60%. And the last, but not least, its poor earnings results and the cash drainage of USD 1.58 billion in Q1-22. These factors led us to make significant adjustments to our FCF valuation model with new target price being revised downwards to $52. This price is in line with the current market, so we changed our view to hold and will monitor how things develop in the crypto market for any further analysis.
Crypto Selloff
As we have thoroughly examined in our previous article, Coinbase has always had high correlation with Bitcoin (BTC-USD) due to substantial retail traders involvement and a nature of its business. Considering recent crypto selloff, it is not surprising that COIN has had a massive hit with its revenues falling by a half and its operating cash flow flipping from a profit of USD 846 million in Q4-2021 to a cash loss of USD 830 million in Q1 this year. Thus, one of the risks we’ve talked before have materialised and as COIN is relatively young venture with its revenues still not sufficiently diversified between retail and institutional money, we saw a massive drop in its share price.
How things will develop for COIN from now on mainly depend on the developments on the crypto market and this is a big unknown. What we’ve learned so far is that crypto is not a hedge against equity market drawdowns and its diversification benefits were hugely overstated in the past. Since the beginning of this year the S&P lost 18% while BTC was down 54% with Coinbase falling 75%.
Seeking Alpha charting section 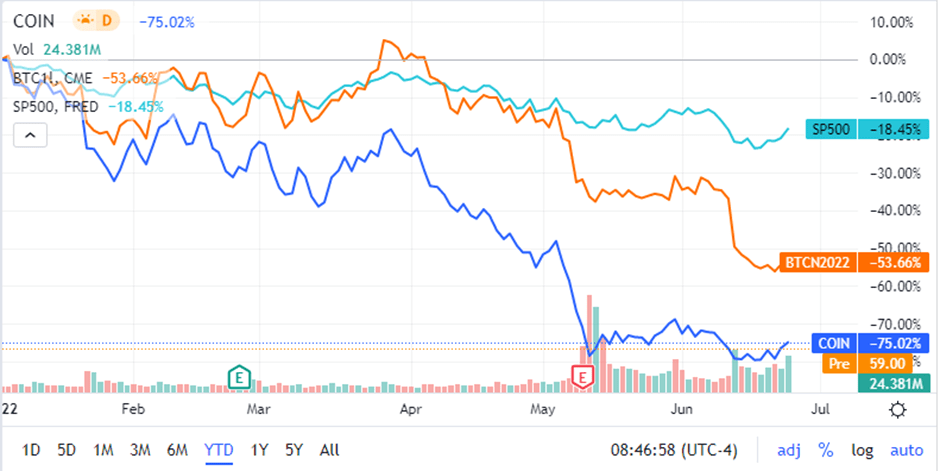
Bitcoin’s selloff was caused by two main factors: a) FED and other central banks hawkishness in response to increased inflation and b) the collapse of the Terra blockchain that happened in May. The latter event forced Luna Foundation Guard to sell 80k Bitcoins which aimed to support dollar-peg of its UST stablecoin. This dump created a massive selling pressure with BTC price dropping from USD 39k to USD 29k in a matter of days early May. It also didn’t help UST from the collapse and the peg was subsequently broken with the stablecoin price slumping from $37 to less than a dollar. This event created jitters in crypto space with retail traders rushing to get rid of their crypto positions.
From the charting perspective BTC has breached many technically important levels such as 200-week moving average and its cost basis realised price – the levels that have not been breached at other major bitcoin selloffs in 2014 and 2018. It created more downside pressure with BTC looking for a support at a technically important $20k which currently holds.
ARK Invest Bitcoin Monthly May 2022 Report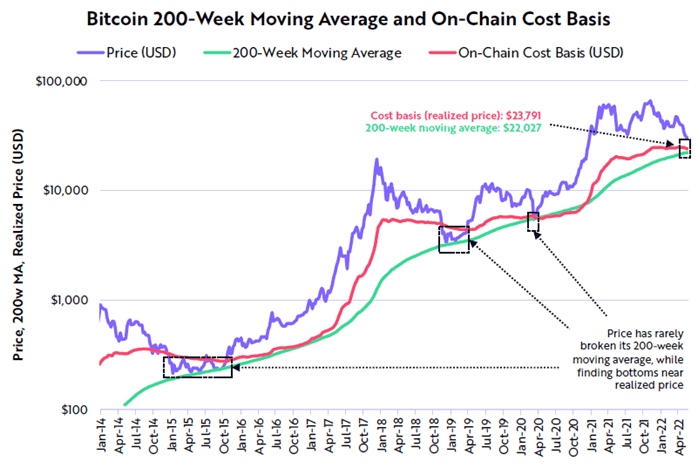
Looking at other indicators that are in some way considered as fundamentals of Bitcoin, such as, bitcoin short-term holders vs long-term holders cost basis ratio we can see that there has been a capitulation of short term holders but the ratio has still some room to go towards the support it held in 2015 and 2019.
Chart published by beINcrypto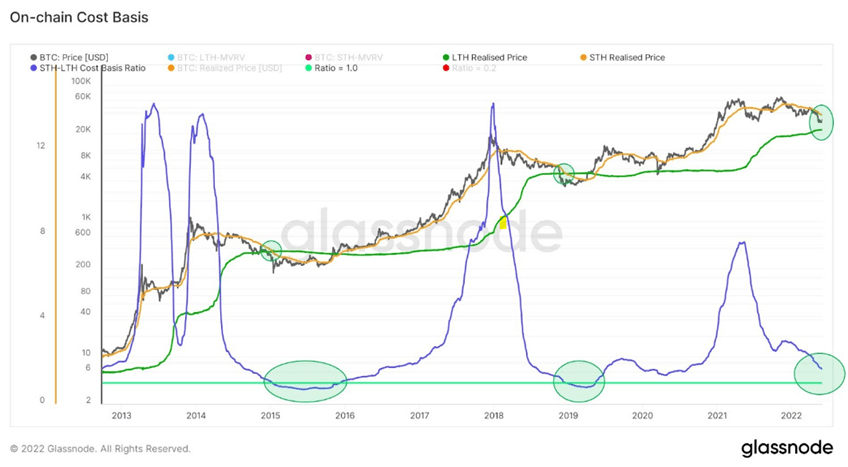
Another positive factor is that the number of total address has actually kept increasing and is nearing 1 billion total addresses (990 million as of 20th June 2022), which indicates continuous Bitcoin adoption.
Bitcoin: number of active addresses (Glassnodestudio)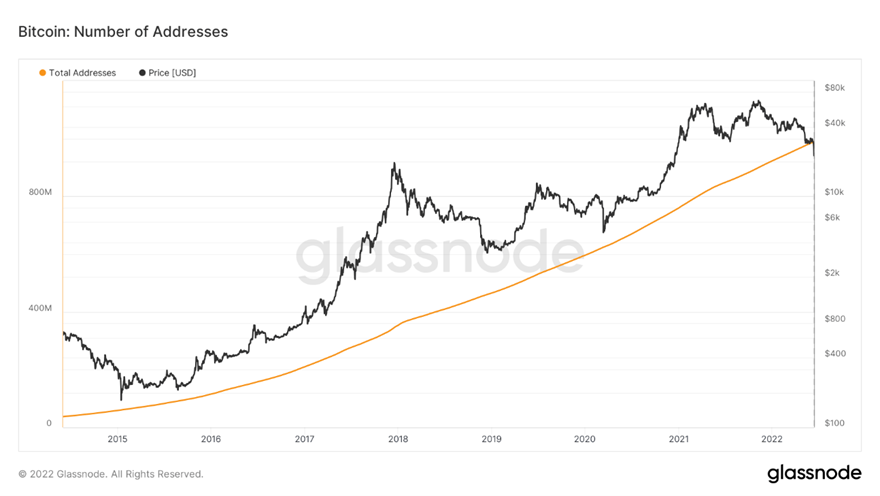
It is always hard to call a market bottom and when analysing past crypto bear markets we can see that the selloff in 2014/2015 lasted nearly two years while the one in 2018 lasted 360 days. The average length of a US stock bear market is approx. 9 to 10 months but there are massive disparities with the shortest one being 33 days and the longest 622 days over the 1929–2021 period. We cannot also look at bitcoin fundamentals in a vacuum as we need to consider overall state of the economy, inflation, war etc. All of these factors will depend on how long this bear market will last.
To sum up, fundamentally bitcoin market looks healthy and there are indications of bitcoin being oversold. However, its further price development cannot be looked at in isolation and hugely depends on current macro developments such as inflation, political uncertainty, the length of the war in Ukraine to name just a few.
Financials
COIN Q1-2022 results were on a weak side, but it has been widely expected considering the turmoil on the crypto market. Its monthly users declined from 11.4 million to 9.2 million QoQ, but were still 50% higher than in Q1 last year. Its trading volume declined in line with crypto assets volatility.
Coinbase Q1-2022 Shareholders letter (Coinbase Q1-2022 Shareholders letter)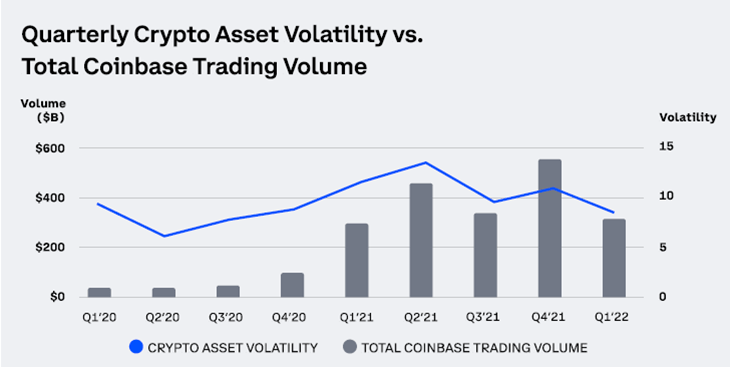
Its revenue fell 49% to USD 1.2 billion, and COIN recorded its first quarter net loss since its IPO. Although transactions expenses fell 45% as these are directly linked to revenues, its operational cost side overall increased by 9% mainly due to a headcount growth as COIN increased its total staff by 33% in this quarter. COIN did not provide any indication of their cost management plans at the earnings call, but we’ve seen reports in FT in June that they are planning to cut nearly fifth of its staff.
Total net loss was USD 430 million while adjusted EBITDA was USD 20 million (down from USD 1.2 billion QoQ). Its cash flow also turned negative USD 1.5 billion with operating cash flow recording a loss of USD 830 million and its investing cash flow negative USD 691 million (primarily driven by investments in crypto assets).
The company has $6.1 billion in liquidity which should be able to help it to withstand three to four quarters of cash drainage without additional financing so its financial soundness directly depends on how long this bitcoin bear market will last.
Valuation
Since our previous article on Coinbase in February this year we had to adjust our valuation model quite dramatically. Firstly, our revenue projections have been reviewed downwards in two nearest years. We estimate topline number to fall 20% in 2022 and to be flat in 2023 (vs previous projection of average 18% increase in both years). This is based on the past crypto selloffs precedents as in both 2014/15 and 2018/19 we saw nearly a year of directionless trading following the bear market in crypto.
Author’s projections of revenue growth (Author’s calculation)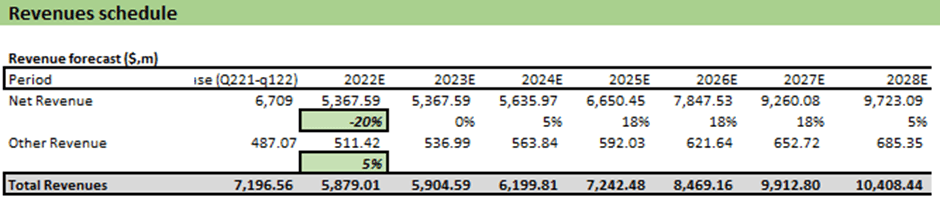
Another substantial adjustment was to the CAPM model. US Treasury 10-Year that we use as a proxy for the risk-free rate increased from 1.8% to 3% and we have also revised equity risk premium towards 10% to account for increased volatility in crypto market space. As a result, the WACC rate which we use to discount FCF has been increased from 11% to 18%.
Author’s FCF valuation (author’s calculation)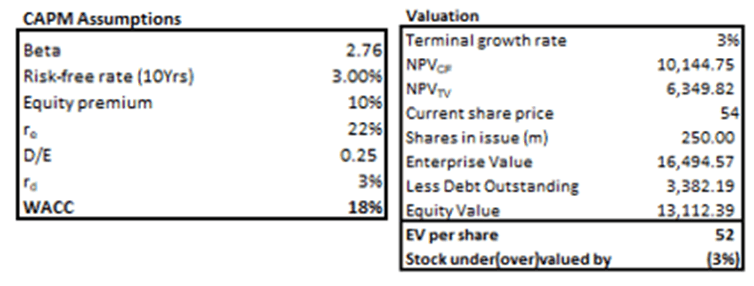
As a result of discussed adjustments our target price of the stock is around $52 which is exactly where it is trading now. For investors with a different appetite to risk we also present sensitivity table below which shows the target price dependency on equity risk premium.
Author’s calculation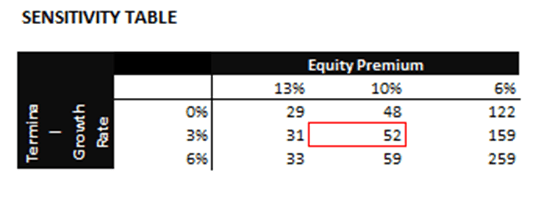
The current average market risk premium in the United States is 5.6%, so if we use that then the target price would be around $160.
Risks
As we have mentioned in the previous article there are three main risks associated with cryptocurrency exchanges and these are high correlation with bitcoin, regulation, and cybersecurity threats.
Bitcoin fundamentals look compelling, but judging by the most recent narratives the market has probably some room to decline further. The market also expects Mt Gox to release BTC 137k to its creditors as early as August which may add to existing selling pressure.
Are there chances that the bear market in bitcoin is not going to end? I personally think it is highly unlikely as we have already seen several bear markets in crypto space and with each subsequent one the chances of following price recovery are increasing because the market is getting more mature with a growing number of developers and investors.
Summary
Considering current state of the crypto market we had to implement substantial adjustments to some of the inputs in the free cash flow valuation model, which have impacted target price downward revision to $52 (vs previous $358) which is in line with the current market price. Coinbase remains very tightly correlated with the bitcoin price which poses huge risks at times of crypto bear markets.
According to the latest narratives and an upcoming unlock of 137k BTC we believe we will see another leg down in the bitcoin price which will add more selling pressure in the near term. Whether COIN be able to withstand this period of high volatility depends on how long the current bear market will last. With a cash buffer of $6 billion COIN has some cushion for a time being, but if there is no recovery in crypto market by the Q1/Q2 next year and with no additional financing we think COIN may get in trouble. We currently maintain hold view on this stock based on the FCF model and believe we need to see some recovery in crypto market before revising our COIN forecast.
Be the first to comment