tupungato/iStock Editorial via Getty Images
Overview
Coca Cola (NYSE:KO) and PepsiCo (NASDAQ:PEP) are companies that need no introduction as most of us are consumers of their products. They make beverages and convenient foods widely available and ready for consumption, and own some of the most recognized consumer brands in the world, including Coca Cola, Pepsi Cola, Fanta, Frito Lay, Dorritos, Quaker, amongst many others.
Powerful Global Brands
Coca Cola
With revenues of $38 billion and a market cap of $261 billion, Coca Cola is the world’s leading beverage company. Its products are sold in more countries and territories than there are members in the United Nations , and its brands have etched themselves deep in the minds of consumers around the world (figure 1).
Figure 1: Representative Coca Cola brands
Coca Cola investor website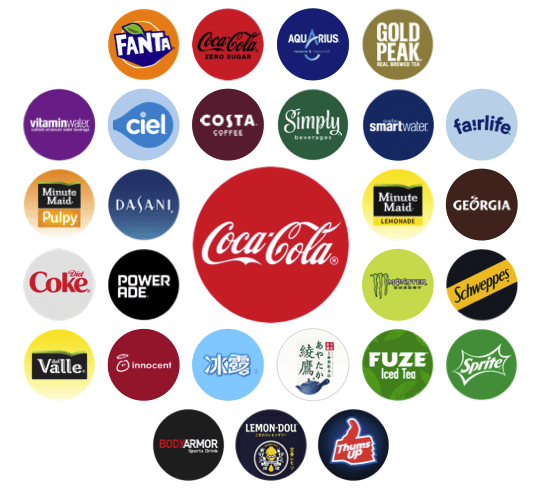
According to Coca Cola’s 2021 10-K filing, beverages bearing the company’s trademarks account for 2.1 billion, or 3.2% of the approximately 63 billion servings of all beverages consumed worldwide each day. (If this sounds incredible, consider that Coca Cola sold 31 billion cases in 2021–each case consists of 24 eight-ounce servings, for a total of 6 trillion ounces. Assuming each of the 8 billion people on Planet Earth consumes the recommended 64 ounces of fluids a day, the total fluid consumption totals about 187 trillion ounces. Coca Cola’s 6 trillion ounces sold accounts for about 3.2% of the total 187 ounces of beverage consumption). Trademark Coca Cola accounts for 47% of Coca Cola’s total worldwide volume, or about 1.5% of the world’s hydration needs.
In 2021, the company discontinued 200 of its smaller and less profitable brands (including Tab, Odwalla, and Zico) to focus on its larger and high growth brands. As the discontinued brands accounted for less than 2% of total revenue, this move did not appear to have any impact on the company’s case volume sold. In addition, the company has formed strategic relationships with Molson Coors and Constellation Brands to bring hard seltzer, spiked juices, and spirits-based to consumers.
PepsiCo
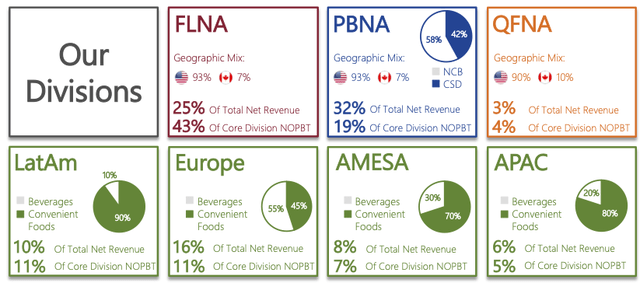
With revenues of $79 billion and a market cap of $226 billion, Pepsi Cola is the market leader in convenient foods (55% of revenues) and the #2 leading global beverage company (45% of revenues) (figure 2). In 2021, Pepsi had a 21% share of the US liquid refreshment beverage market in retail channels measured by Information Resources Inc., compared to Coca Cola’s 19%. However, it has less share in international markets and the “out of home” restaurant channels.
Figure 2: Representative Pepsi Cola brands
Key differences in product and geographical mix
Product mix:
Coca Cola is exclusively a beverage company, while 55% of Pepsi’s revenues come from convenient foods, with the rest from beverages.
Geographical mix:
- Coca Cola derives 34% of revenues in the US (figure 3)
- 56% of Pepsi’s revenues are generated in the US
- Canada accounts of 4% of Pepsi revenues, bringing North American revenues to 60% of total revenues (figure 4)
- 47% of Pepsi’s North American revenues is derived from convenient foods, but 67% of revenues outside of North America is derived from convenient foods (figure 5)
Figure 3: Coca Cola’s revenue mix by geography
Created by author using publicly available financial data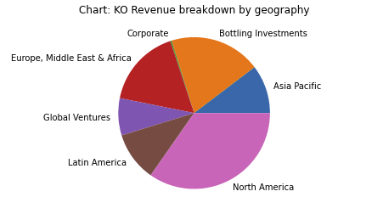
Figure 4: Pepsi’s revenue mix by geography
Created by author using publicly available financial data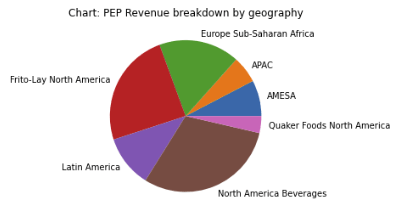
Figure 5: Detailed breakdown of Pepsi’s revenue mix
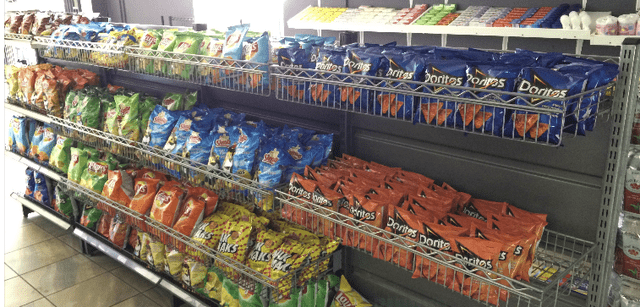
Both companies have extensive global distribution. I have seen Coca Cola crates stacked high in some fairly remote parts of Indonesia, and shelves lined with Pepsi snacks in a convenience store in Alexandra–one of the poorest urban areas in South Africa (figure 6).
Figure 6: Shelves of a convenience store in Alexandra in Johannesburg, South Africa
Historical returns
Coca Cola and Pepsi are consumer product powerhouses, but the stock returns of both companies have underperformed the S&P 500 over the last 10, 5, and 3 years (figure 7).
Figure 7: Total return of Coca Cola and Pepsi Cola against the S&P 500 index
Returns of the S&P 500 was driven by its heavy weighting of high flying-tech stocks, which made up 28% of the index. The index’s seven largest companies by market capitalization were Apple, Microsoft, Alphabet, Amazon, Meta Platforms, Tesla, and Nvidia, which accounted for over 25% of the index.
I am not counting on either company to outperform the high-flying tech stocks or the S&P 500 index. Instead, I see them as diversifiers in my portfolio that should deliver a steady and satisfactory return over the long haul.
Economic characteristics
Powerful brands
- Consumers have been conditioned to associate quality with and emotional attachment to products from both companies–Coca Cola with “Drink Happiness”, Pepsi with “that’s what I like”, Frito Lay with tasty and convenient snacks, and Quaker Oats as food that is good for the heart.
Demand price inelasticity
- The price point of each individual serving is sufficiently low that consumers in developed countries generally view the purchase of Coca Cola and Pepsi beverages as a necessity even though they could easily get their hydration straight out of a kitchen faucet for nothing.
- The premium commanded by the branded product (e.g., Coca Cola or Frito Lay) over an unbranded equivalent is de minimis.
Growing global population and rising affluence
- The growth in global population (currently +1.1% annually) enlarges the size of Coca Cola and Pepsi’s market; and
- The rising affluence in emerging economies make these products increasingly affordable luxuries. Interestingly, my observation is that the soda consumption in a country is dependent on its per capita GDP only up to a certain level. In 2012–the latest year the data was made available by Coca Cola–four of the top 10 countries by per capita consumption had annual per capita GDP around or just below the global average per capita GDP of $11,500 (figure 8), while one of them, Bolivia, had substantially lower per capita GDP than the global average. According to Coca Cola’s 2018 annual report, Mexico, the country with the largest per capita consumption of KO products, has an annual per capita GDP of just $9,700 but an annual per capita consumption of 728 servings (i.e., about 2 servings per day)-almost twice that of the United States, which has a per capita annual GDP of $56,000 but an annual per capita consumption of “only” 400 servings.
Figure 8: per capital consumption of top 10 countries in 2012
Coca Cola 2012 annual report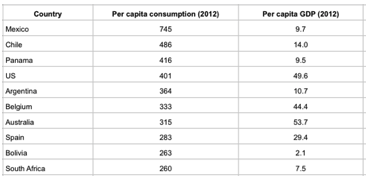
Room for growth in global per capita consumption
- Warren Buffett-one of its largest shareholders-pointed out at a Berkshire Hathaway annual meeting some years ago that studies have shown that Coca Cola has no “taste memory”, i.e., consumers do not get satiated or fatigued with Coca Cola easily compared other beverages (like coffee or orange juice).
- Furthermore, Coca Cola and Pepsi account for less than 6% of the global hydration market. As such, there is still room for growth in global per capita consumption of cola and other beverages.
Unit case volume–an important measure of the health of the system–has steadily increased over the years (figure 9). Over the last 20 years, Coca Cola’s unit case volume increased at a compounded annual growth rate of 2.9%, and has only declined on two occasions:
(1) in 2017 due to the deconsolidation of German bottling operations in May and the refranchising of several bottling territories in North America, which required that Coca Cola Bottling Investments eliminate sales of non-company-owned and licensed brands sold by these bottlers from its case volume (as stated in Coca Cola’s 2016 10-K filing: “for non-Company-owned and licensed beverage products sold in the refranchised territories for which the Company no longer reports unit case volume, we have eliminated the unit case volume from the applicable base year when calculating volume growth rates on a consolidated basis as well as for the North America and Bottling Investments operating segments”); and
(2) in 2020 at the start of the COVID-19 outbreak due to restaurant closures, after which it rebounded strongly.
Barring a renewed push to tax the sale of sugared beverages that we have seen in some cities in the US, there is much room to grow per capita daily consumption around the world.
Figure 9: Coca Cola unit case volume year-over-year growth
Created by author using publicly available financial data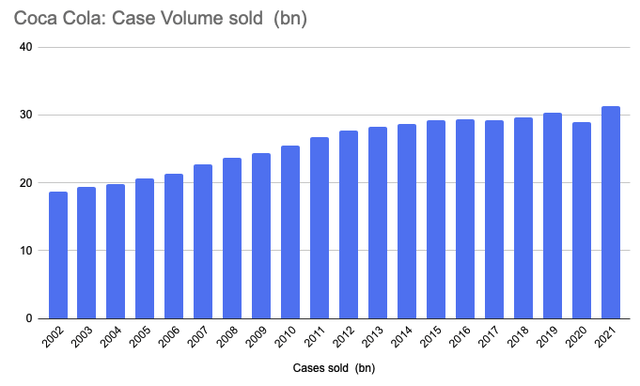
High operating leverage
- Both companies outsource portions of their manufacturing and distribution to third party bottlers and manufacturers (for example, Coca Cola has 225 bottling partners and 900 bottling plants worldwide, most of which it does not own). As such, they are well-positioned to benefit from strong operating leverage
Wide competitive moats
- The combination of the companies’ brand names, distribution delivery system, and shelf space are not easily replicated, nor are they prone to disruption by digital technologies. This prompted Warren Buffett to say many years ago when the market cap of Coca Cola was substantially lower than it is today,
“if you gave me $100 billion and said take away the soft drink leadership of Coca-Cola in the world, I’d give it back to you and say it can’t be done.”
Analysis of consolidated financials
Revenue and EBITDA comparison
Pepsi’s revenues is almost twice that of Coca Cola (figure 10, orange and blue lines). However, Coca Cola’s EBITDA (dashed lines) and free cash flow (dotted lines) are higher than Pepsi’s.
Coca Cola’s revenues declined from 2015 through 2018 despite continue increase in unit case volume due to the deconsolidation of its German bottler into Coca Cola European Partners and the refranchising of bottling territories in North America (both of which require the company cease reporting the sales on its consolidated statements), the sale of its energy brands and discontinuation of its Glaceau energy brands as part of its 2015 transaction with Monster Beverages, as well as the transition of its Russian juice operations to a joint venture.
Pepsi’s revenues has been on a long term secular growth trend. However, it also also ticked down in 2015 and 2016 following the 3Q 2015 deconsolidation of its Venezuela subsidiaries due to the change in the business environment in the country. This reduced Latam consolidated 2015 and 2016 net revenues by 13% and 17% respectively.
(For the accounting geeks: following the deconsolidations, the companies’ controlling stakes were transferred into Equity Method Investments / Investments in Noncontrolled Affiliates).
Figure 10: Revenue and EBITDA comparison
Created by author using publicly available financial data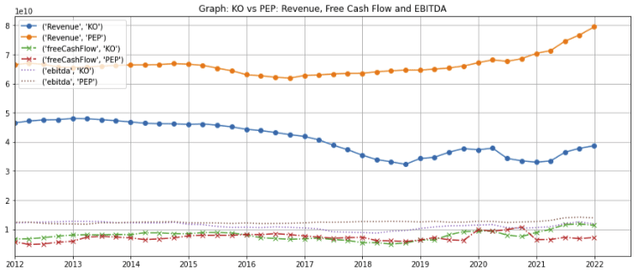
Both companies have relatively strong EBITDAs margins due to their “asset light” business strategies in which they license their brands, sell concentrates, and outsource the more asset intensive manufacturing and distribution functions to third party bottlers. Coca Cola’s margins are higher as it outsources more of its manufacturing and distribution to independent bottlers than Pepsi (figure 11). (Pepsi states that “Either independently or in conjunction with third parties, [division] makes, markets, distributes and sells [products]”, but does not provide the same level of information on its third-party bottlers in its SEC filings as Coca Cola. However, I note that (1) Pepsi acquired its two largest bottles–Pepsi Bottler Group and Pepsi Americas–in 2009 and merged them into a wholly-owned subsidiary; (2) In 2021, Pepsi has 309,000 employees worldwide compared to Coca Cola’s 79,000, of which 129,000 and 9,400 respectively were located in the US; and (3) the gross/net PPE (plant property and equipment) on its 2021 year-end balance sheet were $48.8 billion / $24.4 billion, two and a half times Coca Cola’s gross/net PPE of $18.8 billion / $9.9 billion. Conversely, Coca Cola’s Equity Method Investments, which account for its unconsolidated ownership stakes in independent bottlers, was $17.6 billion, significantly higher than Pepsi’s $2.6 billion).
Pepsi’s EBITDA margins have stayed within a narrow 18-20% range. Coca Cola’s EBITDA declined in 2015 and 2016 due to the deconsolidations and Monster transaction described above but rebounded in 2018 due to the sharp reduction in selling and distribution expenses resulting from its refranchising activities (figure 12, line 3).
Figure 11: EBITDA margin comparison
Created by author using publicly available financial data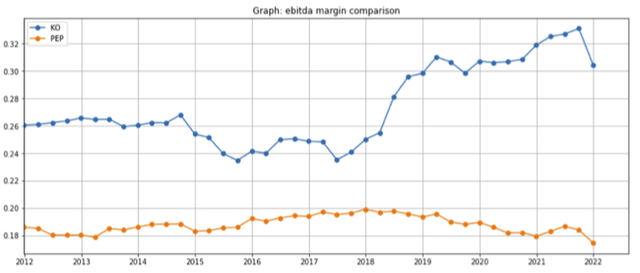
Figure 12: Coca Cola’s SGA (selling, general, and administrative) expenses
Aggressively returning cash to shareholders
In addition to paying out dividends (Coca Cola stock currently yields 2.9%, Pepsi yields 2.6%), both companies have also been aggressive buyers of their own stock. Over the last 10 years, Coca Cola has reduced its share count by almost 7%, while Pepsi has reduced its share count by ~13% (figure 13, blue and orange lines respectively).
Figure 13: Share count reduction comparison
Created by author using publicly available financial data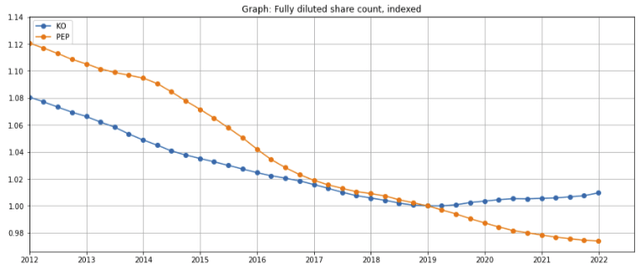
Financial metrics on a per-share basis
For the 3-year period from 2018 to 2021, Pepsi’s per-share revenue has outgrown Coca Cola’s (figure 14)
Figure 14: Per-Share Revenue growth comparison
Created by author using publicly available financial data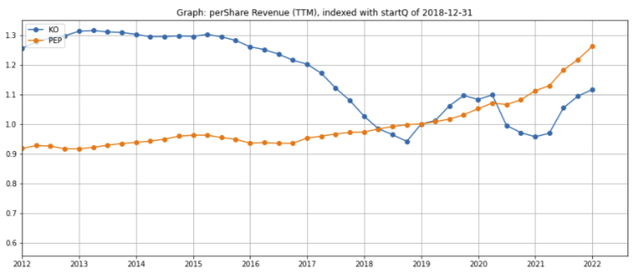
However, over the same 3-year period, Coca Cola’s per-share EBITDA has grown at a similar rate as Pepsi (figure 15) and free cash flow appears to be accelerating (figure 16).
Figure 15: Per-Share EBITDA growth comparison
Created by author using publicly available financial data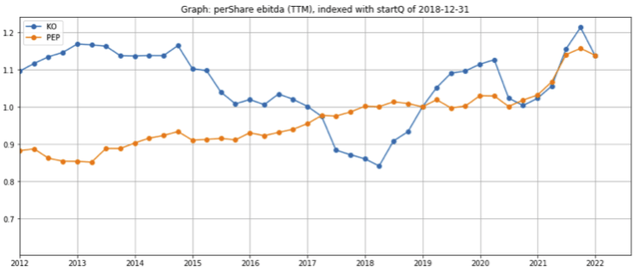
Figure 16: Per-Share Free Cash Flow growth comparison
Created by author using publicly available financial data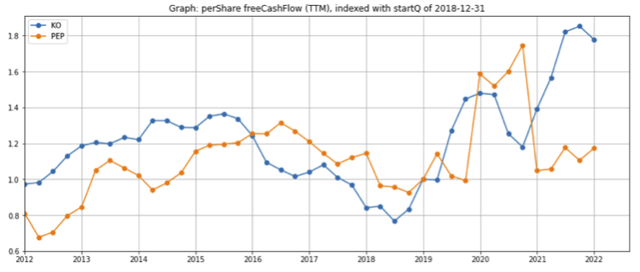
Comparison of growth, margins, and resilience
Market Segmentation
Coca Cola is segmented into 4 geographical regions. Each of these regions makes up more than 10% of total revenues and operating income, with the following geographical breakdown:
|
Coca Cola business line |
% of total revenues |
% of operating income |
|
North America |
48% |
31% |
|
Europe, Middle East, & Africa |
23% |
32% |
|
Latin America |
15% |
25% |
|
Asia Pacific |
14% |
14% |
(Revenues from Coca Cola’s bottling investments and Global Ventures makes up 27% the firm’s revenues but less than 10% of operating profit. I have excluded both from this table as the company does not further break either of these line items down by geography)
I view Pepsi as consisting of 6 business lines (for simplicity, I think of Frito Lay North America and Quaker Foods North America as one business link as both are food business and Quaker is comparatively small). Of these six business lines, four make up for at least 10% of total revenues and operating income.
|
Pepsi business line |
% of total revenues |
% of operating income |
|
North American foods (Frito Lay & Quaker Foods) |
28% (FL 25% + QF 3%) |
47% (FL 43% + QF 4%) |
|
North American beverages |
32% |
19% |
|
Europe |
16% |
11% |
|
Latin America |
10% |
11% |
|
AMESA (Africa, Middle East, and South Asia) |
8% |
7% |
|
APAC (Asia Pacific) |
6% |
5% |
Financial analysis by segment
North America Revenues
Pepsi’s North American revenues for both its beverage and food businesses (figure 17, orange, green, and red lines) are meaningfully higher than Coca Cola’s North American revenues (blue line) and been growing at a faster pace since 2018 (figure 18).
Figure 17: Comparison of North American revenues
Created by author using publicly available financial data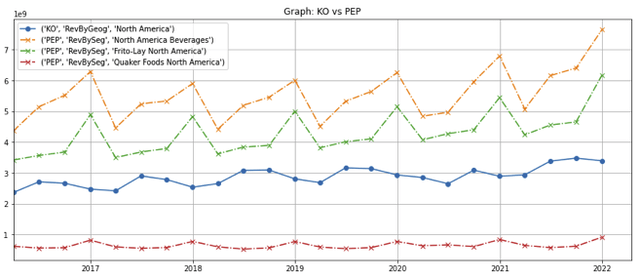
Coca Cola’s North American revenues took a bigger hit than Pepsi’s during the COVID-19 pandemic lockdowns due to its heavier weighting towards out of home restaurant consumption but has recovered strongly. Pepsi North America’s beverage sales were weighted towards in-home consumption, which was less affected by lockdowns. Pepsi’s convenient foods business benefited from the lockdown as consumers increased their purchases for in-home consumption.
Figure 18: Comparison of North American revenues (TTM), indexed to 4Q2018
Created by author using publicly available financial data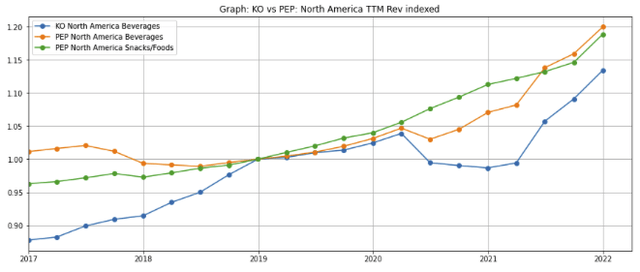
Operating margins
Historically, Frito Lay North America’s operating margins have averaged around 30% (figure 19, dashed green line) while Coca Cola’s North American operating margins have averaged in the mid-20% range (blue solid line). Pepsi’s North American Beverage operating margins (orange dashed line) are comparatively thinner (~10%) and have been declining over the past 5 years. Forbes attributed this margin decline to neglect of the core brands in a 2018 article, but it appears to be bottoming out in 2020.
Figure 19: Comparison of North American operating margins
Created by author using publicly available financial data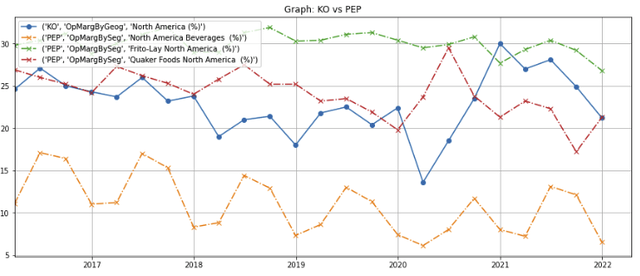
Operating Income
Frito Lay North America has generated strong and growing operating income (figures 20 and 21, green lines) due to its wide margins and revenue growth, and is an important growth driver for Pepsi.
Coca Cola’s North American operating income rebounded in 2020 as volumes recovered from the COVID-19 pandemic and is likely to be a growth driver for the company (blue line).
Pepsi North America Beverage generates similar operating income as Coca Cola (orange line) despite having almost twice the revenues compared to Coca Cola (blue solid line). As Pepsi North America Beverage’s operating income margins have been down over the last 6 years, operating income has been flat over the period despite its revenue growth and is unlikely to be a major value driver until the company turns the margins turn around.
Figure 20: Comparison of North American operating income
Created by author using publicly available financial data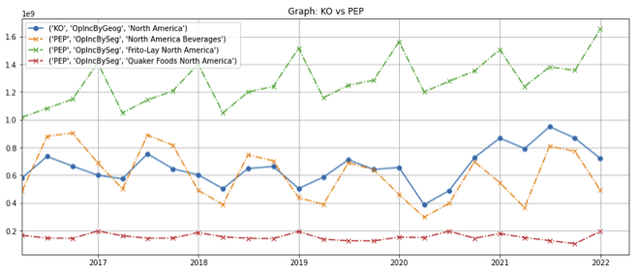
Figure 21: Comparison of North American operating income (TTM), indexed to 4Q2018
Created by author using publicly available financial data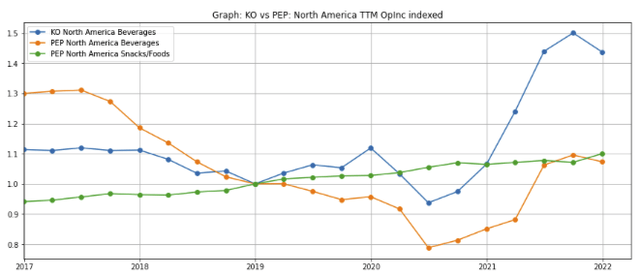
International markets
Revenues
Coca Cola derives substantially all its international revenues from beverages. In contrast, Pepsi’s international divisions other than Europe derive 70-90% of revenues from convenient foods.
|
Region |
% of revenues from convenient foods |
% of revenues from beverages |
|
Europe |
45% |
55% |
|
Latam |
90% |
10% |
|
APAC |
80% |
20% |
|
AMESA |
70% |
30% |
Pepsi has higher revenues in its international markets (figure 22, dotted lines) compared to Coca Cola (solid lines).
Figure 22: Comparison of international revenues
Created by author using publicly available financial data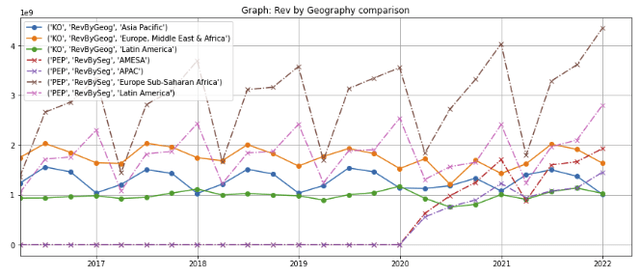
Note: Pepsi APAC and AMESA were reported as separate segments after 2020. Both were previously included in a separate segment that is no longer reported.
Furthermore, Pepsi (figure 23, dotted lines) has outgrown Coca Cola (solid lines) in both the Europe Sub-Saharan Africa and Latin American markets. However, both companies’ European revenues will be down as they pull out Russia in response to its invasion of Ukraine. (Russia is Pepsi’s third largest market after the US and Mexico, so the revenue hit will be significant).
Figure 23: Comparison of international revenues (TTM), indexed to 4Q 2018
Created by author using publicly available financial data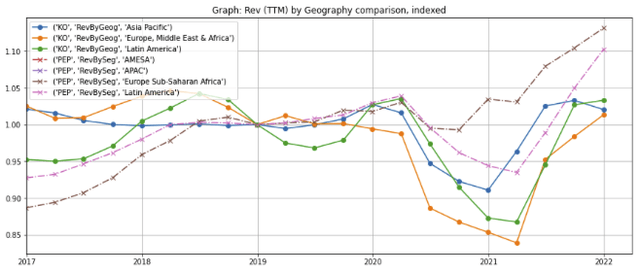
Note: Pepsi APAC and AMESA are not indexed as they were reported as separate segments after 2020
Operating Margins
Coca Cola’s international businesses have significantly higher operating income margins (figure 24, solid lines) compared to Pepsi (dashed line), largely due to Coca Cola’s heavier use of independent bottlers for manufacturing and distribution. (To illustrate, in 2021, Coca Cola had just $6.5 billion in long-lived assets outside the United States, compared to Pepsi’s $26 billion)
Coca Cola’s five top independent bottling partners, which represented 41 percent of total unit case volume, were predominantly overseas:
- Coca Cola FEMSA, serving Latin America
- Coca Cola Europe Pacific Partners PLC, serving Western Europe, Australia, Pacific, and Indonesia
- Coca Cola Hellenic, serving Eastern Europe
- Arca Continental, serving Latin America and parts of North America, and
- Swire Beverages, serving Asia and part of North American
Even though Pepsi’s international businesses (dashed lines) have lower operating margins than its North American business (dotted line), I believe Pepsi’s international margins will expand as revenue grows due to operating leverage.
Figure 24: Comparison of international operating income margins
Created by author using publicly available financial data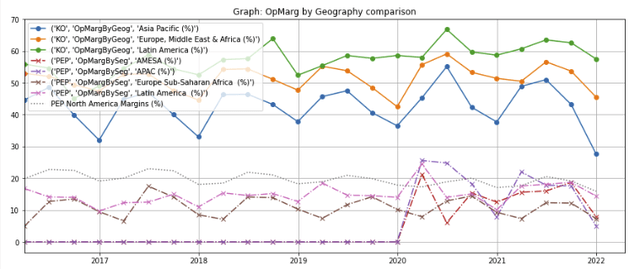
Note: Pepsi began reporting APAC and AMESA as separate segments only after 2020
Operating Income
As a result of its higher margins, Coca Cola generates more operating income internationally (figure 25, solid lines) than Pepsi (dotted lines).
Figure 25: Comparison of international operating income
Created by author using publicly available financial data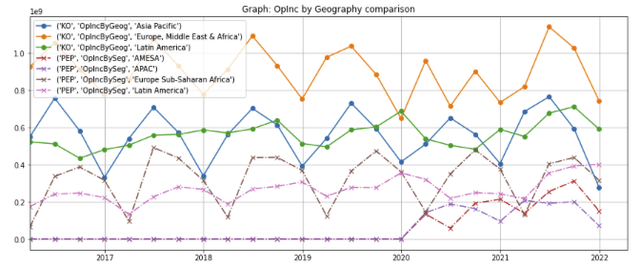
Note: Pepsi began reporting APAC and AMESA as separate segments after 2020
Coca Cola’s operating income for its three international divisions (figure 26, solid lines) have recovered from the COVID-19 pandemic and are above pre-COVID levels. Even though operating income for Pepsi’s Latam division has re-bounded strongly from COVID-related charges (pink dashed line), the operating income for its Europe Sub-Saharan Africa (brown dashed line), APAC, and AMESA divisions have dipped back below pre-COVID levels due to higher operating and commodity costs as well as higher marketing and advertising expenses.
Figure 26: Comparison of international operating income (TTM), indexed to 4Q 2018
Created by author using publicly available financial data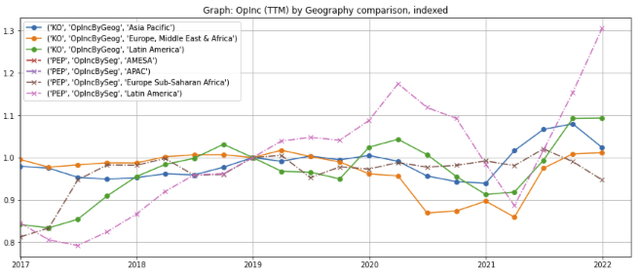
Revenue resilience
Both Coca Cola and Pepsi have shown steady growth in North America over the last 6 years. However, Pepsi has proven to be more resilient through the 2020 COVID-19 pandemic outbreak because both its snack food and beverage businesses are more heavily weighted towards home consumption. In comparison, Coca Cola, which is more exposed to out of home restaurant consumption, took a bigger hit in 2020 when the lockdowns caused restaurants across the US and Canada to be shut for a period of time (figures 27 and 28).
Figure 27: North American segments: year-over-year revenue change
Created by author using publicly available financial data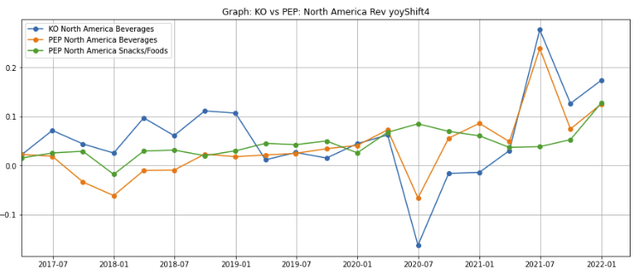
Figure 28: North American revenue comparison, grouped by quarter
Created by author using publicly available financial data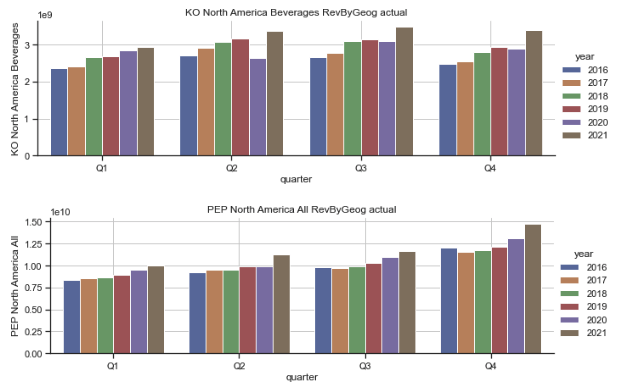
Pepsi’s international segments have taken less of a hit in 2020 through the early stages of the COVID-19 outbreak than Coca Cola (figure 29, dashed lines) for similar reasons, although Coca Cola has rebounded more strongly is 2021 with the re-opening of economies around the world.
Figure 29: International segments: year-over-year revenue change
Created by author using publicly available financial data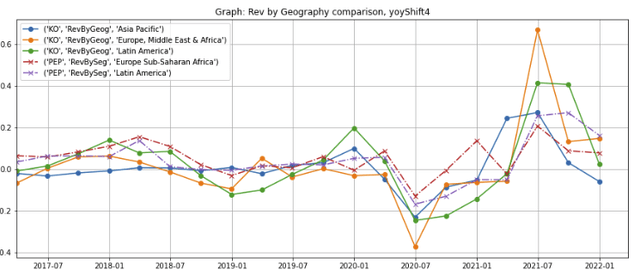
Valuation
Coca Cola’s free cash flow yield (figure 30, blue line) has ticked up and is currently over 4%. In comparison, Pepsi’s free cash flow yield of ~3% is near a 5-year low.
Figure 30: Free cash flow yields
Created by author using publicly available financial and stock price data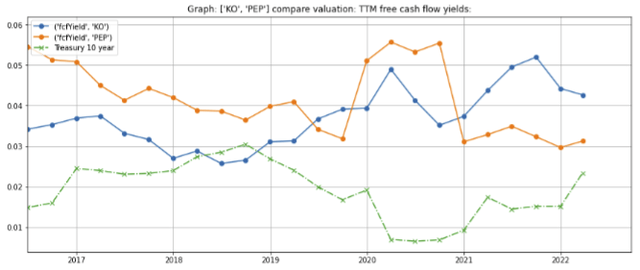
The earnings yield (the reciprocal of the price earnings ratio) for both companies are in the 3-4% range (figure 31).
Figure 31: Earnings yields (= 1/PE ratio)
Created by author using publicly available financial and stock price data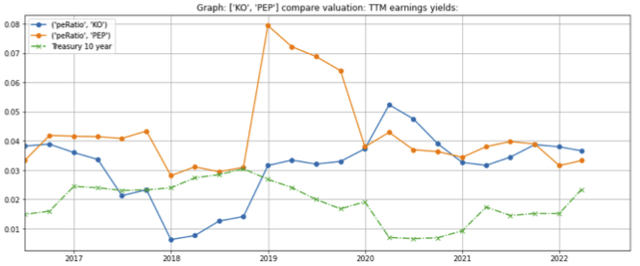
Stock price stability
According to Valueline, Coca Cola’s stock price volatility, as measured by the 5-year beta coefficient, is 0.9, higher than Pepsi’s stock price, which has a 5-year beta coefficient of 0.8.
During the March 2020 market meltdown caused by the COVID-19 pandemic outbreak, Coca Cola stock was harder hit than Pepsi (figure 32, blue line vs orange line), and took longer recover than both Pepsi and the S&P 500.
Figure 32: Stock price vs S&P in 2020 COVID downturn
Created by author using publicly available stock price data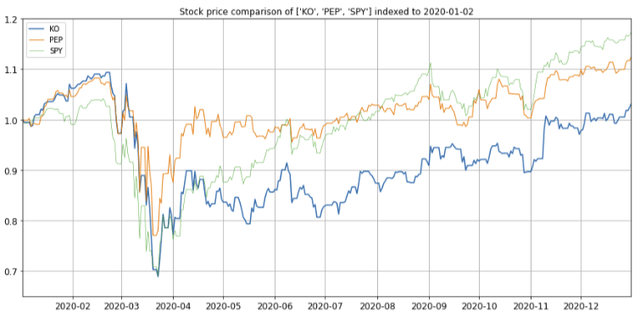
However, in the market pullback resulting from the Federal Reserve interest hikes and the Russian invasion of Ukraine, Coca Cola stock held up surprisingly well compared to both Pepsi and the S&P 500 (figure 33, blue line vs orange and dotted green lines), and remains above January 2, 2022 levels.
Figure 33: Stock price vs S&P in 1Q 2022 downturn (due to interest rate hikes and Russian invasion of Ukraine)
Created by author using publicly available stock price data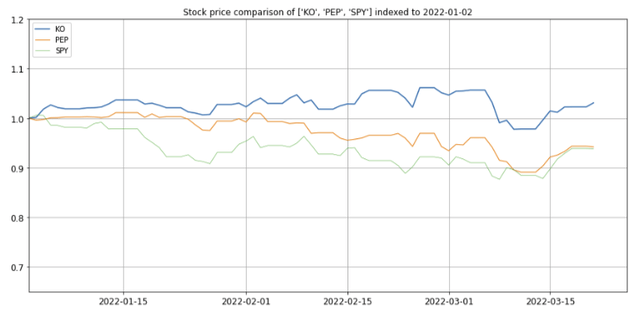
Concerns
My biggest concerns are:
(1) Valuation compression due to rising interest rates;
(2) Ability to pass commodity price inflation on to consumers;
(3) Another COVID variant or global pandemic curtailing consumption; and
(4) Movement against sugared beverages and highly salted snack foods.
Summary
Coca Cola and Pepsi both own powerful global brands, enjoy price inelasticity and wide competitive moats, and will benefit from long term demographic socio-economic growth and operating leverage.
Coca Cola is the global beverage leader with an “asset light” strategy that has greater exposure to the growing international markets and out of home restaurant consumption.
As the global leader in snacks, Pepsi will grow as consumers demand more convenient and tasty foods. It is also the #2 player in beverages and is weighted towards in home consumption.
Coca Cola has higher margins, but Pepsi has historically demonstrated more resilience in downturns. However, Pepsi’s valuation is higher on a free cash flow yield basis compared to Coca Cola.
I would not expect either to vastly outperform the S&P500 over the long term, but both are highly likely to offer an attractive risk-adjusted return over the 10-year treasury rate.




Be the first to comment