

FreezeFrames
On Thursday, October 27, 2022, Appalachian natural gas producer CNX Resources Corporation (NYSE:CNX) announced its third quarter 2022 earnings results. At first glance, the company’s results appeared to be mixed, as it delivered substantial year-over-year revenue growth but a net loss. This is very different from many other energy companies, as most have been reporting substantial profits due to the high prices for both oil and natural gas. This is especially true for natural gas producers, as the price of that compound has appreciated much more than the price of crude oil.
However, net income is not exactly the most important measure of financial performance for many of these companies, and when we look beyond the headline numbers, we can see that CNX Resources delivered reasonably respectable results. However, it does still have a lot of work to do shoring up its balance sheet and generating growth if it is to truly impress investors. The company does trade for a remarkably low valuation, though, so there could still be an opportunity for someone to make substantial gains as the company’s story plays out over the coming several quarters.
As my long-time readers are no doubt well aware, it is my usual practice to share the highlights from a company’s earnings report before delving into an analysis of its results. This is because these highlights provide a background for the remainder of the article as well as serve as a framework for the resultant analysis. Therefore, here are the highlights from CNX Resources’ third-quarter 2022 earnings results:
- CNX Resources brought in total revenue of $1.1786 billion in the third quarter of 2022. This represents a substantial 88.27% increase over the $626.0 million that the company brought in during the prior-year quarter.
- The company reported an operating loss of $207.3 million in the most current quarter. This compares quite favorably to the $1.1811 billion operating loss that the company reported in the year-ago quarter.
- CNX Resources produced an average of 1.5909 billion cubic feet of natural gas equivalent during the reporting period. This represents a 4.66% decline compared to the 1.6687 billion cubic feet of natural gas equivalent that the company produced on average during the corresponding quarter of last year.
- The company reported a free cash flow of $135 million in the current quarter. This represents a slight increase over the $130 million that it had last year.
- CNX Resources reported a net loss of $427.1 million in the third quarter of 2022. This compares quite favorably to the $872.9 million net loss that the company reported in the third quarter of 2021.
It seems quite likely that the first thing that anyone reviewing these highlights will notice is that CNX Resources generally saw improvement in most measures of financial performance. This is not exactly unexpected, as most energy companies that have reported managed to post fairly significant year-over-year growth. The biggest driver of this has been natural gas prices. Over the past year, natural gas at Henry Hub is up 4.60%:
Business Insider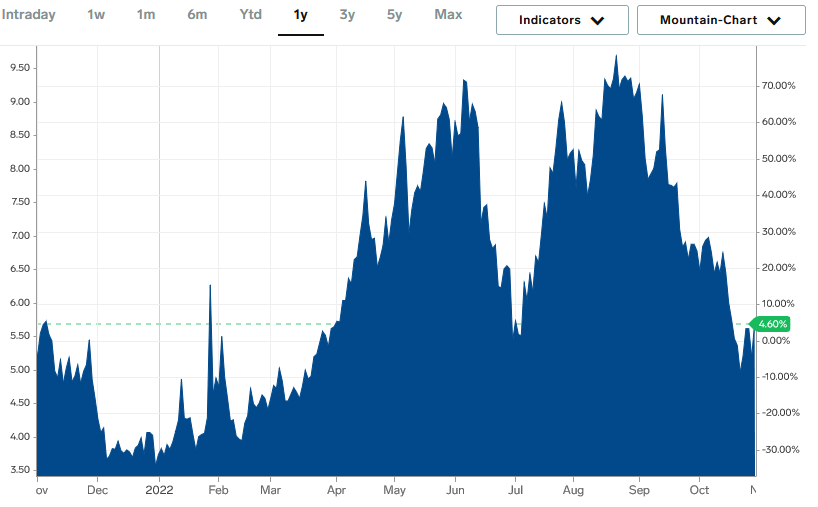
This does not tell the whole story here, though. As we can clearly see above, natural gas prices generally declined during the third quarter so, during the reporting quarter, they were substantially higher than today’s prices. This is quite evident by looking at CNX Resources’ realized prices, which are the average prices that it actually sold its products for during the quarter. The company states that it achieved a realized natural gas price of $7.82 per thousand cubic feet of natural gas equivalent sold compared to $3.61 per thousand cubic feet of natural gas equivalent sold in the year-ago quarter. It should be fairly obvious how this would result in improved financial performance. After all, if the company received more money for each unit of product it sold, then all else being equal it will bring in more total revenue. This results in more money being available to cover the company’s costs and make its way down to the company’s cash flow and profits.
However, we can also see from looking at the highlights that not all else was equal, which is fairly typical for this industry. In particular, CNX Resources saw its production decline year-over-year. This would act as a drag on revenue because the company would have fewer products to sell and receive money for. The decline was a not particularly significant 4.66%, though, so the cause of the decline could have been pretty much anything, including the timing of wells coming online. As I pointed out in a previous article, one of the biggest problems with shale energy production is that the wells have an extremely high decline rate. As a result, a company like CNX Resources that operates in America’s shale plays needs to constantly drill new wells if it is to simply maintain its production. Thus, it could see production swings like we see here if it fails to do that or even if a few of its newly drilled wells are not as productive as its older wells were when they first came online.
A look at the company’s 10-Q filed with the SEC confirms this, but the company said nothing about it in the press release. I am sure that many busy investors do not want to dig through such a large document in order to uncover such a relevant piece of information, so it would have been nice for the company to include this information in the press release.
One of the advantages of the high natural gas prices that we have been seeing is that it allows CNX Resources to maintain very high margins. We can see this by looking at the company’s cost of production. The company reports that it costs approximately $1.64 per thousand cubic feet of natural gas equivalent to producing its product. That is obviously well below the company’s selling price during the period, which lends itself well to producing significant profits. This is what allowed the company to generate the $135 million free cash flow that it reported during the quarter.
CNX Resources has largely been using this money to reward its investors. Unlike many of its peers, though, it is not doing it by issuing a dividend, which is disappointing. The company instead has opted to buy back its own stock. During the third quarter, the company bought back 8.4 million shares of stock at a price of $16.51, which cost it approximately $138 million. We can see that this figure was a bit more than the reported free cash flow, which could be a sign that the company is being a bit too aggressive about buying back stock. This is something that has been continuing so far in the fourth quarter as CNX Resources has purchased 3.2 million shares since the start of October. This cost the company approximately $55 million.
With that said, the company has only bought back 46.2 million shares for approximately $687 million over the past two years. It has guided for a total of $700 million in free cash flow for the full-year 2022, so the company is likely using some of its past positive free cash flow generation to finance these buybacks in excess of the company’s current free cash flow.
I am not a fan of the stock buyback strategy to return money to shareholders. I would much rather see the company pay a dividend, even if it is a variable one. This is because dividends put money directly in the pockets of investors but share buybacks require the investor to actually sell the stock to be able to use the money that is returned to them. There is also limited evidence that share buybacks cause a stock price to increase commensurate with the amount of the buyback. A dividend also shows that management has more confidence in the future prospects of a business because dividends are not cut nearly as often as share buybacks, so it is considered to be a long-term commitment. That will likely have a bigger impact on the stock price than a buyback will. We can see evidence of this in the fact that CNX Resources is only up 11.84% over the past twelve months despite the company spending a sizable percentage of its current market capitalization on these buybacks.
In addition to the share buyback program, CNX Resources has been using some of its free cash flow to reduce its debt. This is something that many energy companies have been doing over the past few years and is nice to see. Over the past two years, CNX Resources has reduced its net debt by $303 million:
CNX Resources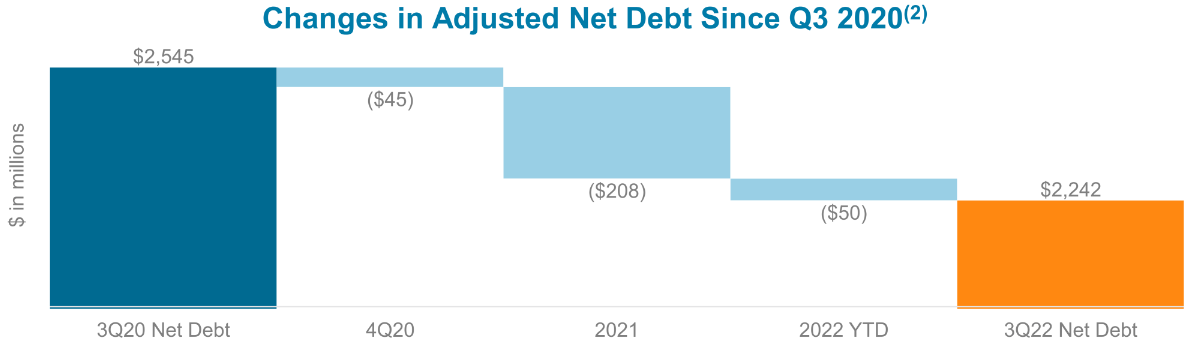
The reason that this is nice to see is that the energy sector in aggregate was very heavily levered prior to the COVID-19 pandemic. As I pointed out in a previous article, America’s shale energy producers were the largest issuers of junk-rated debt in the country over much of the past decade. This is mostly due to the high decline rate of the nation’s shale plays and the high costs of drilling wells constantly. We have seen a trend lately, though, of companies limiting their growth and instead using their free cash flow to reinforce their balance sheets. CNX Resources is clearly doing this, and it is quite nice to see.
However, the company has not made as much progress as I really want to see. We can see this clearly by looking at the company’s leverage ratio, which is also known as the net debt-to-EBITDAX ratio. This ratio essentially tells us how many years it would take the company to completely pay off its debt if it were to devote all its pre-tax cash flow to this task. As of the end of the third quarter, this ratio stood at 1.7x based on CNX Resources’ trailing twelve-month EBITDAX. This is, unfortunately, much higher than the sub-1.0x that some of the company’s best-financed peers possess. CNX Resources does plan to get this down to 1.5x by the end of 2022, but that assumes that the company devotes all of its remaining free cash flow to debt reduction. When we consider how dedicated the company appears to be to its buyback program, that is likely to be a pipe dream. As already mentioned too, the best-financed companies in the sector have gotten their leverage ratios down well under 1.0x, so CNX Resources clearly has a great deal of work to do even should it achieve the 1.5x ratio that management has optimistically projected.
As stated in the introduction, CNX Resources boasts an incredibly attractive valuation that may allow some investors to overlook a few of my criticisms above. One metric that we can use to see this attractive valuation is the price-to-earnings growth ratio. This ratio is a modified version of the traditional price-to-earnings ratio that takes the company’s earnings per share growth into account. Generally, a price-to-earnings growth ratio of less than 1.0 is a sign that the stock may be undervalued relative to its forward earnings per share growth and vice versa.
According to Zacks Investment Research, CNX Resources will grow its earnings per share at a 26.12% rate over the next three to five years. This gives the stock a price-to-earnings growth ratio of 0.23 at the current stock price. This is clearly 1.0 and is thus a very real sign that the stock is substantially undervalued at the current price. However, as I have pointed out in various previous articles, pretty much everything in the traditional energy sector is significantly undervalued at the current stock prices. Thus, it may make sense to compare CNX Resources’ valuation to that of some of its peers in order to determine which company offers the most attractive valuation:
|
Company |
PEG Ratio |
|
CNX Resources |
0.23 |
|
Range Resources (RRC) |
0.18 |
|
EQT Corporation (EQT) |
0.16 |
|
Chesapeake Energy (CHK) |
0.94 |
|
Diamondback Energy (FANG) |
0.28 |
Here we see definite confirmation that pretty much the entire energy sector is significantly undervalued, although some companies are definitely more undervalued than others. CNX Resources is not the most undervalued on this list, although it is substantially more attractively valued than Chesapeake Energy. When we consider how deep the valuations here are, though, CNX Resources may still be quite attractive despite a few of the faults that I discussed in this article. The fair valuation of the stock is $71.04, which would represent a substantial gain over the $16.34 current price. This clearly could induce many people to want to own the stock!
In conclusion, CNX Resources showed the significant year-over-year growth that we have come to expect from energy companies over the past year or two. The company has been using its newfound free cash flow to reduce the debt as well as attempt to reward the shareholders with share buybacks, although I would very much prefer a dividend. It does have a lot of work to do with debt reduction, though, as the firm’s debt is still well above a few of its strongest peers.
These are mostly minor complaints, though, as the company’s results were overall good and it is reasonably strong financially. When we consider the incredibly low valuation, it may be worth adding CNX Resources to a portfolio today.
Be the first to comment