

Igor Kutyaev
China’s latest activity surveys looked weak – in part due to weaker global demand – but surging construction/infrastructure can improve the growth outlook in H2.
China Slowdown
China’s first activity survey for Q3 was disappointing. The official manufacturing PMI1 (Purchasing Managers’ Index) dropped back into the contraction zone (49.0) after spending just 1 month above 50.0, and the services PMI moderated more than expected (53.8). Details show that the deterioration was widespread – all manufacturing PMI sub-indices except two were in contraction territory, including large companies, employment, imports, and new orders. An uptick in the number of COVID cases is one plausible explanation, especially as regards services. The weaker consumer sentiment due to the ongoing uncertainty in the housing market is another likely reason.
Global Growth Headwinds
Many commentators also drew attention to growth headwinds created by weaker global demand. This narrative was corroborated by the fact that China’s new export orders PMI moved deeper into the contraction zone (47.4). South Korea’s daily export growth – an often-used global activity gauge – also showed virtually no signs of a sequential rebound after a very weak print in June. Further, the latest batch of activity surveys in DM (developed markets) was generally weaker than expected. And, finally, there are signs of an H2 growth “cliff” in parts of EM (emerging markets), with a sharp deterioration in July PMIs in Poland, the Czech Republic, Mexico, and Turkey.
China Policy Stimulus
One – by now traditional – question to ask when China’s activity surprises to the downside is whether we are going to see additional policy stimulus. The latest signal from Politburo is “not necessarily”. The numerical growth target (of around 5.5%) is being replaced by “a reasonable” growth range, with a seemingly different set of priorities (the zero-COVID policy topping the list). Another consideration here is that the infrastructure package might be bringing results – the construction PMI surged from 52.2 in May to 56.6 in June and further to 59.2 in July (see chart below). This might not generate a stratospheric rebound in H2, but we can easily see stronger growth that will be less balanced (i.e. driven by investments/infrastructure rather than consumption) but nevertheless no longer heading south. Stay tuned!
Chart at a Glance: China Growth – Construction to the Rescue?
Bloomberg LP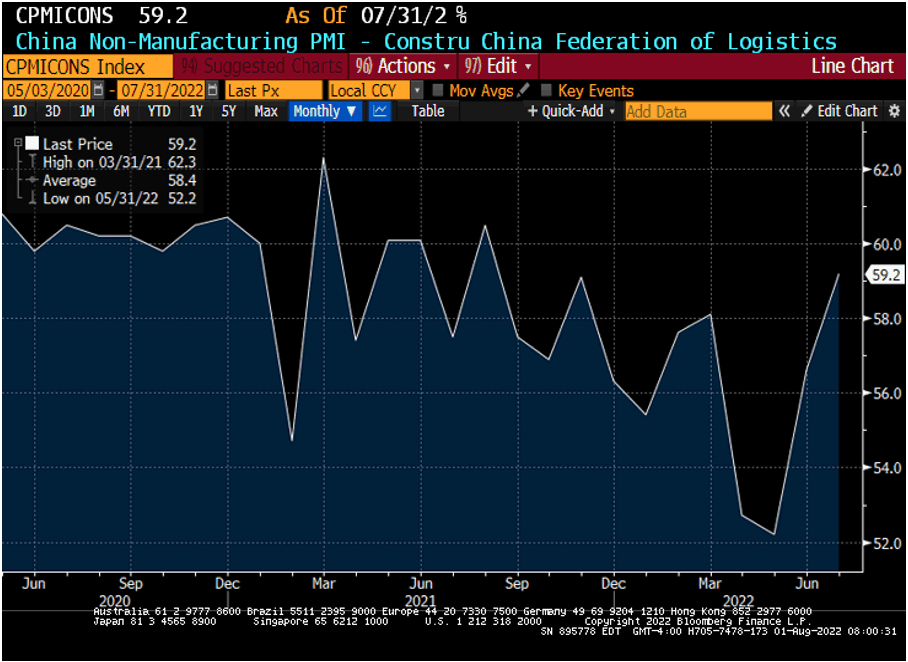
1We believe PMIs are a better indicator of the health of the Chinese economy than the gross domestic product (GDP) number, which is politicized and is a composite in any case. The manufacturing and non-manufacturing, or service, PMIs have been separated in order to understand the different sectors of the economy. These days, we believe the manufacturing PMI is the number to watch for cyclicality.
PMI – Purchasing Managers’ Index: economic indicators derived from monthly surveys of private sector companies. A reading above 50 indicates expansion, and a reading below 50 indicates contraction; ISM – Institute for Supply Management PMI: ISM releases an index based on more than 400 purchasing and supply managers surveys; both in the manufacturing and non-manufacturing industries; CPI – Consumer Price Index: an index of the variation in prices paid by typical consumers for retail goods and other items; PPI – Producer Price Index: a family of indexes that measures the average change in selling prices received by domestic producers of goods and services over time; PCE inflation – Personal Consumption Expenditures Price Index: one measure of U.S. inflation, tracking the change in prices of goods and services purchased by consumers throughout the economy; MSCI – Morgan Stanley Capital International: an American provider of equity, fixed income, hedge fund stock market indexes, and equity portfolio analysis tools; VIX – CBOE Volatility Index: an index created by the Chicago Board Options Exchange (CBOE), which shows the market’s expectation of 30-day volatility. It is constructed using the implied volatilities on S&P 500 index options.; GBI-EM – JP Morgan’s Government Bond Index – Emerging Markets: comprehensive emerging market debt benchmarks that track local currency bonds issued by Emerging market governments; EMBI – JP Morgan’s Emerging Market Bond Index: JP Morgan’s index of dollar-denominated sovereign bonds issued by a selection of emerging market countries; EMBIG – JP Morgan’s Emerging Market Bond Index Global: tracks total returns for traded external debt instruments in emerging markets.
The information presented does not involve the rendering of personalized investment, financial, legal, or tax advice. This is not an offer to buy or sell, or a solicitation of any offer to buy or sell any of the securities mentioned herein. Certain statements contained herein may constitute projections, forecasts and other forward-looking statements, which do not reflect actual results. Certain information may be provided by third-party sources and, although believed to be reliable, it has not been independently verified and its accuracy or completeness cannot be guaranteed. Any opinions, projections, forecasts, and forward-looking statements presented herein are valid as the date of this communication and are subject to change. The information herein represents the opinion of the author(s), but not necessarily those of VanEck.
Investing in international markets carries risks such as currency fluctuation, regulatory risks, economic and political instability. Emerging markets involve heightened risks related to the same factors as well as increased volatility, lower trading volume, and less liquidity. Emerging markets can have greater custodial and operational risks, and less developed legal and accounting systems than developed markets.
All investing is subject to risk, including the possible loss of the money you invest. As with any investment strategy, there is no guarantee that investment objectives will be met and investors may lose money. Diversification does not ensure a profit or protect against a loss in a declining market. Past performance is no guarantee of future performance.
Editor’s Note: The summary bullets for this article were chosen by Seeking Alpha editors.
Be the first to comment