

Justin Sullivan/Getty Images News
Introduction
Chevron Corp. (NYSE:CVX) released its fourth-quarter and full-year 2021 on January 28, 2022.
1 – 4Q21 and full-year 2021 Results snapshot
CVX reported adjusted fourth-quarter earnings per share of $2.56, missing analysts’ expectations compared to a loss of $0.33 per share in the year-ago period. The company generated revenues of $48.13 billion in 4Q21 compared to $25.25 billion in 4Q20.
Income from the Upstream and the Downstream segments totaled $5.2 billion and $760 million, respectively, below the estimated $5.3 billion and $1 billion.
Revenues were boosted by higher commodity prices and also the result of better-than-anticipated production volumes, reaching 3,117K Boep/d in 4Q21.
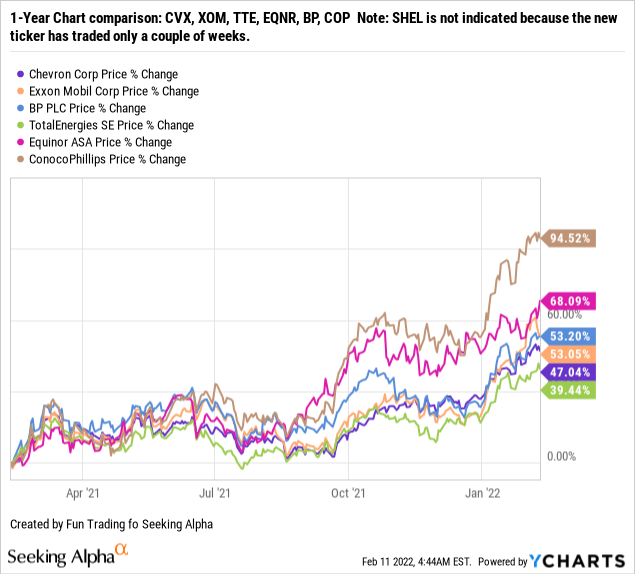
Chevron is one of my selected senior oil companies and offers a 4.09% dividend yield. Below is the chart comparison with Chevron’s peers.
CVX chart comparison EV and Dividend (Fun Trading)
2 – Stock performance
The stock performance has not been the best in this group. However, the stock is now up over 47% on a 1-year basis, lagging slightly behind Exxon Mobil (NYSE:XOM) and most of its peers.
3 – Investment Thesis
The investment thesis remains the same quarter after quarter. The company is a solid long-term investment and should be accumulated on any weakness.
I am delighted that the company managed to keep its dividend at the same level during last year’s oil crash and even managed a slight increase recently. This attitude shows a great deal of control from management where Shell Plc (NYSE:SHEL), BP Plc (NYSE:BP), and Equinor (NYSE:EQNR) failed to demonstrate when they cut their dividend by over 60%. Shareholders of those companies are still paying the price with a dividend well below the pre-pandemic level despite a massive jump in net income and free cash flow in 2021.
The oil and gas industry has recovered strongly throughout 2021, with oil prices reaching their highest levels in years. While the industry’s recovery is better than expected, uncertainty remains over market dynamics in the coming years.
In short, the oil sector cannot avoid volatility, and periods of euphoria follow periods of despair. It is the nature of the beast, and nothing can change that.
Oil prices were on fire the last Friday after the market learned that Russia was ready to invade Ukraine.
If Russia did invade Ukraine, the Biden Administration would have to choose between sanctioning Russia’s oil exports and keeping retail gasoline prices at American pumps from reaching the stratosphere.
Gasoline prices are already higher than the Administration would like, particularly as Biden’s disapproval rating approaches 60%.
Sanctions on Russia would be devastating for both the Biden Administration and the American consumer—but it would also cause great hardship to Russia, which relies a great deal on crude oil revenue for its budget.
I believe Putin is bluffing, and he has no intention to proceed with a bloody invasion that could trigger substantial adverse reactions from the rest of the World and trap him in a never-ending conflict. Putin is smart, and as a good Russian, he is a good chess player who knows its limits.
It is a perfect Grey Swan event that had already produced positive repercussions for the oil industry but could turn around quickly.
Nassim Taleb wrote in his book “The Black Swan: The Impact of the Highly Improbable.” that a Grey Swan Event is:
A grey swan is a highly probable event with three principal characteristics: it is predictable; it carries an impact that can easily cascade; and, after the fact, we concoct an explanation that recognizes the probability of occurrence, but shifts the focus to errors in judgment or some other human form of causation.
Nassim Taleb also talks about Black Swan (highly improbable) and White Swan (certain) events, but I consider those events not fitting to the situation.
Hence, the end game for oil is likely to go down as soon as the market realizes that Putin is bluffing and has already won.
Hence I recommend keeping a core long-term position but using 60% of your position to trade short-term LIFO is crucial. It is the most efficient strategy with such cyclical stocks facing a Grey swan event.
Chevron Corp.: Financials Table 4Q21: The Raw Numbers
| Chevron Corp | 4Q20 | 1Q21 | 2Q21 | 3Q21 | 4Q21 |
| Revenues in $ Billion | 24.84 | 31.08 | 36.12 | 42.55 | 45.86 |
| Total Revenues and other income in $ Billion | 25.25 | 32.03 | 37.60 | 44.71 | 48.13 |
| Net income in $ Billion | -0.67 | 1.38 | 3.082 | 6.111 | 5.055 |
| EBITDA $ Billion | 3.73 | 6.66 | 9.14 | 12.57 | 11.94 |
| EPS diluted in $/share | -0.33 | 0.72 | 1.60 | 3.19 | 2.63 |
| Cash from operating activities in $ Billion | 2.24 | 4.20 | 6.95 | 8.58 | 9.50 |
| Capital Expenditures in $ Billion | 2.07 | 1.75 | 1.80 | 1.91 | 2.60 |
| Free Cash Flow in $ Billion | 0.17 | 2.45 | 5.16 | 6.67 | 6.90 |
| Total cash $ Billion | 5.63 | 7.11 | 7.56 | 6.03 | 5.64 |
| Total debt in $ Billion | 44.32 | 45.44 | 43.02 | 37.35 | 31.37 |
| Dividend per share in $ | 1.29 | 1.34 | 1.34 | 1.34 | 1.42* |
| Shares outstanding (diluted) in Billion | 1.911 | 1.916 | 1.92 | 1.92 | 1.92 |
| Oil Production | 4Q20 | 1Q21 | 2Q21 | 3Q21 | 4Q21 |
| Oil Equivalent Production in K Boep/d | 3,277 | 3,121 | 3,126 | 3,034 | 3,117 |
| Oil U.S. Upstream incl. Permian K Boep/d | 1,195 | 1,076 | 1,136 | 1,127 | 1,216 |
| Permian only K Boep/d | 611 | 547 | 577 | 623 | 681 |
| Total liquid price $/Boe | 33.00 | 47.70 | 54.08 | 57.81 | 63.00 |
Sources: Company release
Note: Chevron raised its quarterly dividend by 6% to $1.42 per share (or $5.68 per share annualized).
Analysis: Revenues, Earnings Details, Free Cash Flow, Debt, And Upstream/Downstream Production
1 – Quarterly revenues and other income were $48.13 billion in 4Q21
CVX: Chart Revenues history (Fun Trading)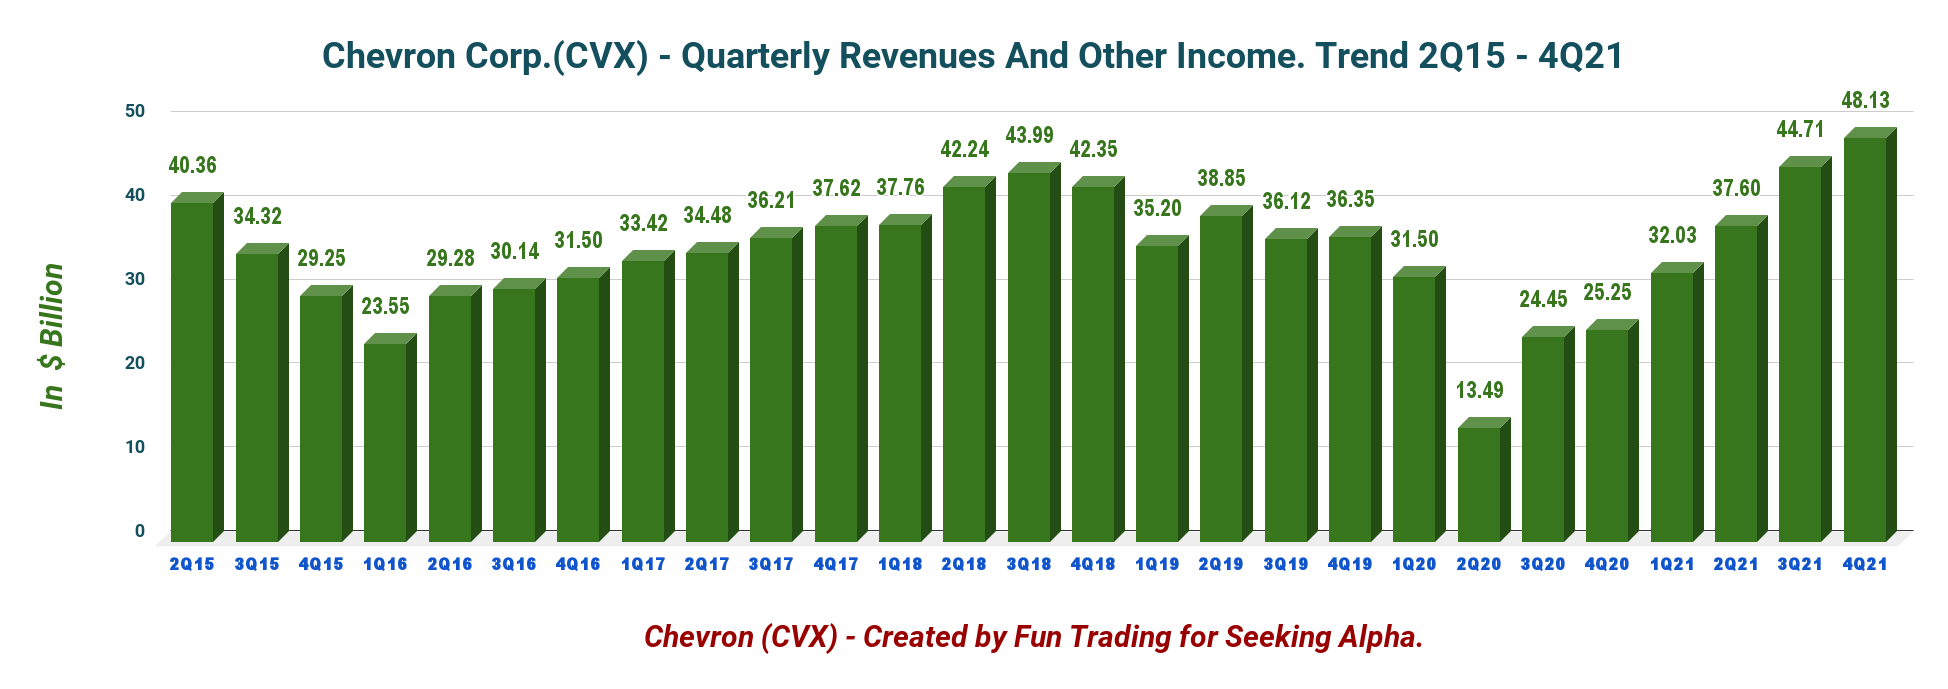
Fourth-quarter revenues and other income were $48.129 billion, up from $25.246 billion the same quarter a year ago and up 7.6% sequentially.
The adjusted earnings were $4.9 billion, or $2.56 per share. The net income was $5,055 million compared to a loss of $665 million last year.
CVX Presentation highlight Q4 (Chevron Corp.)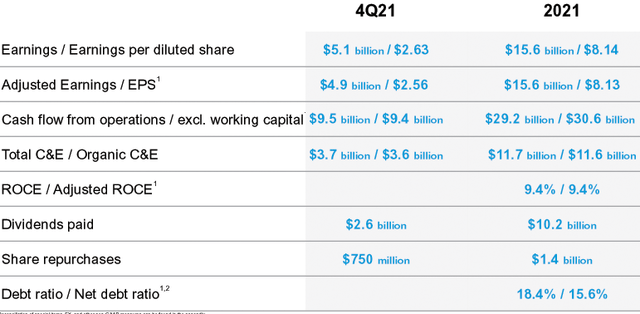
It was a good quarter but shy of expectations. CFO Pierre Breber said in the conference call:
We reported fourth quarter earnings of $5.1 billion or $2.63 per share. Adjusted earnings were $4.9 billion or $2.56 per share. The quarter’s results included 3 special items: asset sale gains of $520 million, primarily on sales of mature conventional assets in the U.S.; losses on the early retirement of debt of $260 million, which will result in significant future interest cost savings; and pension settlement costs of $82 million.
Earnings details and trend
| CVX Earnings repartition in $ billion | 4Q20 | 1Q21 | 2Q21 | 3Q21 | 4Q21 |
| Upstream | 0.50 | 2.45 | 3.18 | 5.14 | 5.16 |
| Downstream | 0.34 | 0.05 | 0.84 | 1.31 | 0.76 |
| Other | -0.17 | -0.98 | -0.94 | -0.33 | -0.86 |
Source: CVX filing. Fun Trading.
2 – Free cash flow (not including divestitures) was $6.90 billion in 4Q21
CVX: Chart FCF History (Fun Trading)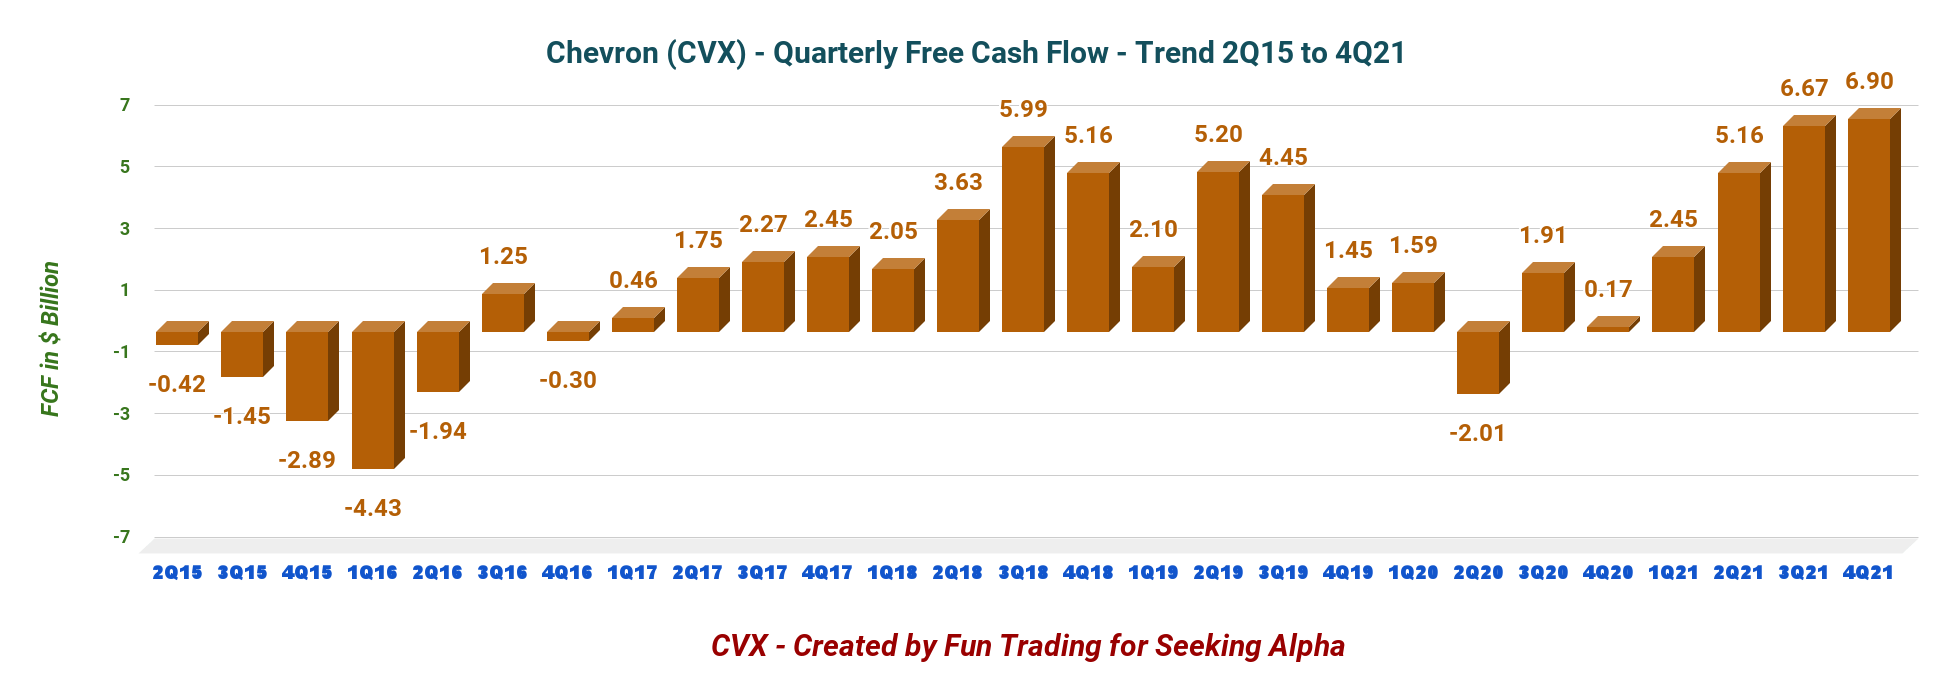
Note: Generic free cash flow is cash flow from operations minus CapEx.
Trailing twelve-month free cash flow for Chevron was $21.179 billion (excluding divestitures). The company’s free cash flow for the fourth quarter was $6.9 billion, up from $171 million in the same quarter a year ago. Please look at the chart above.
The annual dividend is $5.42 per share and is based on 1.922 billion shares outstanding diluted.
Dividend cash costs are now $10.2 billion per year, lower than free cash flow. The dividend yield is now 4.09%. Chevron bought back $1.4 billion worth of its shares in 2021.
CVX Presentation – Share buyback (Chevron Corp.)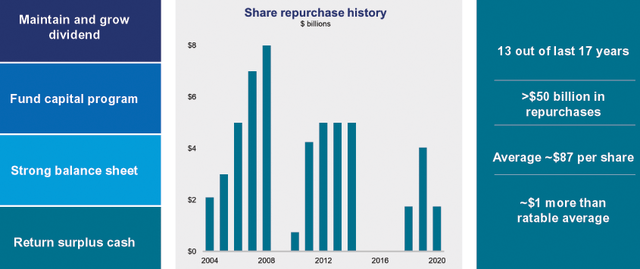
3 – Net Debt is down to $25.73 billion in 4Q21
CVX: Cash and debt history (Fun Trading)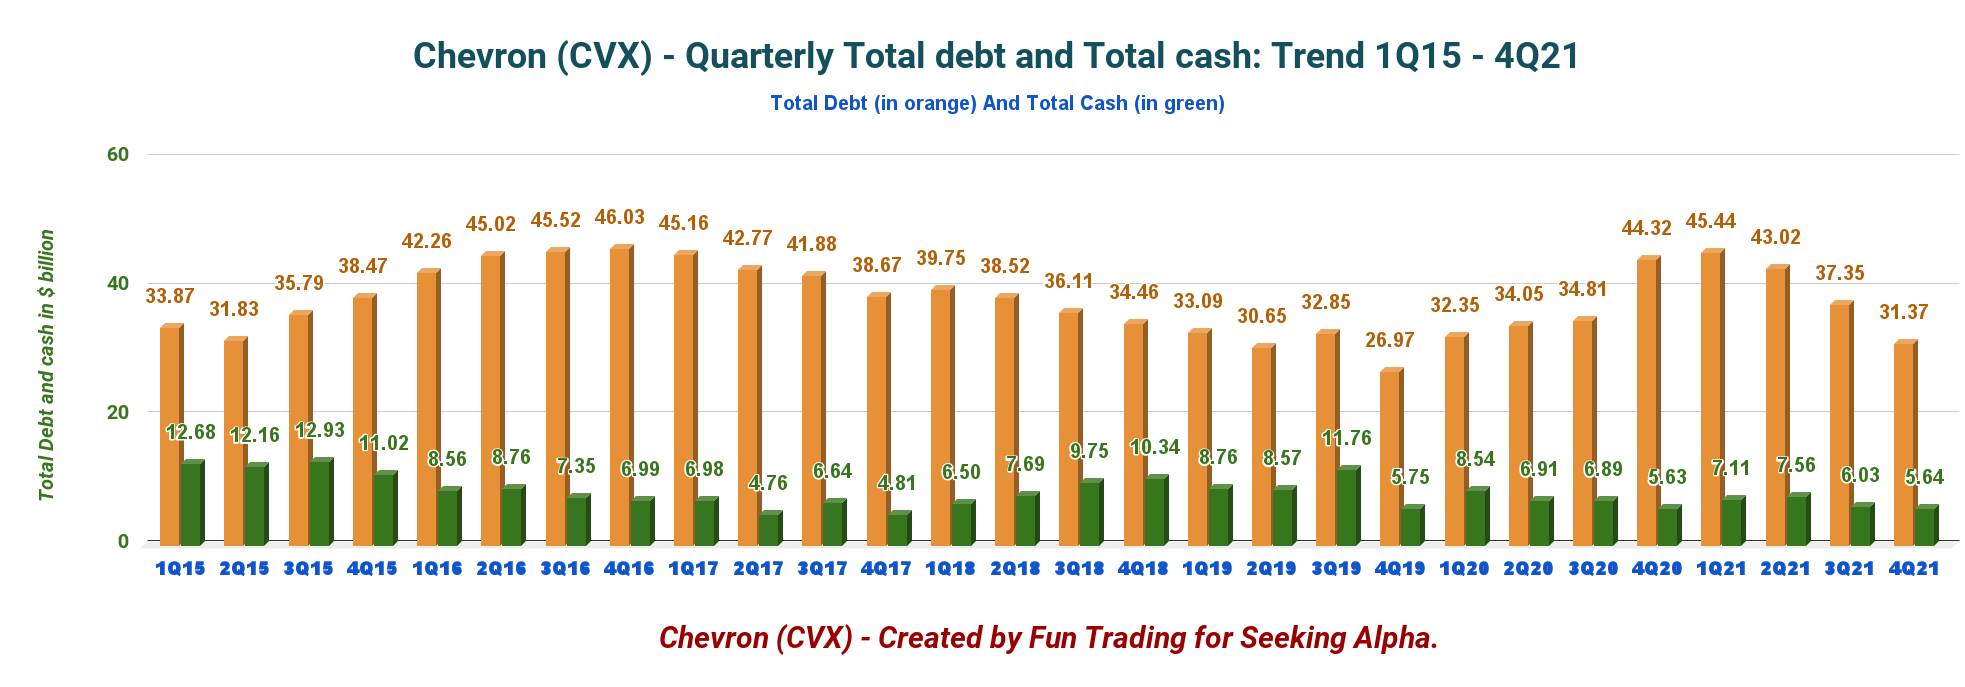
As of December 31, Chevron Corp. had $5.64 billion in cash and cash equivalents and total debt of $31.369 billion, with a total debt-to-total capitalization of 18.4%. Chevron’s net debt was down to $25.73 billion in 4Q21.
4 – Oil Production and Downstream Details
CVX: Quarterly Production history (Fun Trading)
Chevron posted a fourth-quarter production of 3,117K Boep/d, down 4.9% from the same quarter a year ago and up 2.7% sequentially. Liquid represents 59% of the total output.
The year-over-year decline was due to divestments, entitlement effects, and the end of the Rokan concession in Indonesia. The impact of those adverse events was offset by strength in the Permian Basin, the absence of weather-related drops in the Gulf of Mexico, and lower production curtailments.
The U.S. upstream reached 1,216K Boep/d or 39% of the total output.
Chevron’s upstream segment registered a profit of $5.16 billion in the fourth quarter of 2021, well above the $501 million earned in the year-ago period when the energy sector was slowly recovering from the pandemic-induced demand collapse.
The U.S. upstream production history is shown below.
CVX: Chart US Production history (Fun Trading)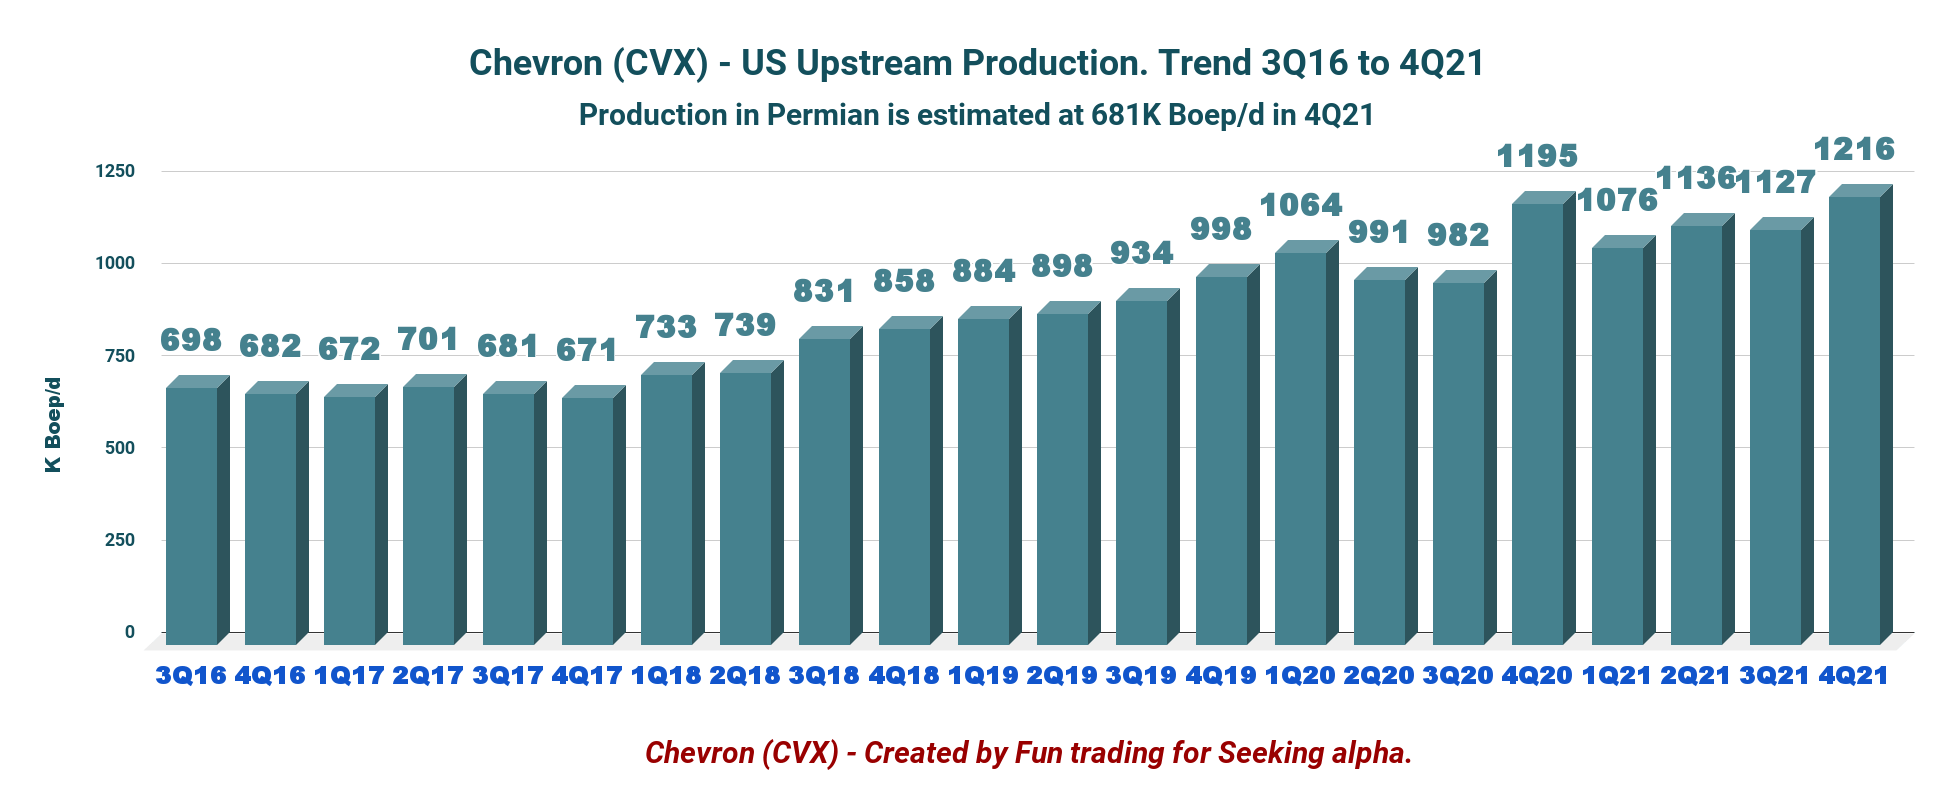
5 – Production: Discussion Per Segment
5.1. Upstream
- The Permian output is 681K Boepd, up from 611K Boepd produced in the same quarter last year. It is a new record.
CVX: Chart Permian Production history (Fun Trading)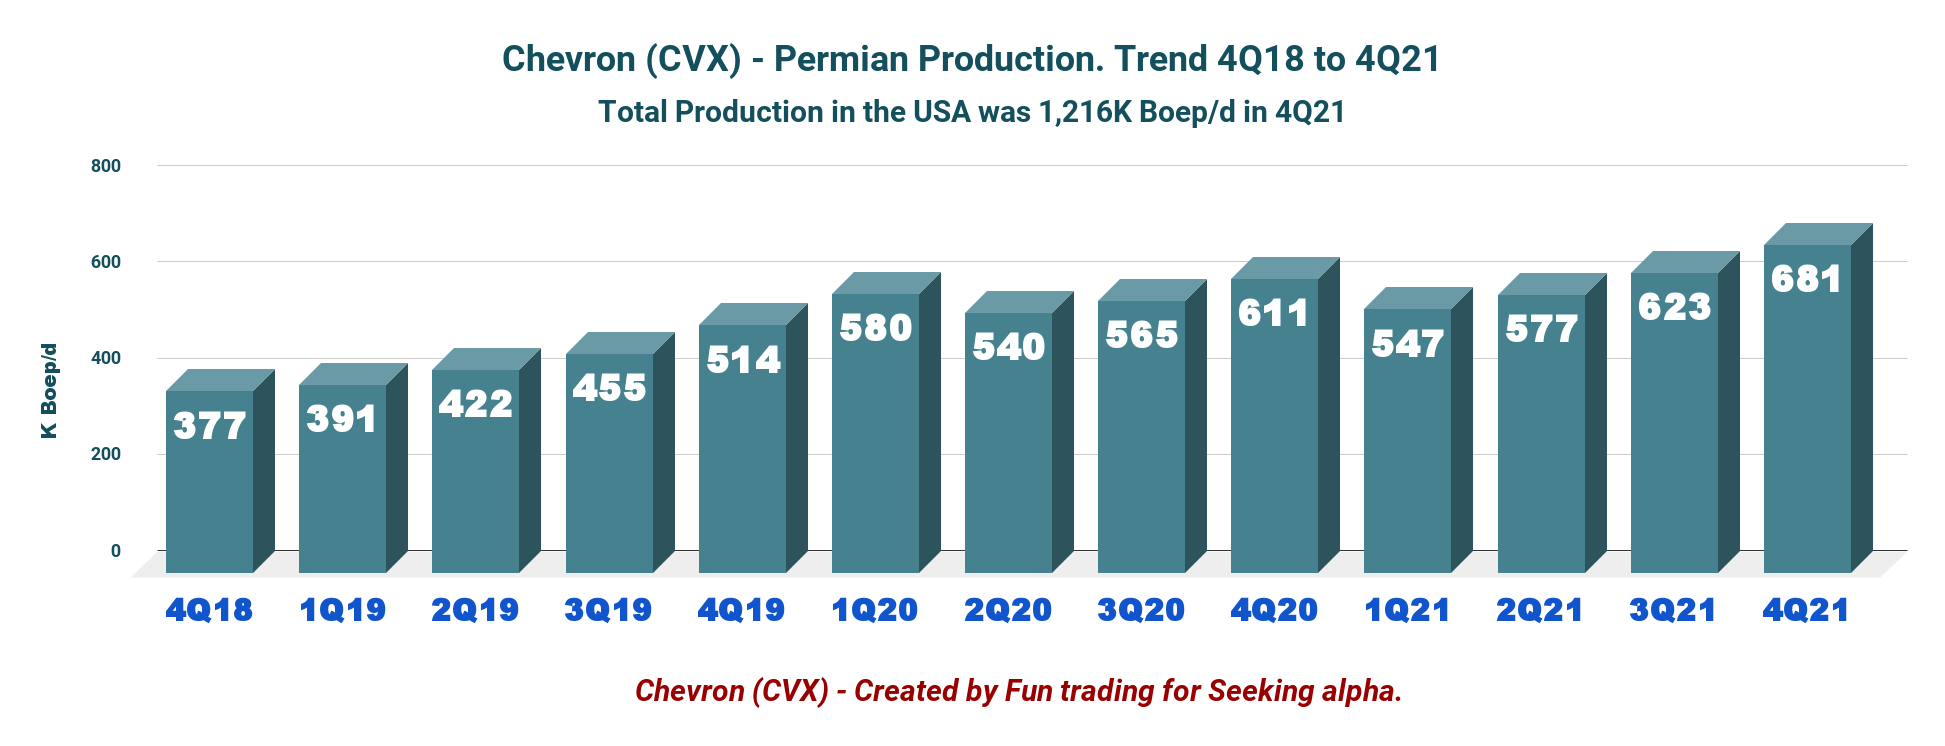
The U.S. production was up 1.8% year over year to 1,216K Boep/d, and the company’s international operations (accounting for 61% of the total) fell 8.7% to 1,901K Boep/d.
CVX: Chart global Price history (Fun Trading )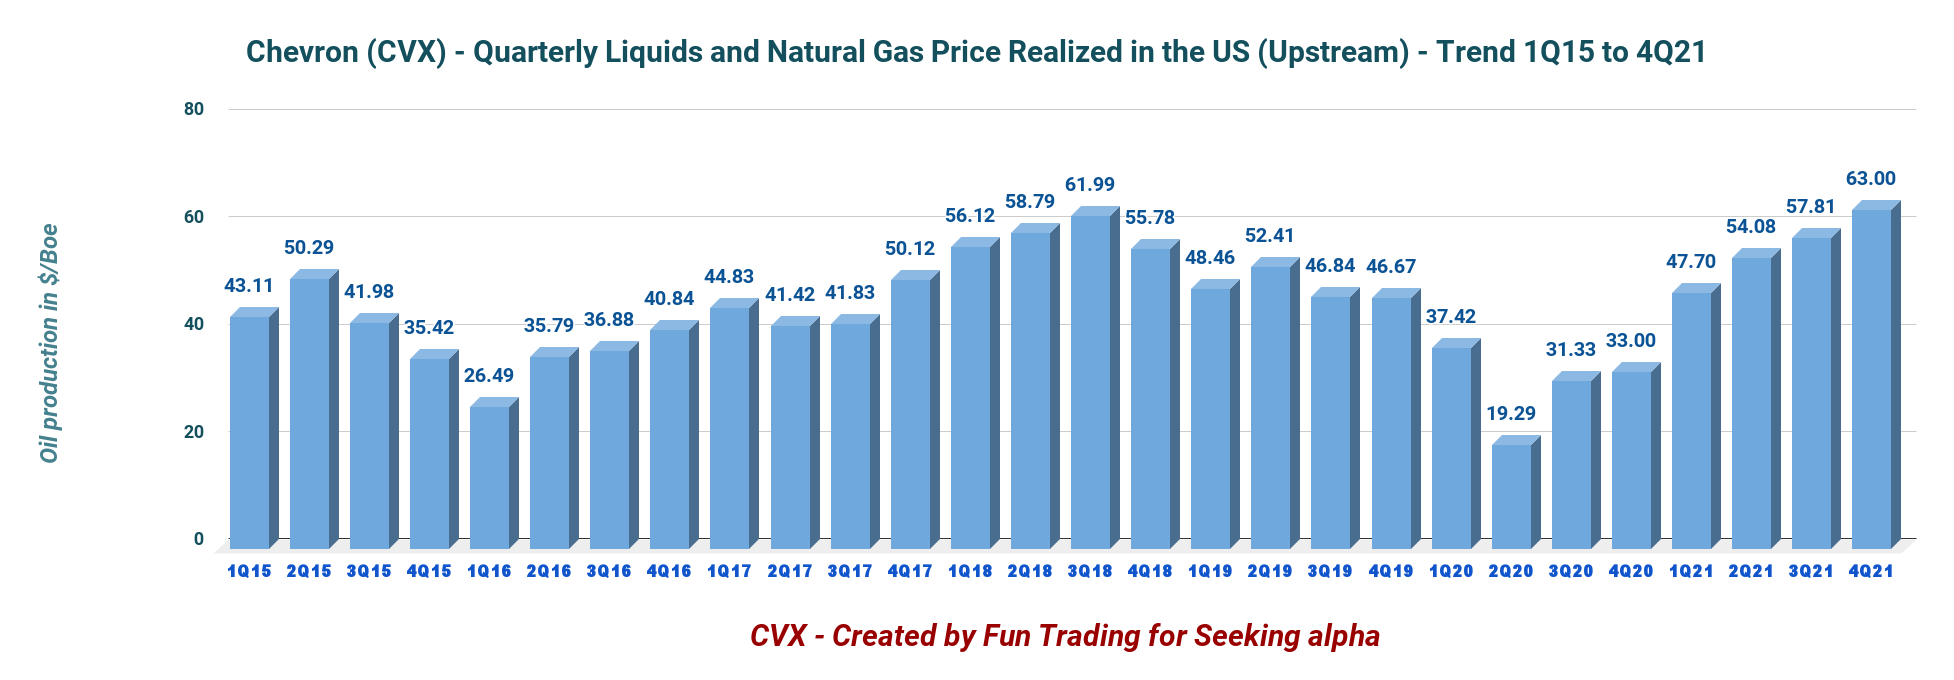
5.2. Downstream
Chevron’s downstream segment recorded a profit of $760 million in 4Q21, significantly improving last year’s loss of $338 million.
The progress resulted from higher domestic product sales improved earnings from its Chevron Phillips Chemical Company JV. Also, the company benefitted from favorable foreign currency impacts and more substantial overall margins.
6 – 2022 Outlook
CFO Pierre Breber said in the conference call:
2022 production is expected to be flat to down 3% due to expiration of contracts in Indonesia and Thailand. These contracts are not being extended as we were unable to do so in terms competitive with our alternatives. Excluding contract expirations and 2022 asset sales, we expect a 2% to 5% increase in production led by the Permian and lower turnaround activity in TCO in Australia. We reaffirm our prior long-term guidance of a 3% production CAGR through 2025, and we’ll share more about our long-term outlook at our upcoming Investor Day.
Chevron Presentation – Guidance 2022 (Chevron Corp.)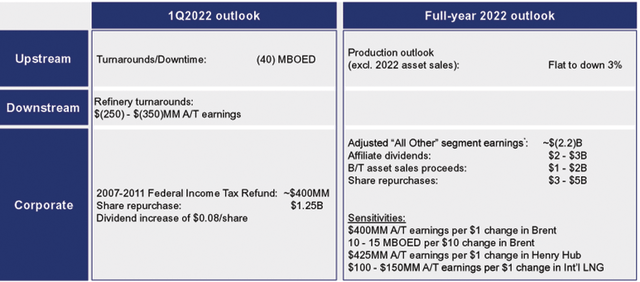
Technical Analysis And Commentary
TA Chart short-term (Fun Trading)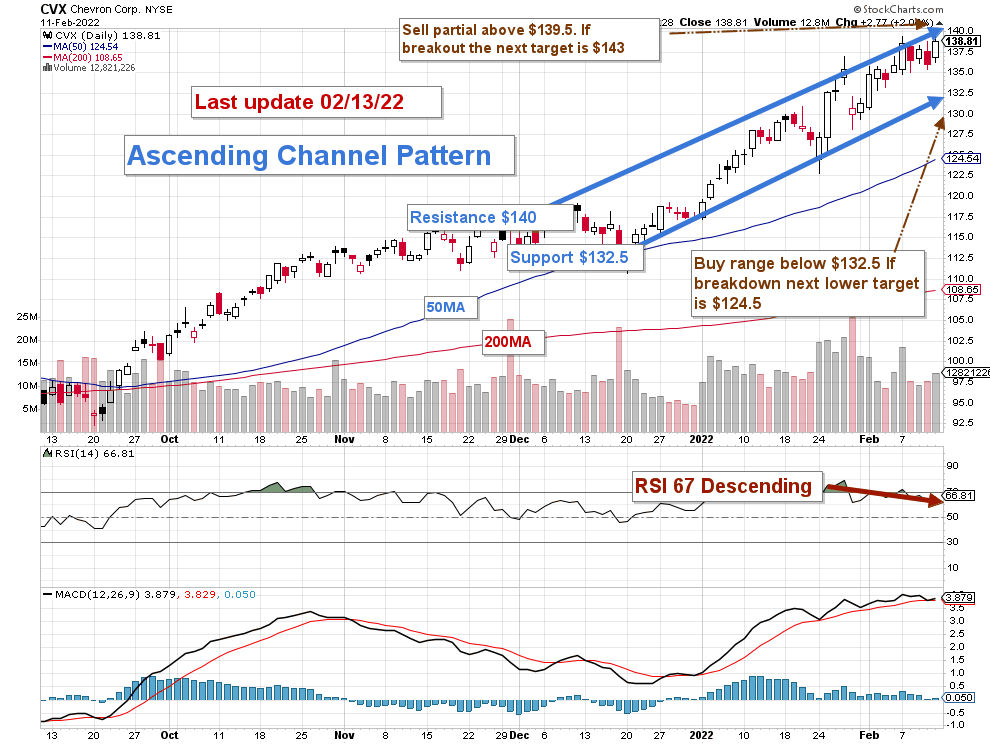
Note: The chart is adjusted for the dividend.
CVX forms an ascending channel pattern with resistance at $140 and support at $132.5.
The short-term trading strategy is to trade LIFO about 25%-35% of your position. I suggest selling between $139 and $140 and waiting for a retracement below $132.5 if possible.
Conversely, if oil prices head higher significantly above $95, continuing a solid momentum, CVX could break out and retest $142-$144.
On the downside, if oil prices turn south due to some de-escalation of the Russian invasion threat, which has been amplified by alarming warnings of the US government this week, I see CVX dropping quickly to $124.50.
Warning: The TA chart must be updated frequently to be relevant. It is what I am doing in my stock tracker. The chart above has a possible validity of about a week. Remember, the TA chart is a tool only to help you adopt the right strategy. It is not a way to foresee the future. No one and nothing can.
Author’s note: If you find value in this article and would like to encourage such continued efforts, please click the “Like” button below as a vote of support. Thanks!
Be the first to comment