

Maddie Meyer/Getty Images News
It’s been a brutal year thus far for the restaurant industry, and we’ve seen this reflected in the AdvisorShares Restaurant ETF (EATZ) performance, which is down 21% year-to-date after underperforming the S&P-500 (SPY) in 2021 as well. The poor performance can be attributed to restaurant brands dealing with weaker traffic trends due to tighter discretionary budgets, with consumers in a much worse position than last year. At the same time, they’re being hit by inflationary pressures, with wage and commodity inflation weighing on margins. Not surprisingly, Cheesecake Factory (NASDAQ:CAKE) has been one name that’s taking a beating, with it being less inflation-resistant due to a non-franchised model.
The good news is that after a 55% decline, the stock remains reasonably valued, and despite a disappointing Q2 report, the stock failed to make new lows. This often suggests that the bad news is priced into the stock already, with the reaction to the news often being more important than the news itself at extremes. Meanwhile, industry commentary appears to be cautiously optimistic that inflation may have peaked this summer, and staffing levels continue to improve, potentially reducing overtime/training costs. That said, while CAKE might be better positioned than some peers, I don’t see it as a Buy just yet.
North Italia – Menu Offerings & Restaurant (Company Presentation)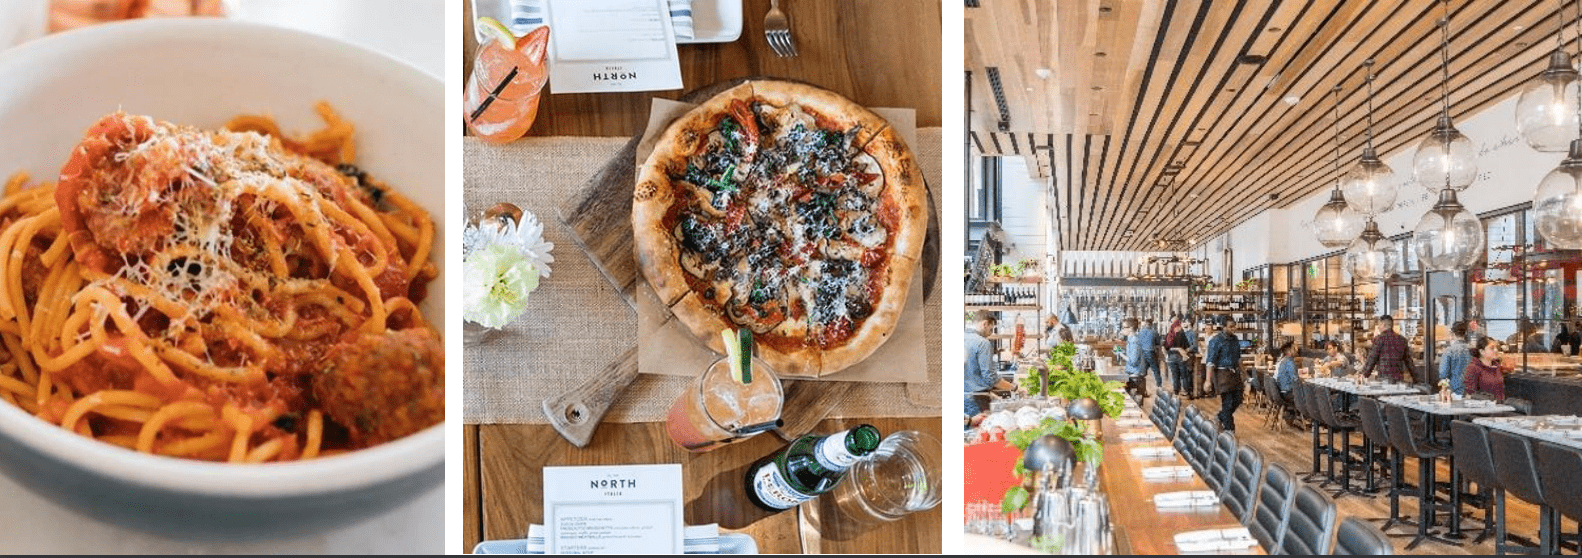
Q2 Results
Cheesecake Factory released its Q2 results in late July, reporting quarterly revenue of $832.6 million, an 8% increase from the year-ago period. The higher revenue was driven by ~3% unit growth, and 4.7% comp sales growth, with the stand-out performer being North Italia, where comp sales growth was up 12% year-over-year. Comparing same-restaurant sales vs. 2019 levels, Cheesecake Factory noted that comp sales were up 13.1% on a three-year basis, and it noted that sales came in within the expected range during the quarter.
Cheesecake Factory – Quarterly Revenue (Company Filings, Author’s Chart)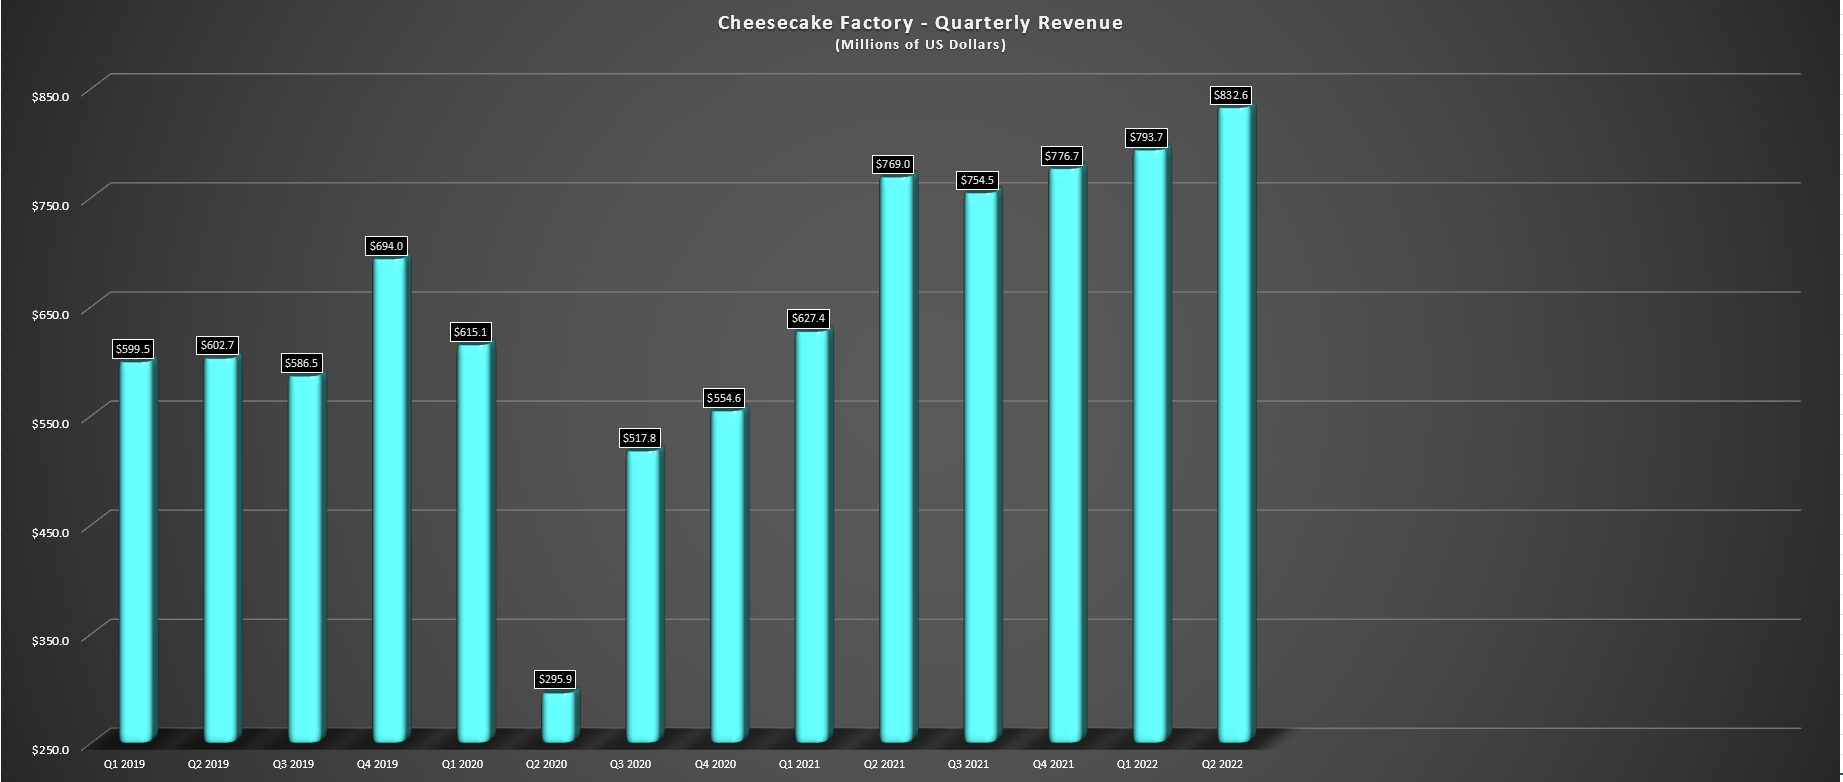
On the surface, these headline results might seem impressive, given the pullback we’ve seen in consumer demand and the weak traffic trends this summer for restaurants (negative traffic in May, June, and July). However, it’s important to note that this has not been driven by traffic growth but by menu pricing, which is up mid-double-digits across the industry and more in some cases vs. 2019 levels. Having said that, Cheesecake Factory outperformed the casual dining space in the period, which may have been helped by indexing more to higher-income consumers, with the company noting that, on average, its guests have $100,000+ in household income.
Highest Unit Volumes & Average Checks Vs. Peers (Company Presentation)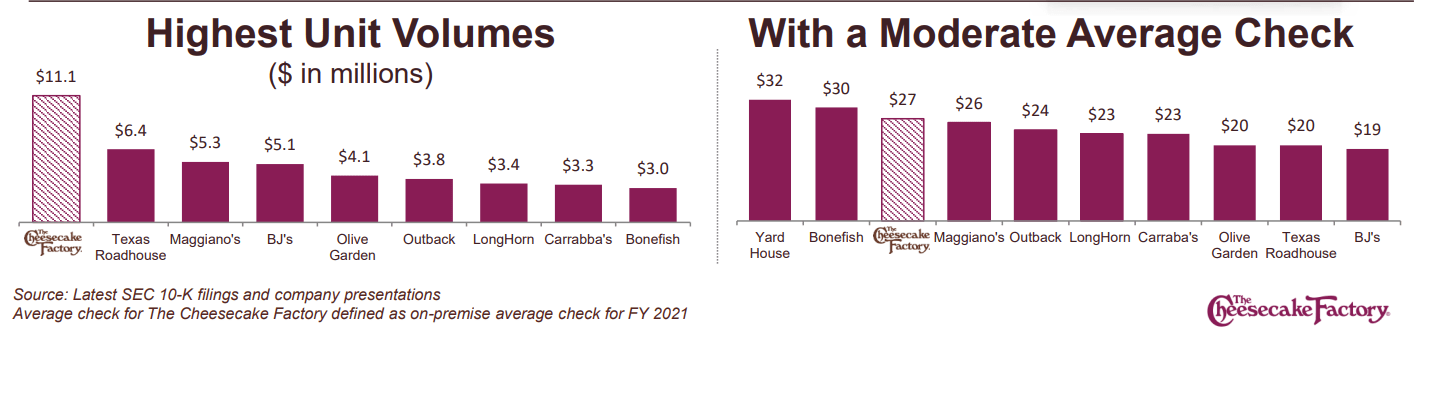
This is a clear advantage in a period when discretionary budgets appear to be having the most effect on lower-income consumers with sub $50,000 household incomes, which is where we see a more clear shift in behavior. The company also shared the encouraging news that it’s not seeing any trading down and hasn’t seen any real check management, which can be an early warning sign of shifting consumer behavior. Finally, while Cheesecake Factory may have a higher average check than its peers, it’s still quite affordable, and its portion sizes are generous so that guests certainly aren’t walking away hungry even if they are paying a little more than at restaurants like Olive Garden (DRI), Texas Roadhouse (TXRH), and Carraba’s (BLMN).
Margins & Industry Trends
While the sales performance was satisfactory, given the elevated gas prices in the reporting period, the margin performance was much softer than some investors might have hoped. This was evidenced by its cost of goods rising to 24.5% (+250 basis points year-over-year) and labor costs rising 90 basis points, with this being driven by higher wages and commodity inflation, which the company now expects to be 14-15% for the year, up 200-300 basis points from its previous assumptions. Cheesecake Factory also called out higher utility and maintenance costs, and not surprisingly, this affects operating margins, which have trended down from 2021 levels.
Cheesecake Factory – Operating Margins (Company Filings, Author’s Chart)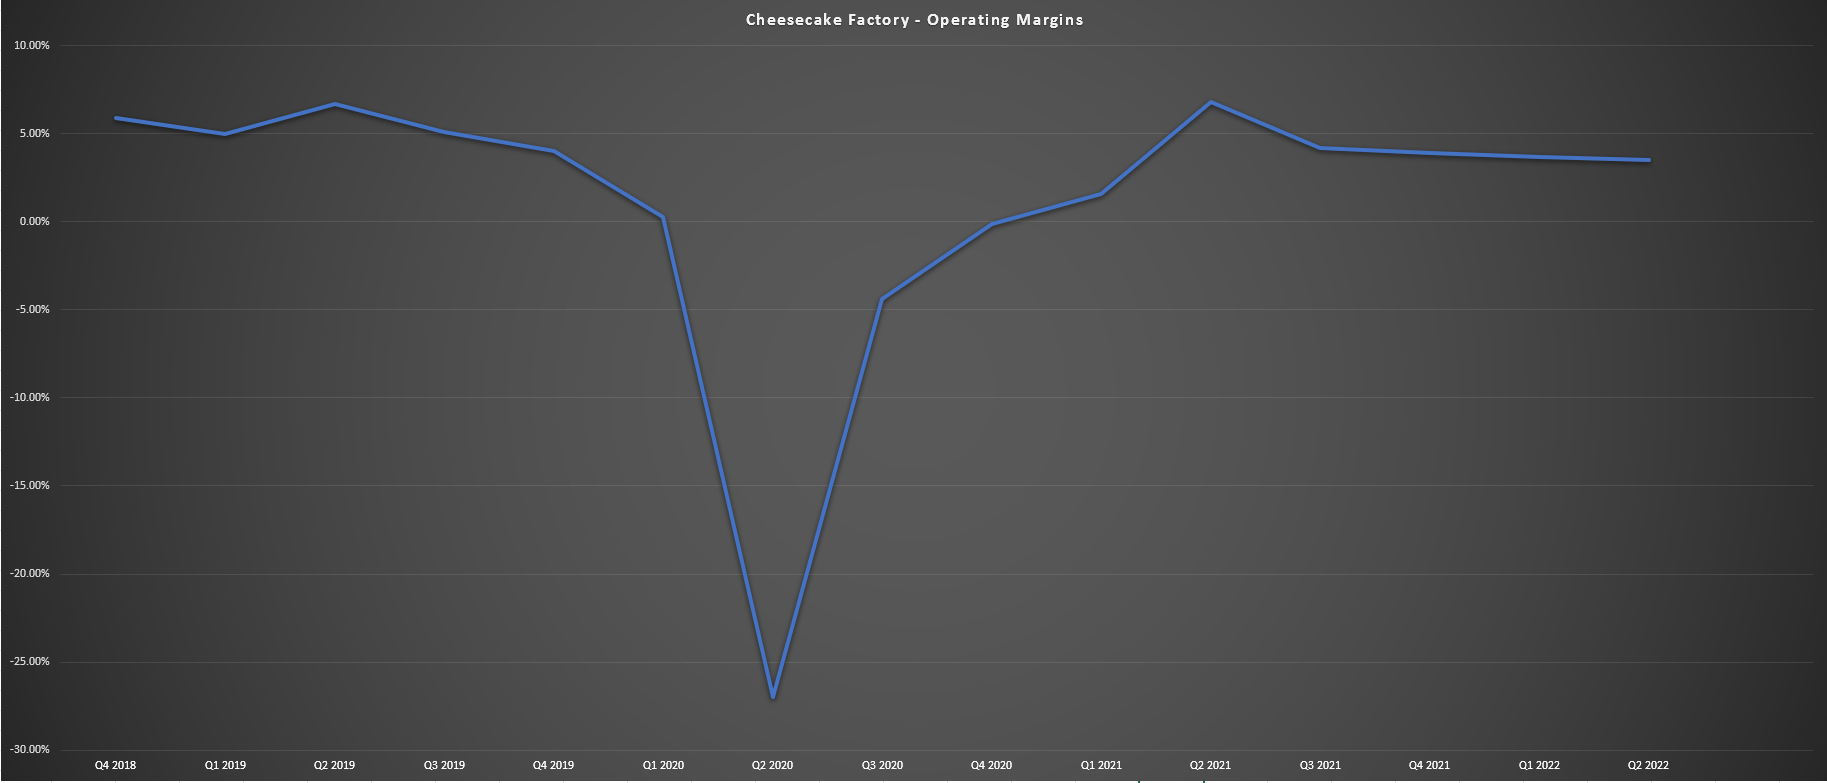
Fortunately, there are a few pieces of good news. The first is that while margins were hit in Q2, Cheesecake Factory has been relatively conservative with pricing, and it should be able to claw back some lost margins with a planned 4.25% menu price increase in Q3. Secondly, several companies have noted that staffing levels are improving, as is applicant flow and retention, and with industry-leading retention and record staffing levels, Cheesecake Factory could see a bit of a tailwind from reduced training/hiring costs and overtime next year. Finally, commodity inflation may have peaked this summer, and some companies are even calling for possible deflation in their basket next year.
Putting this all together, and combined with the fact that Cheesecake Factory’s margins have held up much better than some of its peers, the company is confident it can return margins to pre-pandemic levels. The risk, of course, is that the next price increase of 4.25% combined with a more cash-strapped consumer could lead to some changes in consumer behavior. However, the company noted that it has a playbook if this occurs; and it believes its more recession-resistant than its peers due to its higher-income customer base and stores in more affluent neighborhoods.
Comparable Sales – Historical 2-Year Stack vs. Knapp Track Casual Dining Index (Company Presentation, Knapp-Track)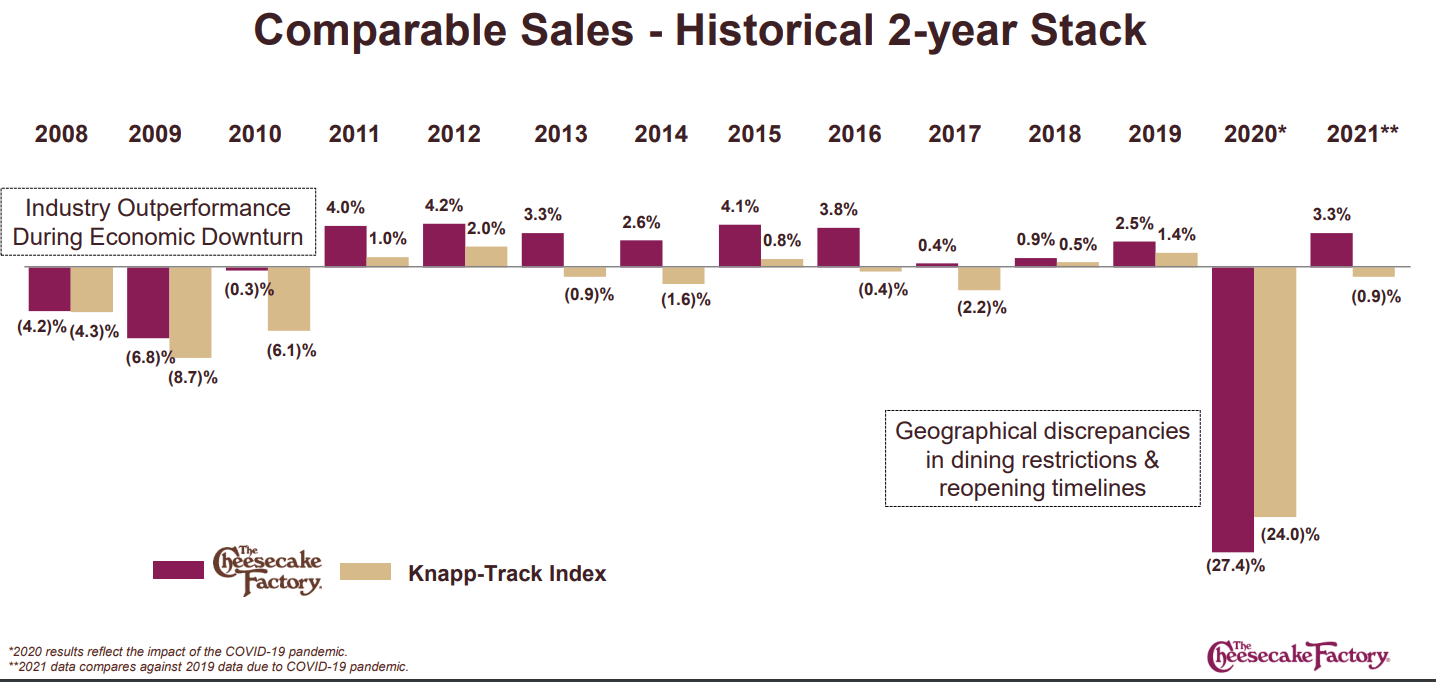
In addition, the company noted its primary competition is white cloth independent Mom & Pop restaurants, and its pricing is below these establishments. This is related to its benefits from scale and industry-leading average unit volumes, which it expects can grow to $12.0 million, meaning it could take market share, even if the overall share of traffic in the industry is decreasing in this recessionary environment. Finally, while past performance is not indicative of future performance has historically outperformed the casual dining group in all periods, including economic downturns, suggesting that if one wants exposure to a casual dining stock, Cheesecake Factory is not a bad option. That said, I prefer Dine Brands (DIN) due to its franchised model.
Earnings Trend & Valuation
Moving over to Cheesecake Factory’s earnings trend, we can see that annual EPS is expected to decline by over 5% this year despite the company enjoying unit growth, with inflationary pressures hurting its margins. This is based on current annual EPS estimates of $2.02 vs. FY2021 annual EPS of $2.13. Fortunately, annual EPS is expected to bounce back next year with a return to 7% unit growth and better margin performance (assuming inflationary pressures don’t worsen). Based on current estimates, annual EPS is expected to hit a new all-time high of $2.82, placing earnings nearly 10% above pre-COVID-19 levels. Let’s see whether this growth is being offered at an attractive valuation:
Cheesecake Factory – Earnings Trend (YCharts.com, Author’s Chart, FactSet)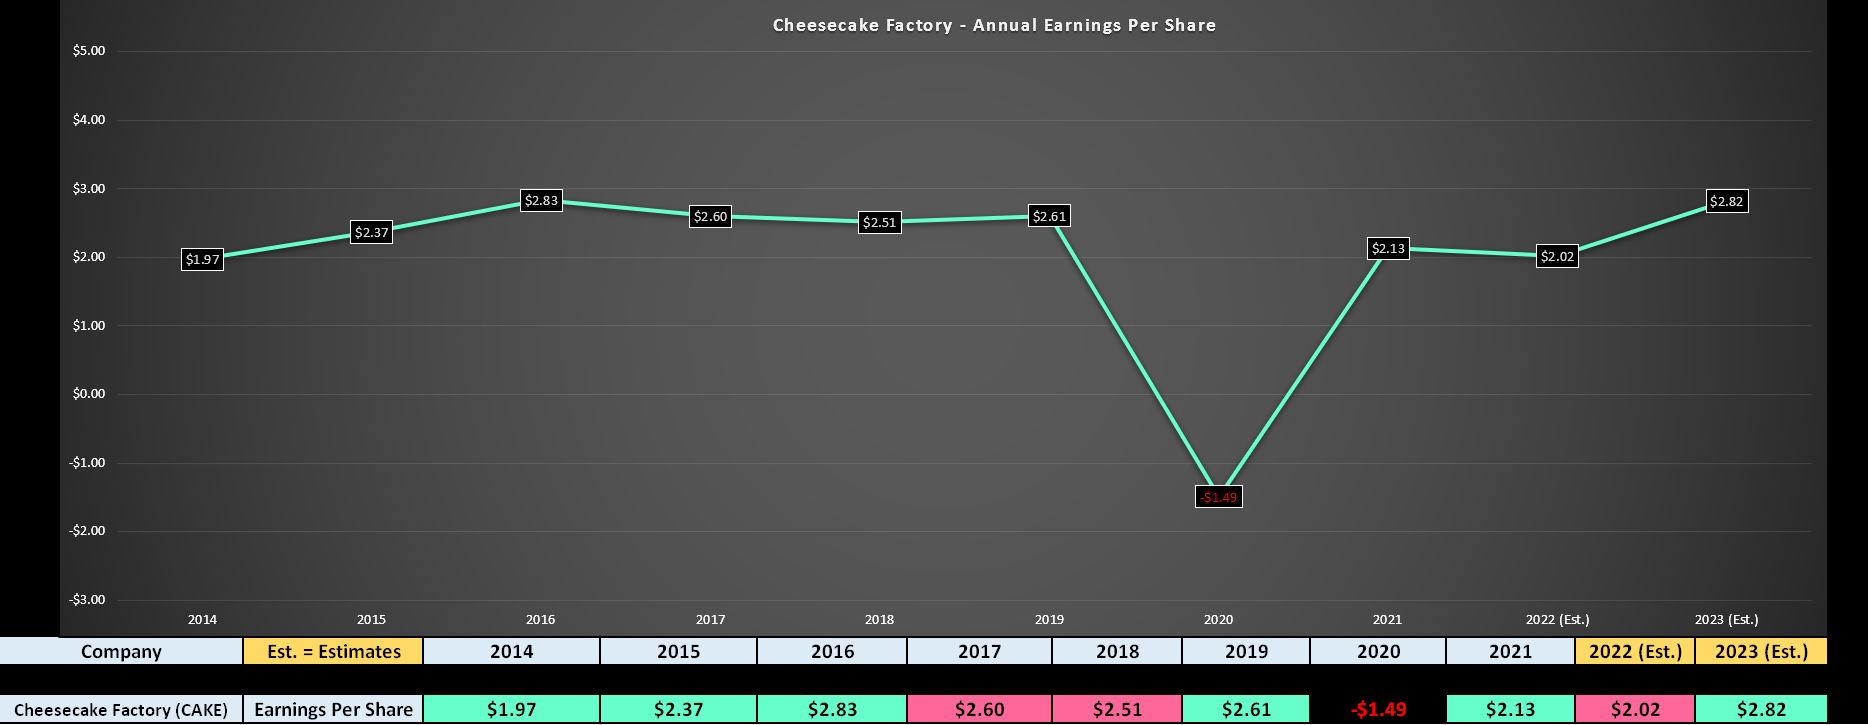
Looking at the chart below, Cheesecake Factory has traded at ~17.4x earnings (5-year average). Still, given the more challenging economic environment, I believe a more conservative multiple is 13.9x earnings (a 20% discount to its 5-year average). Assuming that the company meets FY2023 annual EPS estimates of $2.82 and multiplying this figure by 13.9 would translate to a fair value for the stock of $39.20. I would argue that this is a generous multiple for the stock, given that we saw the stock trade at much lower multiples in previous recessionary periods.
Cheesecake Factory – Historical Earnings Trend (FASTGraphs.com)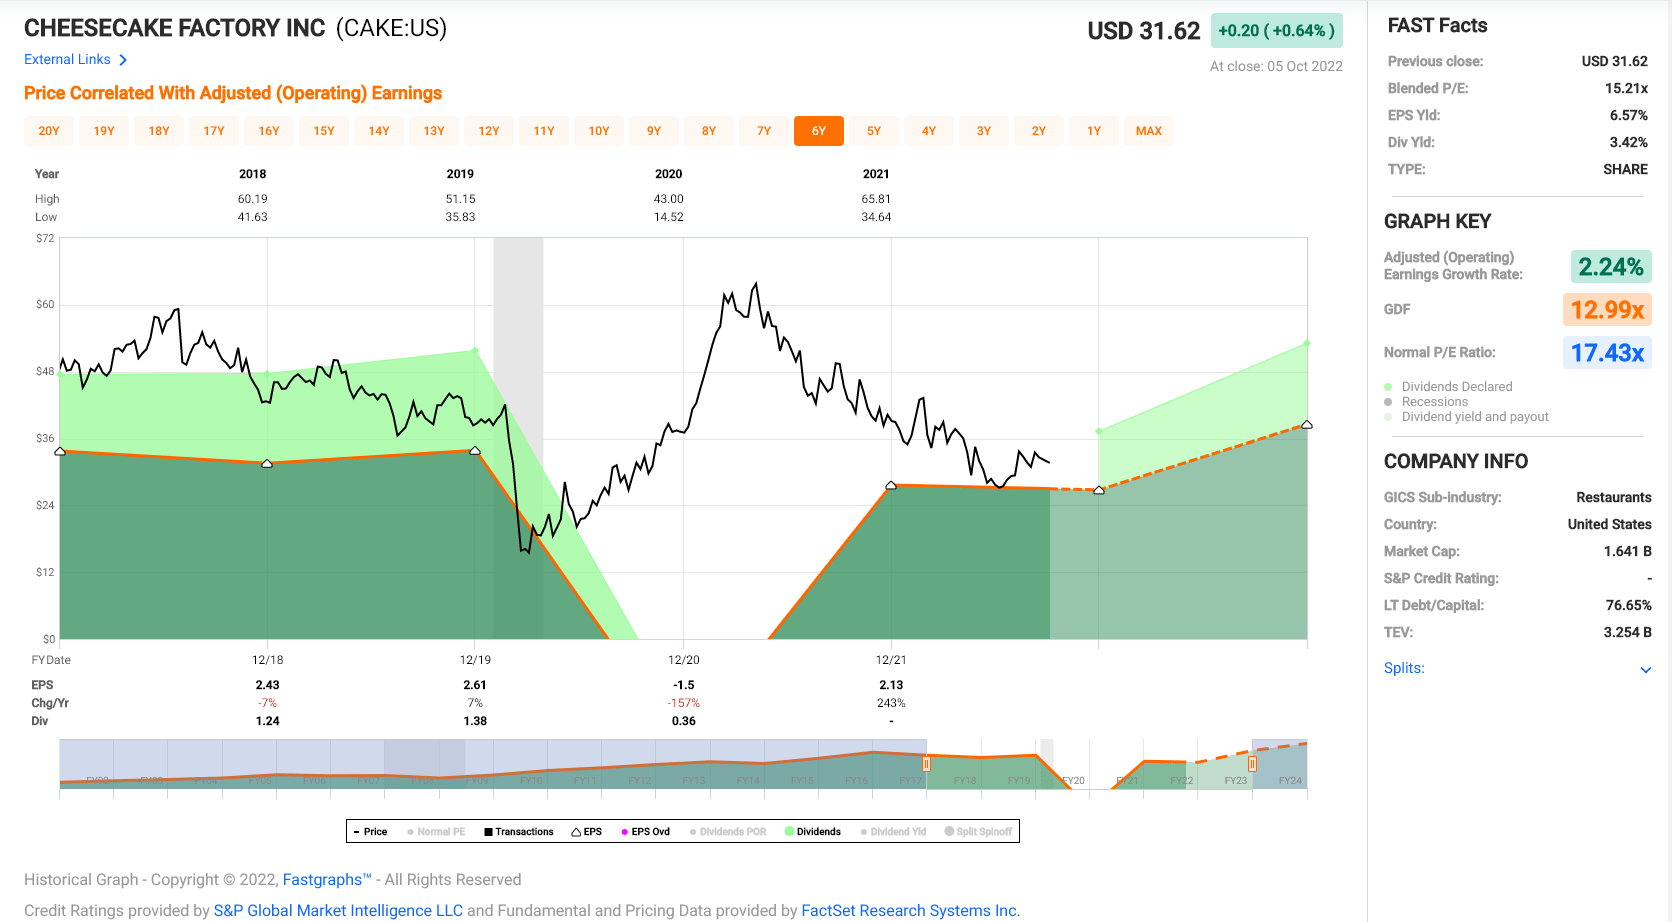
While this fair value figure points to a 20% upside from current levels, I prefer to buy at a minimum 35% discount to fair value when buying small/mid-cap stocks in a cyclical bear market for the S&P-500. As we can see below, the S&P-500 remains below all of its key moving averages, which makes for a riskier environment, and generally favors baking in a large margin of safety. After applying this discount to Cheesecake Factory’s estimated fair value of $39.20, the low-risk buy zone for the stock comes in at $25.50 or lower. Obviously, this fair value could change if we see a major pivot from the Federal Reserve and the backdrop improves or if CAKE beats FY2023 earnings estimates.
S&P-500 Monthly Chart (TC2000.com)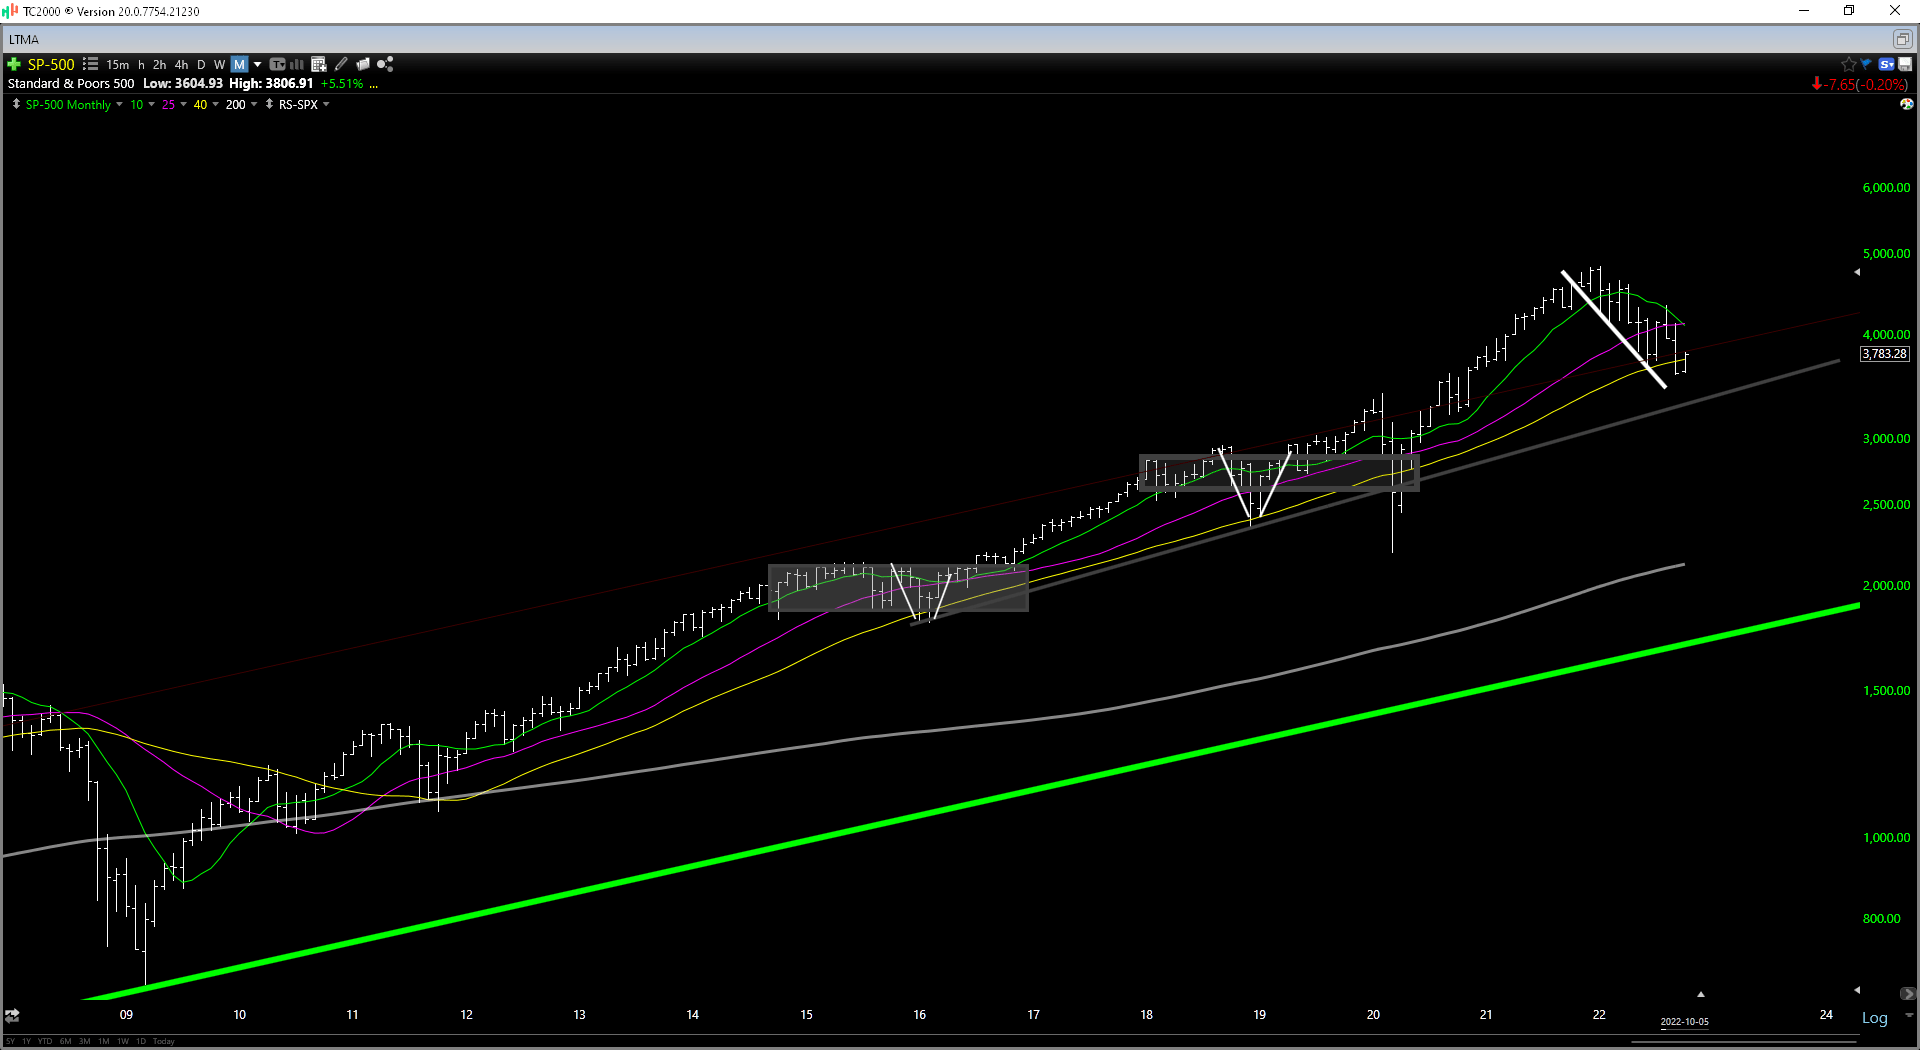
So, is the stock a Buy?
While Cheesecake Factory might be reasonably valued, the stock has strong resistance at $41.00 – $42.00, and its next strong support level doesn’t come in until $26.50. This translates to $10.00 in potential upside to resistance and $5.50 in potential downside to support or a reward/risk ratio of 1.81 to 1.0. In a cyclical bear market, I prefer a minimum of a 6.0 to 1.0 reward/risk ratio, and ideally, I prefer to buy at support or on shake-outs below key support simply. Hence, from a technical standpoint, CAKE wouldn’t become interesting until $26.50 or lower, roughly in line with where it would bake in a considerable margin of safety from a valuation standpoint ($25.50).
CAKE Daily Chart (TC2000.com)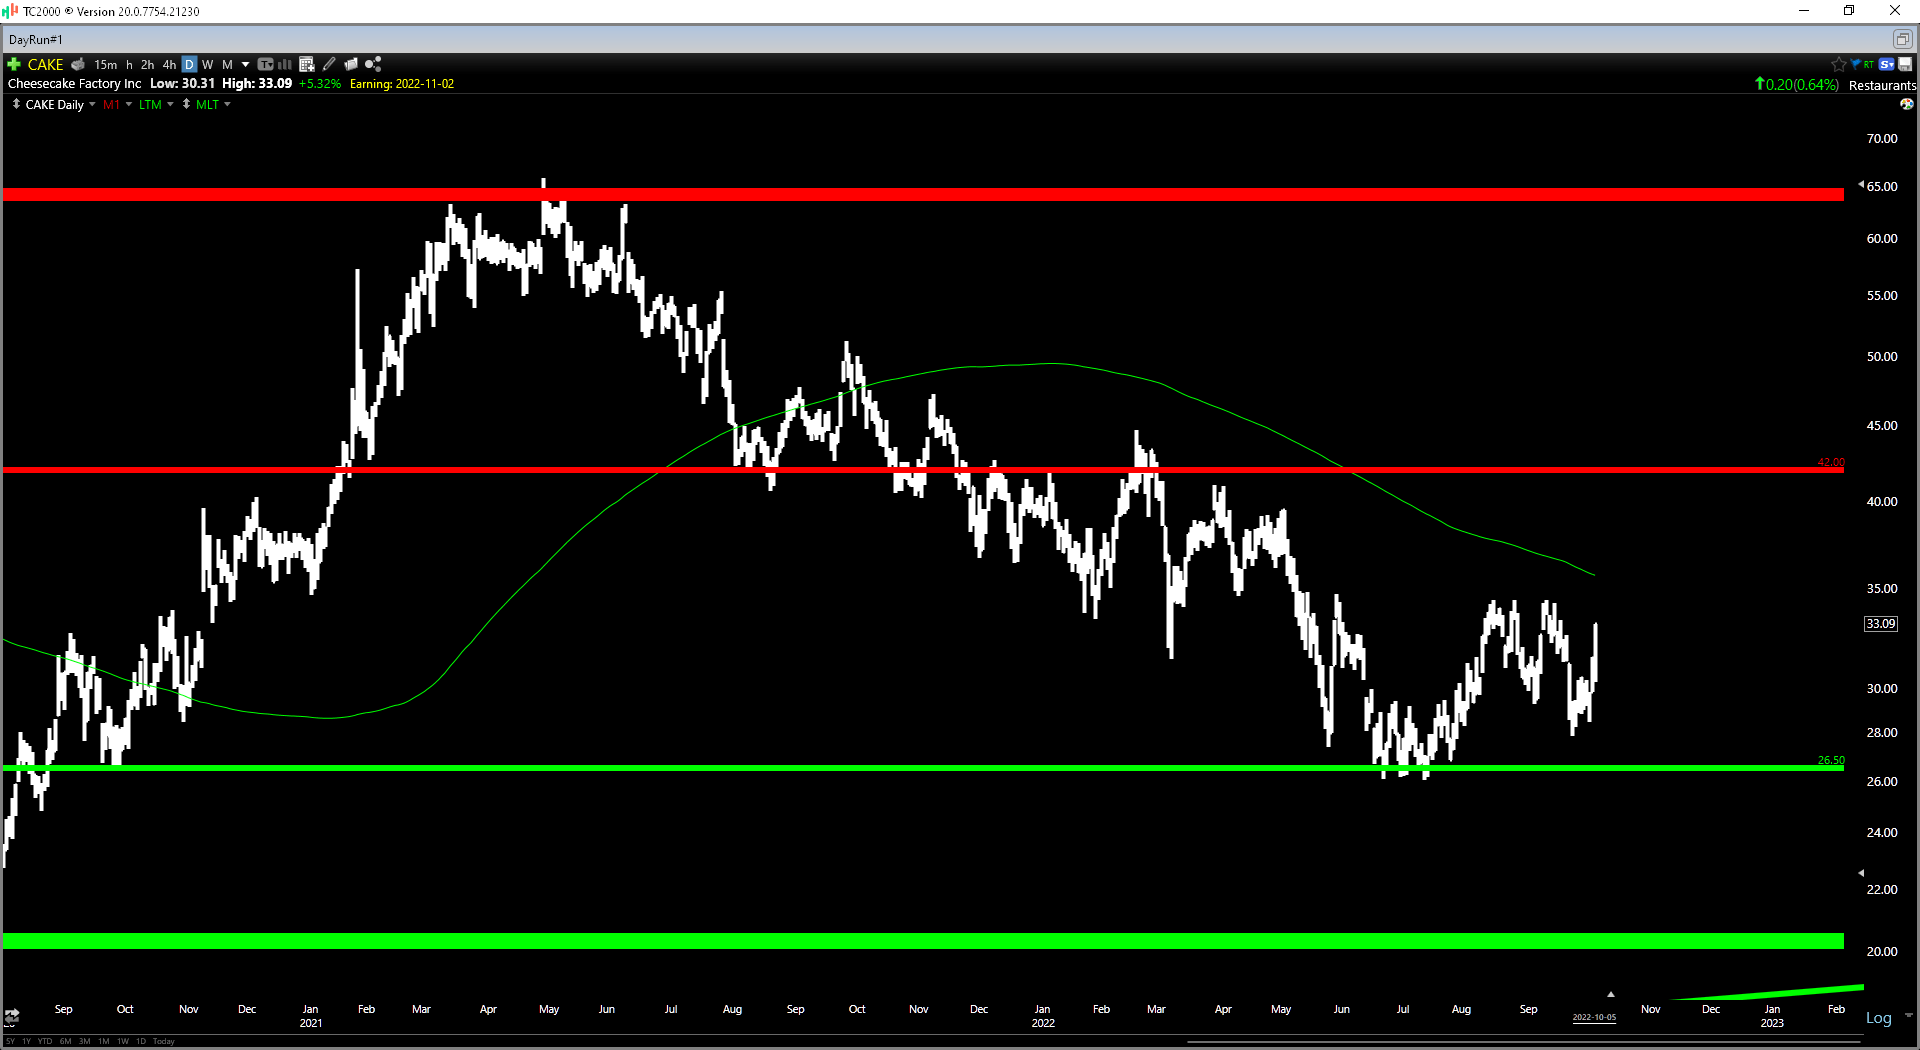
Summary
Cheesecake Factory has had a tough year due to the industry-wide headwinds, but with the stock not selling off on weak Q2 results and inflation potentially having peaked, the lows are likely in for the stock at $26.00. That said, the goal is to buy leading stocks with a significant margin of safety when investing in cyclical/secular bear markets, and I don’t see nearly enough margin of safety just yet for Cheesecake Factory, meaning I wouldn’t get interested until $26.50. So, if I were looking to add long exposure among beaten-up names, I see Capri Holdings (CPRI) as the much more attractive bet, also indexing towards higher-income consumers but trading at just ~6.2x FY2023 earnings estimates.
Be the first to comment