

jetcityimage/iStock Editorial via Getty Images
Summary
Charter (NASDAQ:CHTR) has traded down from its recent highs (~$820) in September 2021 due to weakness in net internet adds across the cable industry, some positive developments in 5G, and AT&T’s new commitment to fiber rollouts. Given some of the uncertainty around the cable industry’s future, any small deviations from previous expectations are resulting in large swings in price and sentiment. This presents an opportunity, if investors can get comfortable with the medium to long-term prospects of cable (the primary risk).
The Situation
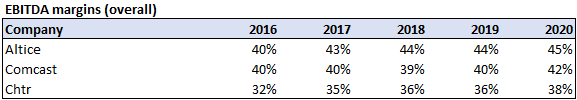
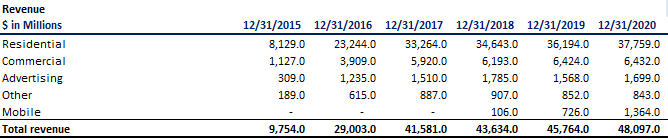
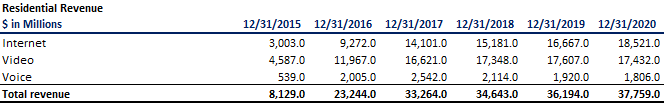
Charter is a leading cable provider in the U.S., offering internet, video, and voice. They have also expanded into mobile as an MVNO (Mobile Virtual Network Operator), in partnership with Verizon. They currently pass ~54 million homes and businesses, with ~32 million customer relationships (~58% penetration). Voice and video services are on the decline, but internet customers have been consistently rising since the Time Warner and Bright House acquisitions (2016). See below for a snapshot of their recent financial performance.
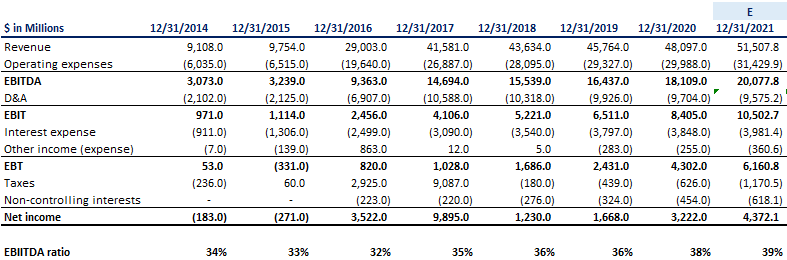
Source: Table created by author with data from Charter 10-Ks
Given Charter’s consistent revenue base and high capital requirements, they operate using a significant amount of debt. They have a target leverage ratio of 4.0-4.5x Net Debt to TTM Adjusted EBITDA and return any excess capital to shareholders through share repurchases. This has led to a ~130% return over the last 3 years. Net debt is currently ~$90 billion and Adjusted EBITDA is estimated to be ~$20 billion for 2021. The business currently trades at ~11x EV/EBITDA and ~15x FCF.
While the short-term outlook for cable looks reasonably stable, the long-term outlook is a little more uncertain, with 5G and fiber overbuilders clouding the picture.
Thesis
This article is in two parts, first a look at the cable industry and their main competitive threats (5G and fiber), then a look at Charter. We’ll end with an attempt at a valuation.
Cable industry
5G rollout
5G is the new global wireless standard and has been touted as the internet of the future (phone and home). Meant to deliver multi-Gbps data speeds with low latency, more reliability and higher performance for less than cable, people believe 5G could be a significant provider of home internet in the future (it currently has a very small footprint). However, 5G has some characteristics that call its economic and logistical viability into question (for home internet):
- Short broadcast distances
- Obstacles impacting signal strength
- Infrastructure costs
Short broadcast distances
5G’s capability to deliver such high speeds is because it uses higher frequency waves (mmWaves). The primary drawback to this is higher frequency waves can’t travel as far (when compared to 4G). 5G towers will have to be very close to user’s homes, meaning more towers and significant rollout costs for operators. A solution to this could be the T Mobile plan, which uses mid-band, not mmWave. This allows for waves to travel further, making its rollout more economically viable (they claim they currently reach ~200 million people in the U.S.). The problem with the T Mobile plan is the speeds aren’t that impressive (they currently average ~120mbps download speed) and the cost, while competitive with cable, isn’t significantly cheaper (they currently offer a plan for $50 a month). This could gain some traction in areas where cable currently provides very slow internet speeds (or areas with DSL), but a speedy mass migration to 5G using this plan seems unlikely.
Obstacles
Another problem with 5G frequencies is they are more likely to be disrupted, meaning a good 5G connection requires a user to be in line with an operator’s tower. This won’t always be the case and, given this isn’t an issue for cable as they are wired directly into homes, poses a problem from a product perspective. It will be hard to take a large share of a market if a 5G operator can only provide advertised speeds to a certain amount of customers in an area, and they can’t easily identify these people in advance (with cable and fiber a house/area is either wired or it isn’t). A good example of this comes from a recent Forbes article. The article describes setting up T Mobile internet and finding the right place to put the gateway in the house. After experiencing some issues with drops and signal strength, the writer found out that he was locking onto a tower further away than he thought. This was because the closer tower was completely obstructed and “may as well not be there”. This is example is anecdotal but gives some insight into potential problems with 5G home internet installations (another article with a similar story was published in The Verge). A mass rollout seems a lot more complicated for 5G if two houses on the same street can have significantly different upload/download speeds (or no coverage at all).
Infrastructure costs
5G still requires a wired connection to broadcast to wireless devices. Current infrastructure can only be used if its fiber, meaning telcos must lay a significant amount of fiber to make 5G a reality. Additionally, brand new infrastructure must be built, specifically small and macro cells. What does this add up to? It’s hard to put a number on all this but rollout costs will be significant, and large telcos still have the battle scars from the 4G rollout (where their infrastructure changed the world but it didn’t show up in their financial performance).
There are a few other qualitative factors that could impact customers switching from cable/fiber. 5G phones could create some confusion around the quality of the home internet offering as potential customers will be using 5G for their phones before considering it for home internet. 5G will be a huge improvement over 4G when a phone is in range, but when people are being offered 5G for the home, they’ll compare their phone speeds (a mix of 5 and 4G) to their current internet option. Not necessarily a fair comparison, but one they are likely to make. Another factor is the current value other internet providers offer (cable/fiber). I think a lot of homes would say the best money they spend every month is their internet connection. You can spend $75-$100 a month and have a family using the internet on different devices in different rooms night after night. While a cheaper price is always welcome, I don’t think much of the U.S. believes they’re overpaying for their internet (in comparison to the value it provides). Finally, cable is a sticky product and people don’t like to switch if they don’t need to. If cable can keep up with customer bandwidth requirements, they will benefit as the incumbent.
Fiber overbuilders
Fiber’s benefits have been known for a long time. It’s faster, more reliable, and can offer symmetrical download and upload speeds. The table below is a quick summary of cable and fiber pros and cons.
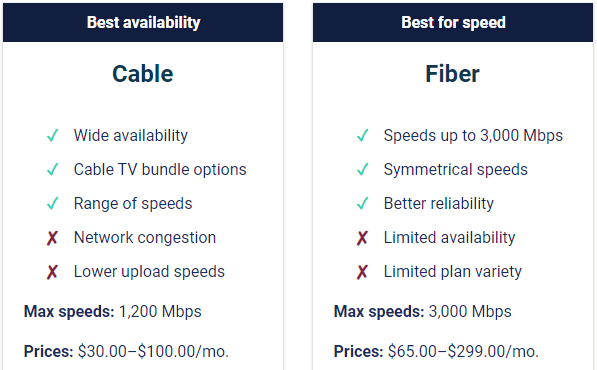
Source: HighSpeedInternet.com
All things equal, fiber is better technology to deliver internet to the home and is future proof, but it is only available in limited areas. MoffettNathanson estimates that ~30% of Charter’s footprint has a fiber overbuild and expects it rise to ~55% by 2025. Cable companies, however, have managed to increase their penetration rates despite fiber having a better theoretical product and increasing overlap. There are a few reasons for this. First, most internet consumers don’t really care whether they have cable or fiber (some probably don’t know the difference), all they want is an internet connection that works consistently and provides them with the bandwidth they need for their day to day lives. Cable companies are currently achieving this, even during the pandemic where bandwidth requirements jumped, as the U.S. moved to a WFH model. Second, cable is the incumbent (mentioned above) and people do not like changing internet providers unless they are forced to (e.g. moving) or there’s an obvious benefit. Even if there’s a slightly better product being offered, if they’re satisfied with their current service and the new product won’t change much, switching is just seen as a hassle and not worth the time. Finally, cable offers cheaper rates (with acceptable speeds) and, therefore, they get the first look from most customers when it comes to internet connections.
This could all change if the average consumers’ bandwidth requirements jump significantly at some point in the future, and fiber can offer a way for customers to meet this need (e.g., broadband allowed for internet and phone use simultaneously and significantly increased internet speeds). Virtual reality could be that technology, but cable companies are efficiently investing in new infrastructure they believe will keep them ahead of household requirements. DOCSIS 4.0 can allow cable companies to deliver download speeds of 10Gbps and upload speeds of 6Gbps which is well above current needs (DOCSIS 3.1 allows for 10G downstream and 1G upstream).
Overall, cable has some serious competition, but they still have runway to improve their current infrastructure and keep up with the consumer requirements. One point I think is sometimes overlooked is cable companies can also lay fiber (Altice is doing just that), they just have the choice not to by investing efficiently in their coaxial cable (which is already in homes). Their wide footprint also gives them insight into where this would make the most sense. Finally, the current environment encourages fiber overbuilders due to low interest rates and a loose monetary environment. A rise in interest rates or a tightening of credit conditions, while bad for cable companies and their significant debt loads, could reduce fiber competition by making their projects uneconomical.
Charter
Now for a look at Charter. They have been growing revenue at ~5% CAGR since 2017 (1st full year post acquisitions) while growing EBITDA at ~7% over the same period. They are consistently adding passings (~2% a year) and have increased their penetration rates from 54% in 2017 to 58% in 2021. All this adds up to an efficiently run operation that has increased margins as their scale has grown (35% in 2017 to 38% in 2020). They have also reduced the share count by around ~30% since the 2016 acquisition (270mm to 190mm).
There are 3 main reasons I believe Charter can keep up their current growth rates (outside of the cable industry factors discussed above):
- Efficiently run operation and proven resilience to fiber overbuilders
- Loss of video subs has little impact on EBITDA (it’s main valuation metric)
- Mobile strategy performing above expectations and has significant upside once at scale
Operations
For the Spectrum brand Charter has focused on customer service and a reasonable pricing strategy. This has helped them increase penetration rates but means their revenue per relationship is significantly below their peers (Comcast & Altice). The below tables show comparisons for the average revenue per residential customer relationship (per month), penetration rates, and overall EBITDA margins. It’s worth mentioning here that ~50% of Charter’s customers still have video, which means this number could come under pressure as video subscribers drop off (so far video sub losses have been made up by increase in prices), even if they push the price of their internet offering.
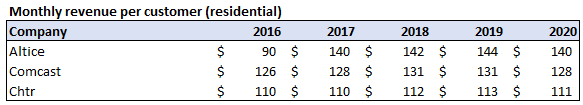
Note: Doesn’t include Mobile
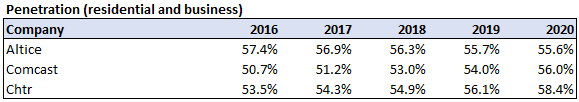
Source: Tables created by author with data from company 10Ks
Charter and Comcast have both significantly increased penetration rates while Altice, who has really pushed price, has moved the other way. Charter has managed to increase penetration rates despite more fiber being available across their footprint. To investigate this further I looked at Charter’s footprint to see how fiber access has changed in some of their larger markets. Below is Charter’s footprint (as of December 2020). They have enough coverage of New York, North Carolina, and Ohio to look at their footprint at the state level, but the rest of their footprint needs to be assessed on a county/city level.
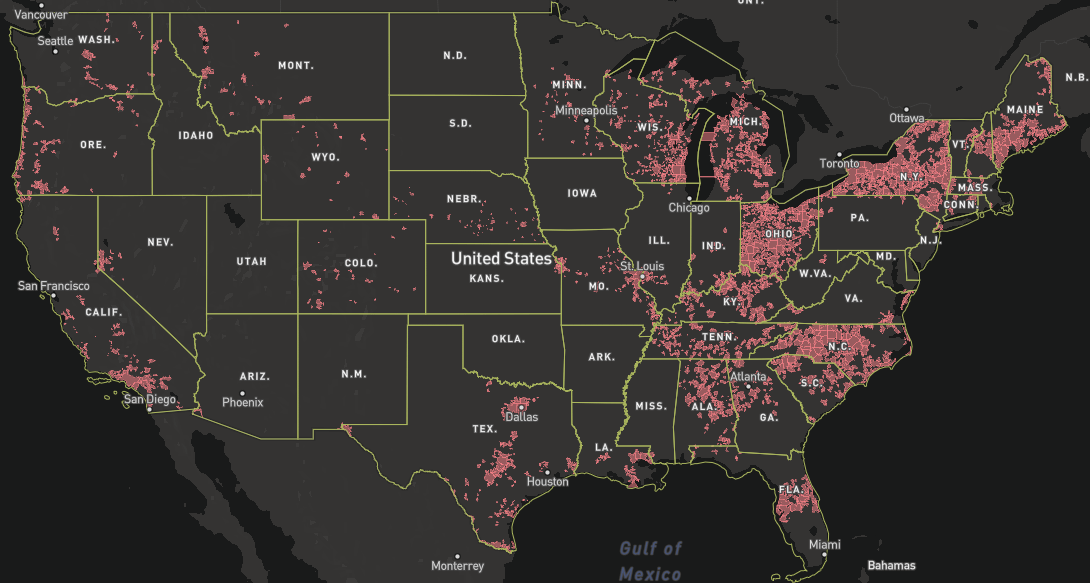
Source: FCC – Charter footprint
To do this we can use cities where Charter provides cable and look at the change in fiber availability (speeds over 100/10 Mbps from 2017 to 2020). Unfortunately, this won’t be a perfect comparison as fiber is a lot more likely to be built in urban areas, where this analysis focuses, but it can show us the increase of fiber connections in a sample of Charter’s footprint.
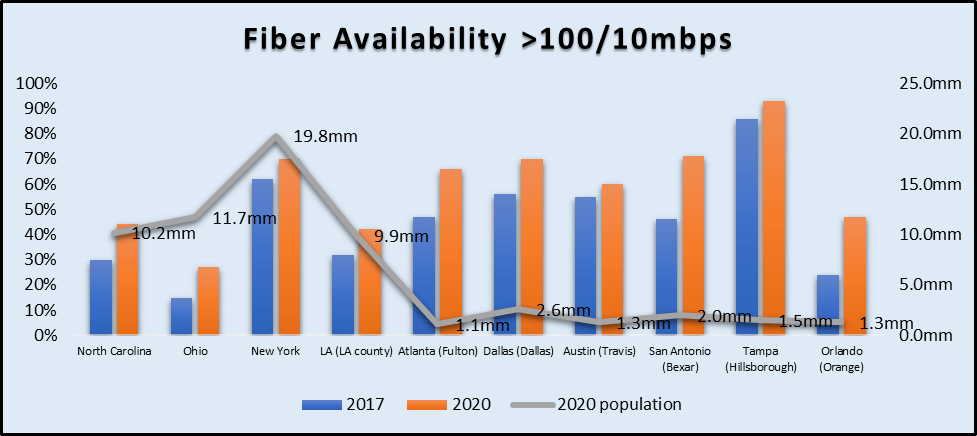
Source: Table created by author with data from the FCC
The table above shows fiber penetration for state or county, in both 2017 and 2020, along with population information for the areas. To translate population into households (proxy for passings), I’ve used 2.5 average house size (from Statista). For areas where the whole state isn’t used, I’ve put the county in the description. I’ve also listed some additional summary stats below.
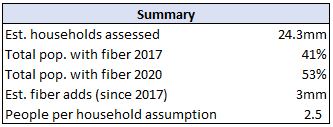
Source: Table created by author with data from FCC and Statista
This assessment covers ~45% of Charter’s passings, assuming they pass 100% of the population in the analysis (not realistic I know) but shows they have increased penetration rates despite fiber availability increasing ~30% in this sample of their footprint. This is because cable provides internet at a lower price and currently keeps up with household bandwidth requirements (discussed above). If this continues to be the case, consumers will lean towards the cheaper option as fiber’s top end capabilities are currently redundant (in some ways) for the average household. However, Altice is a warning that if you push price too far and your customers actively dislike you, other options can become inviting and hurt penetration.
Loss of video subscribers
Cable TV is on the decline due to the rise of streaming and shows no signs of slowing down. Additionally, cable providers are having to pay more for channels as legacy TV providers increase their prices to make up for the loss of viewers. Since 2017, Charter has lost ~700k video subscribers (~4% decline), but ~300k of these losses have occurred in 2021. A continued decline is almost a certainty, and cost pressures will keep rising (Charter plans on passing most of these on to customers). On the positive side, Charter’s Cable TV margins are now quite low and aren’t a large driver of EBITDA. While Charter doesn’t break out their EBITDA by product line, an assessment of their operating costs can give us an idea of EBITDA margins for video (assigning a % of costs to video for each operating expense line). Please note residential video revenue is included in the residential line item.
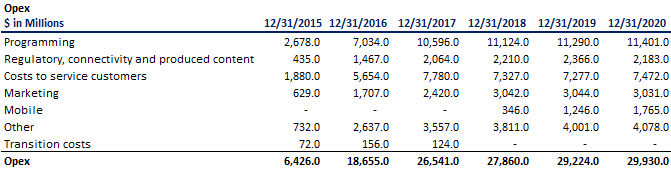
Source: Tables created by author with data from 10Ks
Programming
“Programming costs consist primarily of costs paid to programmers for basic, premium, digital, video on demand and pay-per-view programming”
90%of costs assigned to residential video (remaining assigned to video related to Commercial).
Regulatory
“Represent payments to franchise and regulatory authorities, costs directly related to providing video, Internet and voice services as well as payments for sports, local and news content produced by the Company. Included in regulatory, connectivity and produced content costs is content acquisition costs for the Los Angeles Lakers’ basketball games and Los Angeles Dodgers’ baseball games, which are recorded as games are exhibited over the contract period.”
40% of costs assigned to video.
Costs to service customers
“Costs to service customers include costs related to field operations, network operations and customer care for the Company’s residential and SMB customers, including internal and third-party labor for the non-capitalizable portion of installations, service and repairs, maintenance, bad debt expense, billing and collection, occupancy and vehicle costs.”
30% assigned to video
Marketing
“Marketing costs represent the costs of marketing to current and potential commercial and residential customers including labor costs.”
20% assigned to video as most marketing is now focused on internet offerings.
Other
“Other includes corporate overhead, advertising sales expenses, indirect costs associated with the Company’s enterprise business customers and regional sports and news networks, property tax and insurance expense and stock compensation expense, among others.”
25% assigned to video. A mix of multiple expense lines across all revenue streams.
Summary
Using these (very) rough estimates, on 2020 numbers, I get ~$2.5 billion of EBITDA from residential customers (~15% EBITDA margin), and ~15% of total 2020 EBITDA (residential video revenue makes up ~35% of total revenue). So, as video revenue declines, this will be somewhat offset by an expansion of EBITDA margins. While losing scale is never good, Mobile (discussed below) could offset video revenue declines over the next few years and fill the gap in their bundle.
Mobile
Charter launched Spectrum Mobile in 2018 and it has been a homerun success so far. In the 3 years since its launch, Charter has signed up ~3.2 million lines at ~$50 per month. Adding mobile to the cable bundle has been a great way to tap into a huge market and add other reasons for customers to keep their cable internet (as video becomes less of a pull). While currently operating at a loss, Charter now has enough scale that the losses are beginning to shrink, and now claims that each mobile add is EBITDA accretive. The upside potential of mobile is significant.
Charter’s MVNO agreement with Verizon
Both Charter and Verizon currently claim they are happy with their MVNO agreement (originally entered in 2018 and updated at the end of 2020), and, while there aren’t many public details, it appears that the agreement will be more advantageous to Charter as they continue to take share in the mobile market. First, given that WiFi makes up most of phone internet connectivity and Charter pays Verizon for each GB of data used on their network, they can keep a significant amount of traffic off Verizon’s network. See below for estimates of WiFi vs Verizon’s network usage.
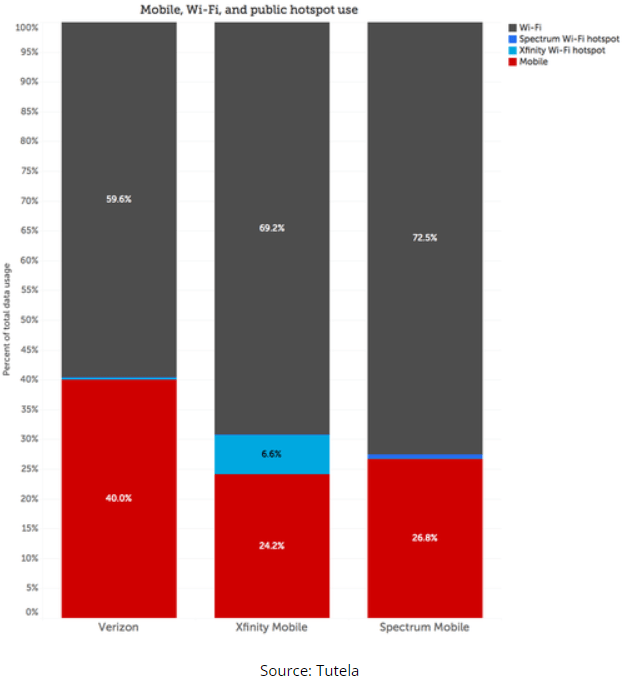
Source: LightReading -2019
Charter has further reduced the need to use Verizon’s network by rolling out WiFi hotspots that Spectrum users can connect to, which increases internet speeds and allows Charter to move traffic off Verizon’s network (Comcast has done a better job of this so far though). Charter also purchased ~$465 million worth of CBRS priority licenses that they believe could reduce their customers’ use of Verizon’s network by ~1/3 (pushing traffic through their own network at a lower cost).
Additionally, consumer behavior has changed significantly since the onset of the pandemic. People have spent more time at home connected to their WiFi (the chart above is based on 2019 data). With this change likely being somewhat structural (WFH), Charter will benefit more than they originally anticipated. While it is unlikely Charter will be able to obtain penetration close their internet rates, if they can get ~25% penetration (hopefully conservative), this would give them ~$8 billion in annual mobile revenue (on current passings numbers and $50 a line). At 20% EBITDA margins (at scale), this would produce ~$1.6 billion in EBITDA, replacing a significant portion of Charter’s lost video revenue.
Valuation
I’ll use a 5-year DCF (2022-2026) and then a terminal multiple. Usual caveats about DCFs apply, we’re just trying to create a reasonable scenario and see what value it could potentially yield (adding a margin of safety as required). I like showing key assumptions as it allows for better feedback in the comments. I’ve listed them below:
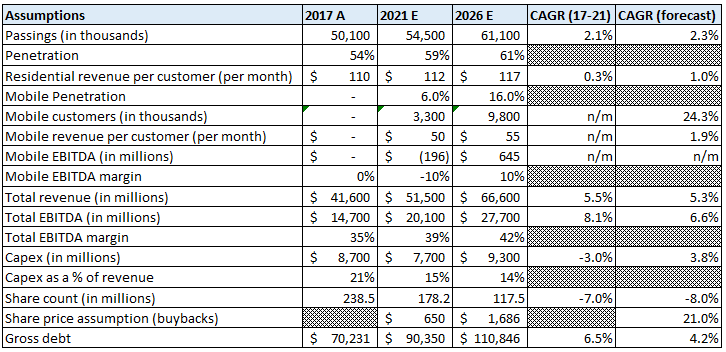
Source: Table created by author
The model assumes continued passings growth, slightly increased penetration, and low growth in revenue per customer as video subs fall off (mobile is modelled separately). Mobile customers and EBITDA margins are hard to get a handle on but, given the value from mobile is more than just the revenue it brings (strengthening the value of the bundle), a low positive margin (10%) by 2026 is fair (I expect this margin to keep expanding post 2026). This leads to continued topline growth of ~5% and overall EBITDA growth of ~7%. Capex assumption is ~$9.3 billion at the end of the forecast period with the % in relation to revenue decreasing (hopefully conservative). There’s a lot of factors at play here that could change this % (CBRS spend, self-installations, less CPE for video etc.) but a 4% CAGR while reducing capex as a % of revenue feels reasonable. From a buyback perspective I assumed share count is reduced to ~118 million and the average price of share repurchases over the period were ~$1,300, ~21% CAGR through the end of the forecast period (in line with value below). The above assumptions give us ~28 billion of EBITDA in 2026. If we expect Charter’s EV/EBITDA multiple to stay roughly flat, we get an EV of ~$300 billion, for an equity value of ~$200 billion. This gets us a share price of ~$1,700 and a CAGR of 21% through 2026. There’s legitimate questions around the multiple in 5 years time (given fiber is a better technology), so I’ve added a sensitivity table on the terminal multiple.
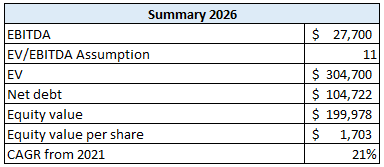
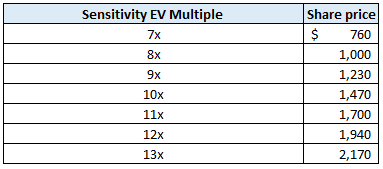
Source: Tables created by author
The key risk, from a permanent loss of capital perspective, is the obsolescence risk of Charter’s cable assets. If fiber becomes the go to option for internet connections over the next 5 years and cable’s coaxial cable can’t keep up with bandwidth requirements, it will result in a significant loss of for investor’s (levered buyback strategy would exacerbate this). I feel this is unlikely given the points highlighted above and the significant costs to lay enough fiber to make Charter’s coaxial cable obsolete.
Conclusion
I’ve been rambling so I’ll wrap this up quickly. Charter has been a great investment and a great business since the acquisitions gave them much needed scale. I think they can continue to be both, and investors can use the uncertainty around 5G and fiber to enter at a reasonable price. An investment in Charter will require us to monitor the industry closely though, as changes in technology and bandwidth requirements could quickly change the industry’s competitive dynamics. Thanks for reading.
Be the first to comment