

Andrew Burton/Getty Images News
Global Equity Valuations: I still find this chart fascinating, it shows US PE10 valuations hovering around what was previously the top end of the range (of the 2017-2020 period), and still more or less double that of their global peers.
In that respect, I see this as a key reason for skepticism on the bull case for (US) equities given the still significant and growing monetary headwinds and looming recession prospects.
Other than the US, Emerging Markets have come down slightly, but likewise their PE10 ratio as a group has not yet made a cathartic plunge as for example that it and the rest of them did in 2020 (n.b. for a worked example see my “Global Equities: Generational Buying Opportunity Emerging” post from March 2020).
Developed markets on the other hand have made a major reset, and at the low point were more or less on par with some of the other previous major market bottoms. So aside from the overall equity view, the chart is also interesting in establishing a relative value view and setting the directional bias there.
Overall though, as noted in the monthly: I’m still erring on the defensive in the asset allocation frameworks (prefer bonds in particular), and on equities prefer global ex-US vs US. But I would say it’s worth noting how different a situation it is now going into 2023 vs where things were sitting in late 2021 or even earlier this year…
Topdown Charts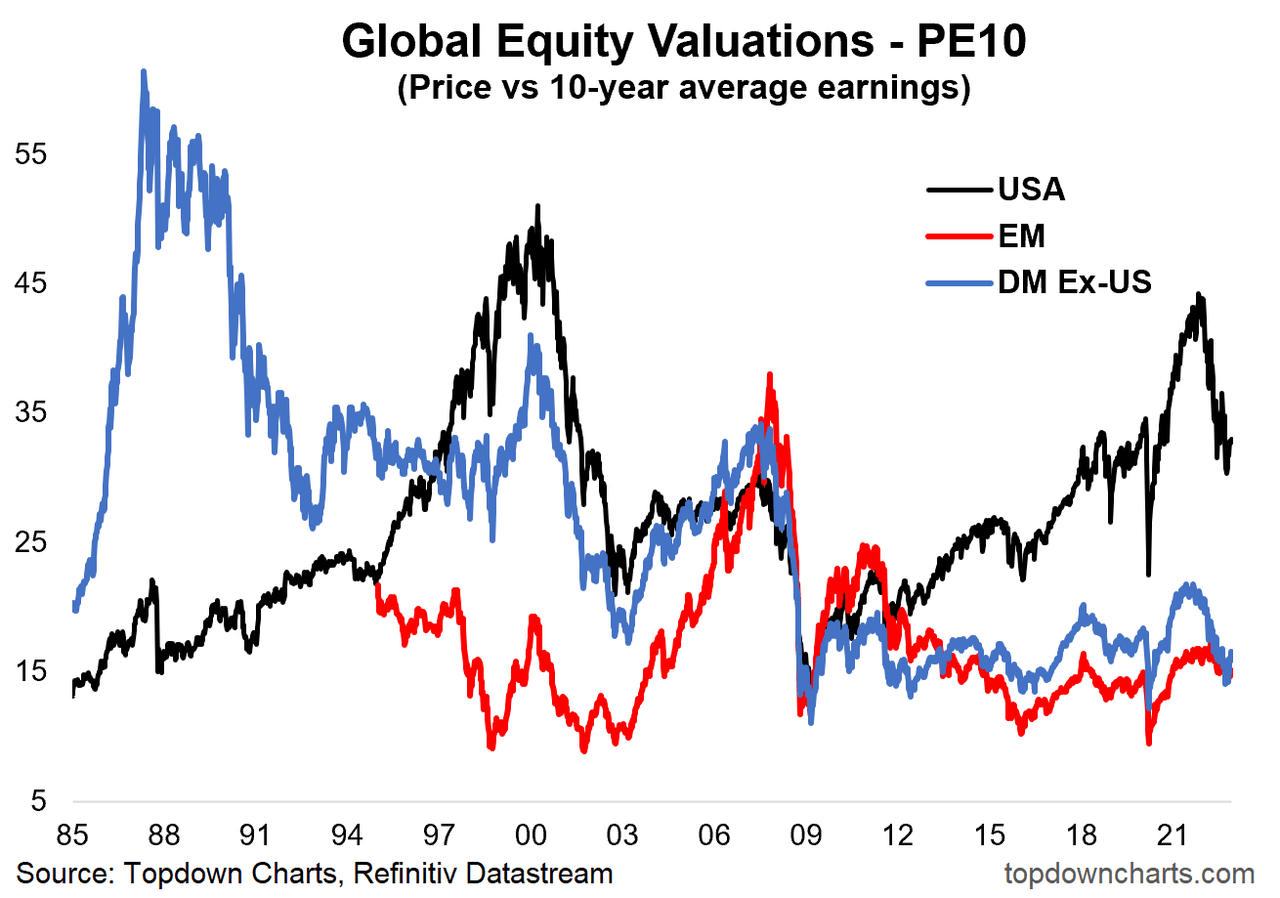
Key point: US equities are not cheap, but developed ex-US are.
Be the first to comment