Darren415
This article was first released to Systematic Income subscribers and free trials on Dec. 3.
Welcome to another installment of our CEF Market Weekly Review where we discuss closed-end fund (“CEF”) market activity from both the bottom-up – highlighting individual fund news and events – as well as the top-down – providing an overview of the broader market. We also try to provide some historical context as well as the relevant themes that look to be driving markets or that investors ought to be mindful of.
This update covers the period through the first week of December. Be sure to check out our other weekly updates covering the business development company (“BDC”) sector as well as the preferreds/baby bond markets for perspectives across the broader income space.
Market Action
CEFs had a strong week, with all sectors registering positive total NAV returns while discount changes were mixed. The rally over October and November came close to erasing most of the September drawdown.
Systematic Income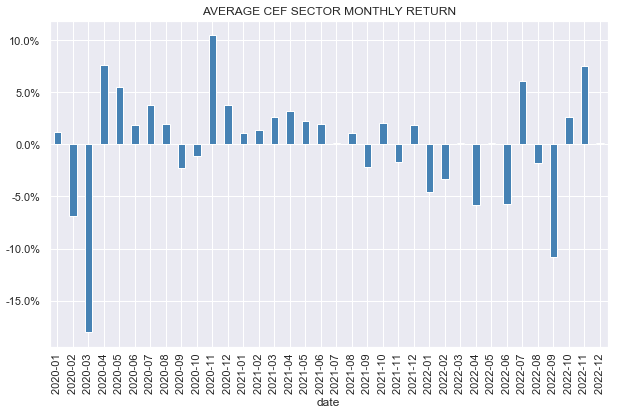
The CEF market has seen lots of ups and downs this year, and this latest rally looks very similar to the previous one over the summer. It seems unlikely we will see a continued smooth recovery from here on given the Fed has not even paused its hikes. Such an outcome would be very unusual historically.
Systematic Income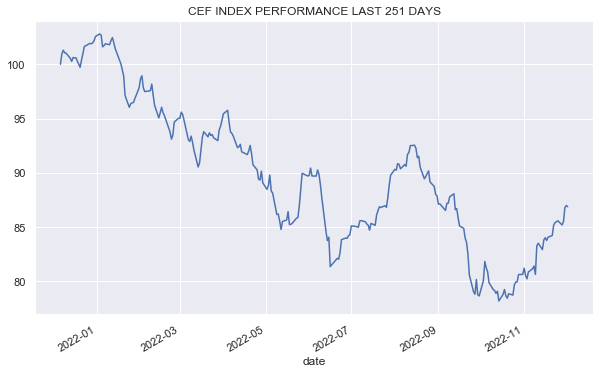
Discounts stalled recently despite the rally in NAVs. Fixed-income CEF discounts, in aggregate, moved out to an 8% level which looks historically on the cheaper side of fair-value.
Systematic Income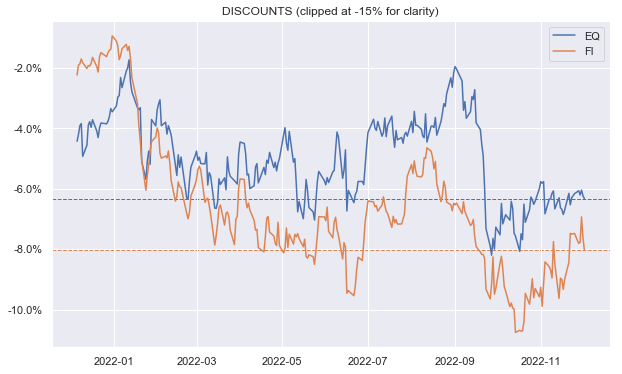
Market Themes
Western Asset CEFs recently put out their quarterly income reports which are always worth a look as they provide additional granularity about what’s happening to income. Unfortunately, CEFs are only obligated to reveal their income levels on a semi-annual basis, so any additional information is always welcome.
In this section we will focus on the Western Asset Mortgage Opportunity Fund Inc. (DMO). This is because the fund is especially interesting as discussed below as well as the fact that it remains a holding in our High Income Portfolio
DMO net income rose by 4% from Q2 and is 18% higher than the average of Q4 and Q1 levels. Another interesting point is that the fund actually added borrowings in Q3 and another time earlier in the year. This is the opposite of the deleveraging that many other funds are going through and looks to be a function of the fund’s relatively low NAV beta this year as its mortgage credit assets have held in OK. This is likely due to household health remaining fairly resilient given a strong labor market and previous savings as well as increased equity backing home loans due to the sharp rise in house prices post-COVID.
There are different factors that have both increased and decreased CEF yields this year. DMO is an interesting case study because all these key factors are pointing in one direction – a fairly unusual combination.
Specifically, DMO investors are now seeing a significantly higher level of portfolio yield than at the start of the year for the following reasons: 1) wider discounts, 2) lower asset prices, 3) higher coupons on its floating-rate asset due to the rise in short-term rates, 4) stable leverage costs and 5) increased borrowings which create more assets for each dollar of NAV.
While factors 1 and 2 are fairly common in the CEF space, factor 3 only holds for floating-rate funds like loans and securitized assets. Factors 4 and 5 are very unusual as most leveraged CEFs have floating-rate leverage instruments while very few leveraged CEFs have managed to increase their level of borrowings this year – the vast majority of those that have changed their level of borrowings did so by deleveraging i.e. cutting borrowings.
For these reasons as well as its valuation, DMO remains attractive. It is currently Buy-rated in the High Income Portfolio and trades at a 9.9% yield and a 11% discount.
Market Commentary
The two TIPS CEFs (WIW) and (WIA) raised distributions. These two funds are unusual due to their TIPS overweights. TIPS are not obvious candidates for CEFs due to their very low coupon profile. Specifically, TIPS coupons are set around the real yield, floored at zero. For instance, when real yields were below zero last year TIPS coupons were set at zero. More recently, an auction set a 10Y TIPS coupon at 0.625%.
The way coupons are set is, say the 10Y Treasury yield is 4% and the 10Y expected inflation is 3%. In this case the TIPS coupon will be set around 1%. These kinds of coupons are not super exciting which is why you don’t tend to see a lot of TIPS CEFs. One reason why WIW/WIA NAV distribution rates are not at rock bottom levels is due to: 1) These funds allocating to some of the highest coupon TIPS they can find. This doesn’t change the yield profile of these TIPS so the high coupons are just a kind of window dressing to avoid income levels from being very low and distribution coverage being too high, 2) About 20% of assets being in higher-yielding assets. A quick look at the WIW Section 19 shows that for the first 11 months of the fiscal year the funds have coverage sub-75% which is something you’d expect for 6-7% NAV distribution rates.
Funds like WIW and WIA which are pretty high-credit quality have wide discounts, OK yields and exposure to inflation – a combination that is very easy to like. However, it’s important to also highlight the drawbacks. The most important one is that the exposure to inflation comes along with long duration.
This is a point that we have made for a couple of years now – investors who want inflation exposure may be disappointed with the performance of TIPS because TIPS are duration instruments and rising inflation tends to coincide with rising interest rates, which obviously hurts duration assets.
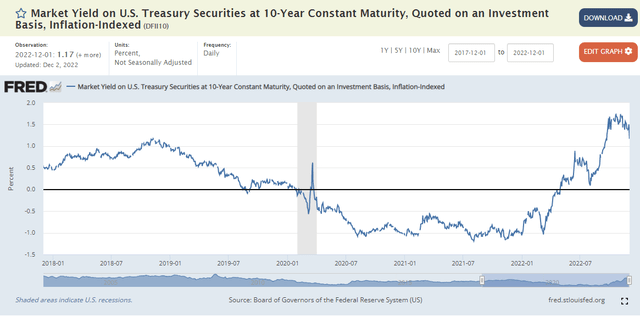
This is why WIW and WIA have total NAV returns of around -20% this year despite sharply higher inflation, whereas something like Angel Oak Financial Strategies Income Term Trust (FINS), which holds primarily investment-grade floating-rate (i.e., low-duration) bonds, is down 9%. Specifically, real yields have risen sharply this year and that’s what drives the value of TIPS.
It’s interesting to note that the previous time we discussed WIW on the service appears to be Dec-2020. Back then, our comment was basically that anyone who wants inflation exposure shouldn’t hold long-duration TIPS because rising inflation / rates will hurt them and this is how it’s played out. Investors who want inflation exposure without duration should look at I-bonds.
In terms of wide discounts, these don’t look hugely attractive to us despite fairly low management fees for the simple reason that the lower the underlying portfolio yield the wider the discount has to be, all else equal. This is because even a low fee can take out a sizable chunk of the portfolio yield when the yield itself is low.
At this point in time, TIPS are actually quite attractive in our view – their yields are above those of I-bonds, breakeven inflation (2.4% expected over the next 5 years) looks low, and real yields have increased sharply as well from 2021 levels.
Stance and Takeaways
Multi-sector PIMCO credit CEF PIMCO Access Income Fund (PAXS) has gotten pretty rich in our view, which pushed us to reduce our allocation to the fund. At the time of the rotation, the fund traded near a 2% premium. The chart below shows that PAXS (blue line) has tended to trade at a wider discount than multi-sector CEFs but has recently moved to trade at a higher valuation.
Systematic Income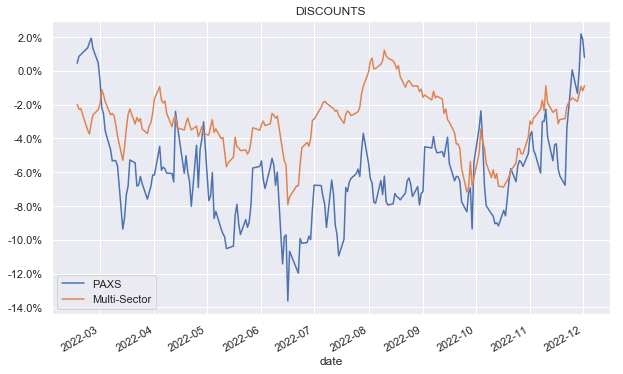
The valuation differential chart below makes this more obvious (above-zero level means PAXS is trading at a tighter discount / higher premium than the sector average). We earlier added to our PAXS position at significantly cheaper levels in July and November.
Systematic Income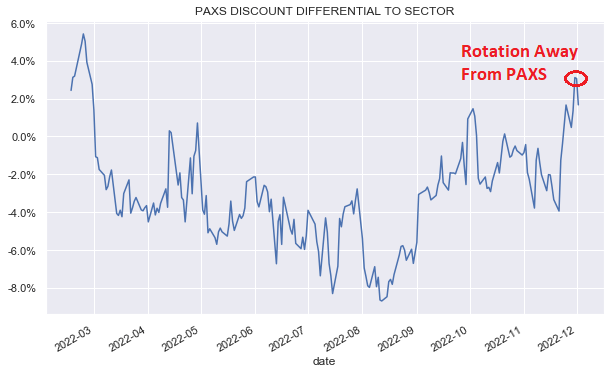
It’s possible investors are bidding up the fund to capture the special dividend which should be declared in the next couple of days (last year there was a 2-day gap between declaration of regular and special dividends by PIMCO). If so, this is a bit early since the ex-div date won’t be for another 10 days or so.
Alternatively, the special dividend declaration is likely to be followed by a bump in the price of the stock, so perhaps investors simply want to enjoy the price bump on declaration and are buying the fund for this reason. These kinds of games are good signals for longer-term valuation-based investors to pare an allocation and get back in later at better levels.


Be the first to comment