

marrio31
Investment Thesis
The Victory Portfolios EQ Income Enhanced Volatility Weighted ETF (NASDAQ:CDC) is one of the most interesting ETFs I’ve covered on Seeking Alpha. It combines high dividends, low volatility, and a set of rules requiring the fund to exit equities under specific circumstances. Since its launch, CDC has been one of the most successful dividend ETFs on the market. But the reason for today’s article is that CDC is now 75% cash, ironically causing concern to those who worry it’s exiting equities precisely at the wrong time. Moreover, CDC’s 0.36% expense ratio is higher than alternative low-volatility ETFs, so it’s reasonable to question why you’re paying high fees to hold cash.
I plan to address these concerns by describing the type of investor I think CDC is meant for. In addition, I will review 20+ years of history to show how often the long/cash strategy worked and present the fundamentals for the underlying equities portfolio. I’m still confident that CDC is an efficient, aggressively-defensive product worth owning, and I’m maintaining my buy rating until there are clear signs of a market recovery.
ETF Overview
Strategy
CDC tracks the Nasdaq Victory U.S. Large Cap High Dividend 100 Long/Cash Volatility Weighted Total Return Index. It’s a mouthful, but I’ll try to break the process down as simply as possible.
- The Index starts with the largest 500 U.S. equities, except REITs, and eliminates those without four consecutive profitable quarters.
- The highest-yielding 100 stocks are selected and inversely weighted by their 180-day standard deviation of price returns.
- Sector exposures are limited to 25%, with no minimum exposure requirement.
- Reconstitutions occur semi-annually in March and September.
These screens result in a high-quality portfolio, primarily because of the size and profitability requirements. I’ve also studied many low-volatility strategies, and surprisingly, the 180-day lookback to assess volatility often results in similar sector exposures than one-year, two-year, and three-year lookbacks. However, CDC’s uniqueness is its rules-based process for exiting equities, as described below. When the Index is down 8% from its All-Time Highest Daily Closing Value, the portfolio reallocates to 25% equities and 75% cash.
VictoryShares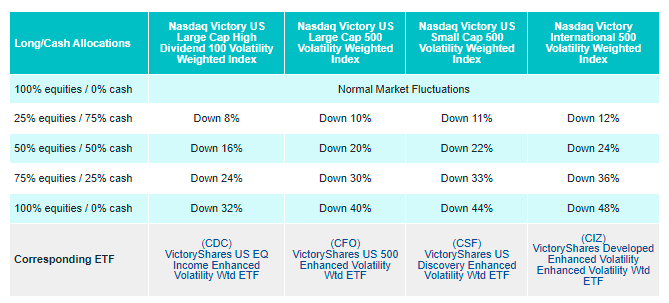
Top Holdings and Sector Exposures
In addition to the cash holdings, CDC holds solid blue-chip stocks like PepsiCo (PEP), Johnson & Johnson (JNJ), and Verizon Communications (VZ). Under normal circumstances, you can multiply these weightings by four to understand how concentrated CDC is. For example, while the nine equities listed below currently total 3.52% of the ETF, it would be 14.08% otherwise. Considering there are 101 holdings in total, it’s close to equal weight.
VictoryShares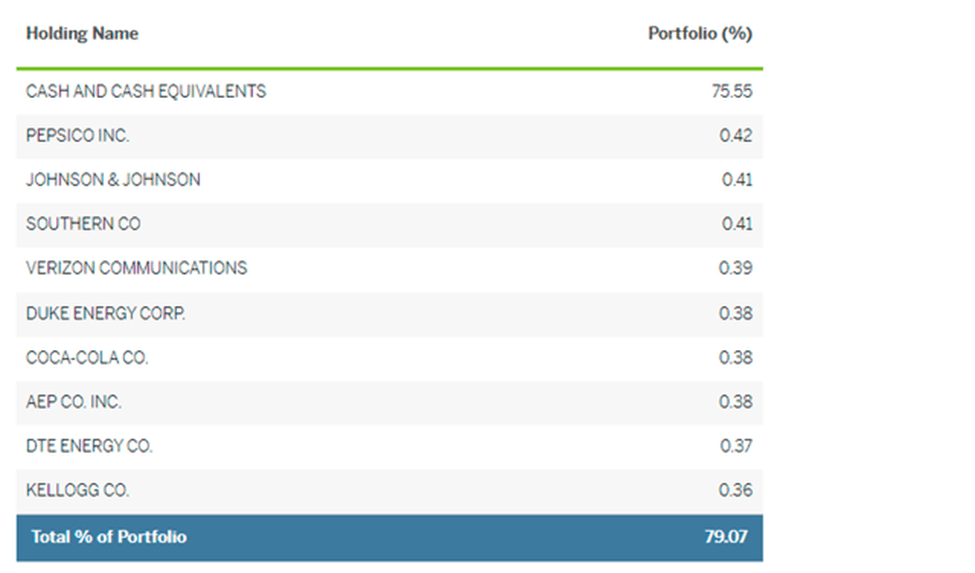
CDC overweights Utilities, Financials, and Consumer Staples stocks mostly. It has minimal exposure to Industrials, Technology, Energy, and Materials, with no exposure to Real Estate. Out of the ETFs listed below, the Schwab U.S. Dividend Equity ETF (SCHD) is probably the best-diversified and competes with CDC from a dividend yield perspective.
Morningstar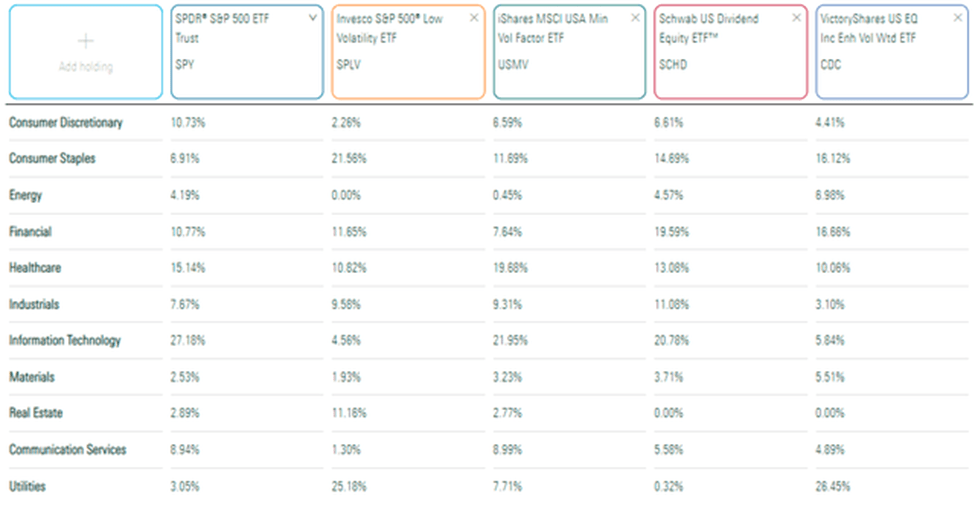
Performance
There are 25 large-cap low-volatility-focused ETFs available, which I listed recently in my article on the iShares MSCI USA Minimum Volatility Factor ETF (USMV). CDC has the best three- and five-year returns out of them all. Here’s how it compares against USMV and SPLV, the two largest by AUM.
Portfolio Visualizer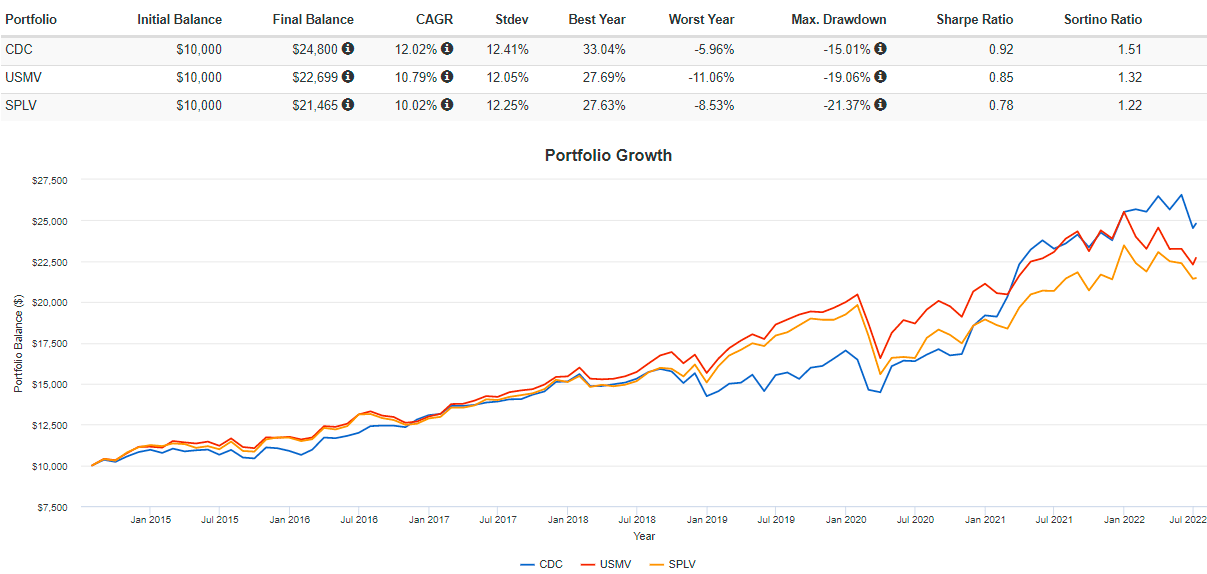
Since August 2014, CDC has gained an annualized 12.02% compared to 10.79% and 10.02% for USMV and SPLV. Importantly, its maximum drawdown of 15.01% in Q1 2020 was by far the best. CDC went 25% cash in March 2020, demonstrating its focus on capital preservation.
CDC’s nearest competitors in terms of total returns are the Fidelity Low Volatility Factor ETF (FDLO) and the Franklin Liberty U.S. Low Volatility Factor ETF (FLLV). Since FDLO’s inception in September 2016, CDC has gained an annualized 12.57% compared to 12.28% and 12.16% for FDLO and FLLV. However, the graph below highlights how CDC has played catchup since early 2018. For me, it’s a realization that CDC’s underlying equity portfolio likely isn’t optimal, and there was at least one time in December 2018 when the long/cash strategy cost investors over 5%. These are realities we shouldn’t ignore, as impressive as CDC’s historical results are.
Portfolio Visualizer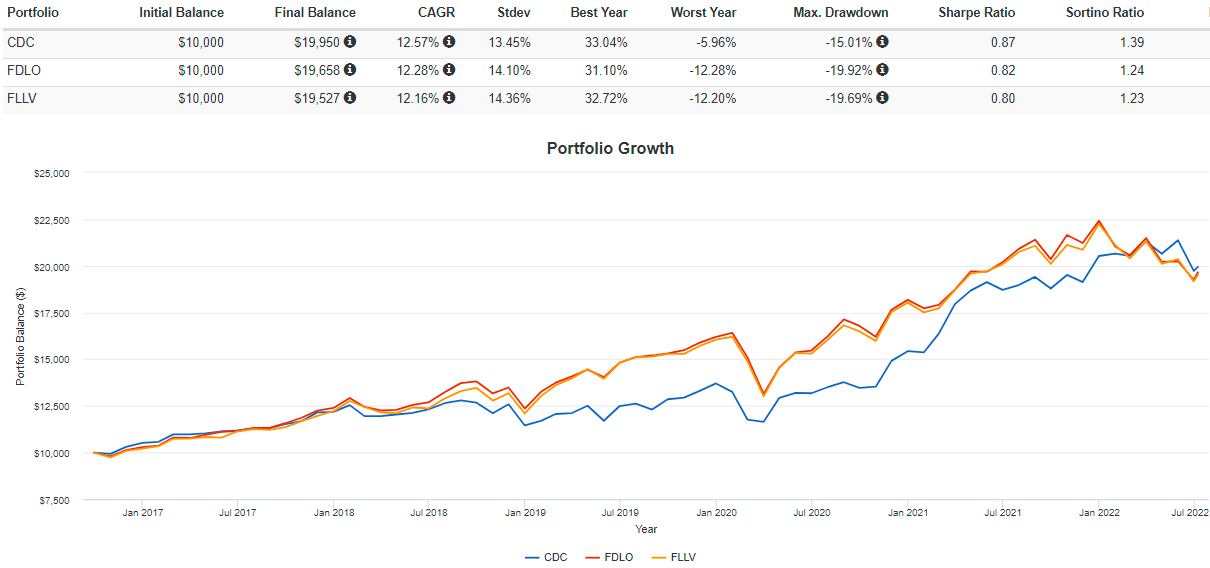
Long/Cash Strategy Analysis
In my previous article, I noted how the Reference Index closed 12.11% below its all-time high price on December 31, 2018, triggering a switch to 75% cash that ultimately cost CDC shareholders 5.39% as markets quickly recovered. On February 28, 2020, the Reference Index closed 14.85% below its all-time high price, triggering another switch to 75% cash that ultimately saved investors 18.17%. Taken together, it was a win for CDC shareholders, but a legitimate concern is that markets will bounce back quickly as they did in 2018, and over time, CDC’s advantage will be negated.
We can look at market returns back 20+ years to see what happens when we apply the rules for CDC’s Index. Please note that I initially planned on using backtested Index returns available from September 2000 to May 2014. However, the results were too absurd to be taken seriously, so I changed my approach.
The Sunday Investor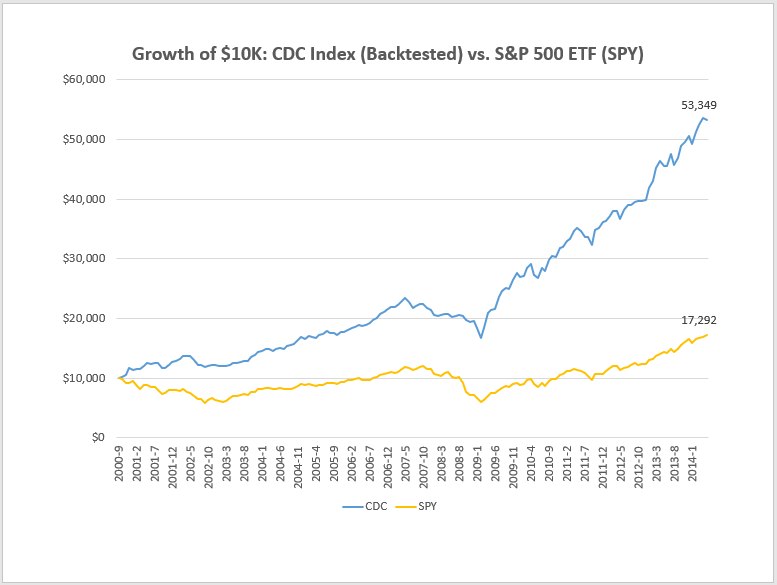
Instead, I decided to take the actual returns of the SPDR S&P 500 ETF (SPY) and adjust the 8% rule based on CDC’s five-year beta of around 0.80. Therefore, instead of an 8% drop, we’re looking for a 10% drop (8% / 0.80) from its high price. The following table summarizes these results.
The Sunday Investor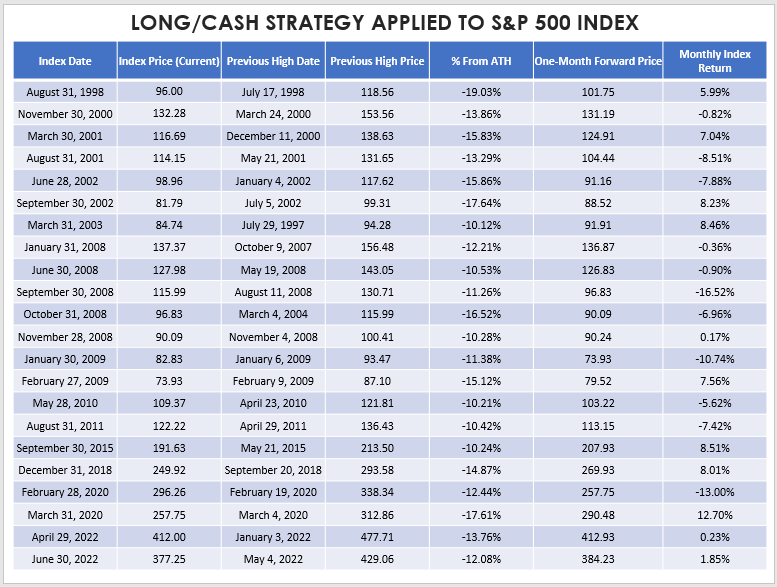
Let’s begin in the early 2000s, when market fluctuations were wild. On March 30, 2001, SPY closed at 116.69 and was 15.83% down from its 138.63 high price set on December 11, 2000. CDC would likely have gone 75% cash at that point, but SPY gained 7.04% the following month. However, on August 31, 2001, the situation was reversed. SPY was down 13.29% off its high price of 131.65 but fell an additional 8.51% in September. The same thing happened in June 2002, but the strategy failed again in September 2002 and March 2003.
Fast-forward to the Great Financial Crisis in 2008, where the strategy shined. SPY closed September 11.26% off its high price set on August 11 and lost 16.52% in October. After this loss, the rules would call for a 50/50 split between cash and equities, but SPY fell a further 6.96%. The strategy was successful again in February 2009, avoiding much of the market’s 10.74% loss. Finally, it failed the next month when it missed out on a 7.56% gain. All told, it’s clear CDC would have significantly protected shareholders during the worst market crisis in the last 20 years.
CDC’s strategy won’t work all the time. Actually, the data above suggests it works only half the time (11/22 instances). But it protects you from significant losses like in Q4 2008 and Q1 2020. That, coupled with an already low-volatile portfolio, should make it a good long-term investment.
Equity Fundamentals
The table below highlights volatility, growth, valuation, and profitability metrics for CDC’s top 20 industries, which total 81.20% of the ETF. That makes it much more concentrated than SPY, with a heavy focus on Electric and Multi-Utilities that provide additional downside protection.
The Sunday Investor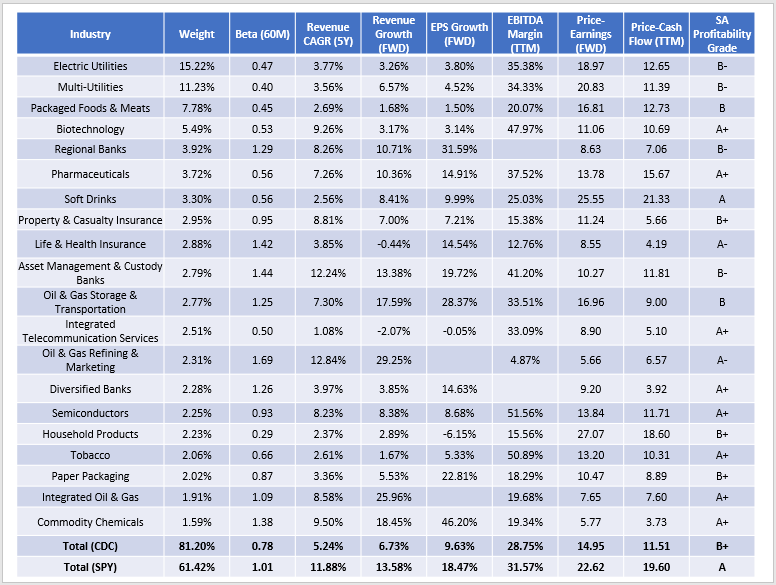
CDC’s five-year beta is currently 0.78 and has a much lower risk/reward profile than SPY. Constituents have grown revenues at a 5.24% annualized rate over the last five years compared to 11.88% for SPY. Estimated revenue and earnings per share growth rates are also approximately halved. In exchange, CDC’s forward price-earnings ratio is only 14.95, nearly eight points less than SPY. There’s also a bit of quality sacrificed, as CDC’s net EBITDA margin is 2.82% less (28.75% vs. 31.57%), and that’s reflected in a lower Profitability Grade as calculated by Seeking Alpha (B+ vs. A).
Low volatility and low valuation are the key factors markets have favored this year, and CDC has them in spades. It’s no wonder it’s been a top-performing ETF. Some investors may be concerned with high Utilities exposure in a rising rate environment, but I addressed this in March, and the sector has held up quite well since. For investors expecting markets to get worse before they get better, CDC looks to be on solid footing for when it reinvests fully in equities again, possibly as early as next month.
Why Pay Fees For This?
I’ve come across a few commenters on previous articles questioning why bother paying an above-average 0.36% expense ratio just for the portfolio to switch to cash after markets fall 8%. After all, you can do that yourself for free. You also maintain more control since you don’t have to wait until the end of the month to make that determination, which is how CDC operates. These are all good points, but I would like to counter with the following.
1. There are potential tax consequences for frequently trading in and out of a portfolio that you won’t have to deal with by going the ETF route.
2. The 0.36% expense ratio is primarily a concern for medium-to-long-term holders. The chart below highlights the percentage of gains lost to fees assuming a continuously compounded 10% annual return. I’ve bolded CDC’s 0.36% expense ratio and USMV’s 0.15%, showing that 3.94% of CDC’s total gains are lost to fees compared to 1.64% for USMV for the first three years of ownership. That’s significant, but I don’t think it’s unreasonable to believe CDC can’t make up the 2.30% difference over three years.
The Sunday Investor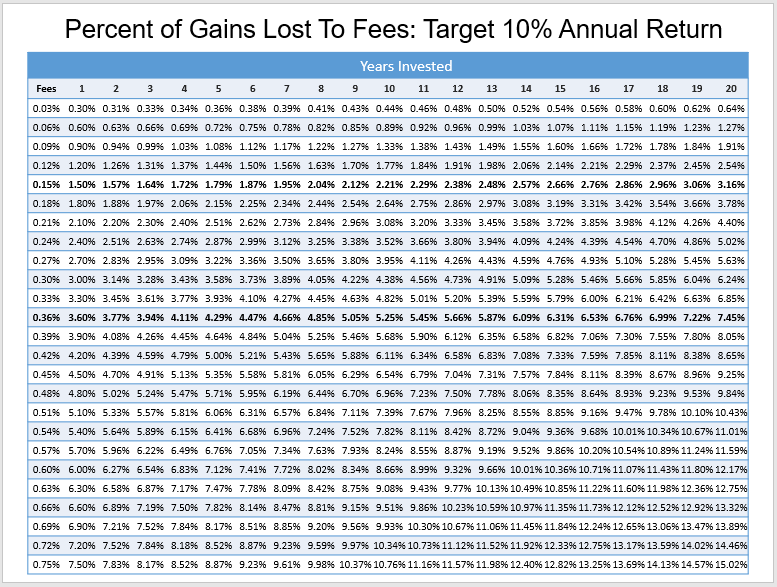
However, the higher fees are a little harder to justify as you lengthen your holding period. Over 20 years, 7.45% of CDC’s total gains will be lots to fees compared to 3.16% for USMV. If you opt for the iShares Core S&P 500 ETF (IVV) with a 0.03% expense ratio, only 0.64% is lost to fees.
In the earlier analysis, I showed that CDC’s strategy only works about half the time. Given the higher fees, it’s probably best used only when there are reasons to believe markets are at significant risk. With inflation now at 9.1% and the yield curve inverting again, I’d argue we’re in one of those moments.
3. Depending on your personality, an automatic reallocation of assets may suit you well. You have to ask yourself how likely it is you will monitor the markets monthly and reallocate accordingly. What we think we will do and what we end up doing are sometimes different, and I think most investors can benefit from having at least a portion of their portfolio be completely unemotional.
4. CDC offers a 3.05% dividend yield, 1.60% higher than USMV’s. The freedom to reinvest or take cash payments is important, especially for investors in or near retirement. How much that’s worth will differ for each investor, but I’m confident it’s at least something. Low-cost alternatives with similar yields include the iShares Core High Dividend ETF (HDV) and SCHD.
Investment Recommendation
CDC’s underlying equity assets have a low 0.78 five-year beta and a low 14.95 forward price-earnings ratio, two factors that market participants have favored this year. It’s been the best-performing low-volatility ETF in the last three and five years, partially because its strategy called for it to exit equities by 75% when markets fell by 8%. For example, in March 2020, CDC was only 25% invested and thereby avoided the worst month for equities in recent memory. It wasn’t fully invested by April when the market recovered, but the net return was still advantageous to shareholders.
In this article, I applied the strategy to the S&P 500 and found that it only works about half the time. This limits its usefulness as a set-it-and-forget-it ETF over the long term, especially when accounting for fees. However, it will limit your losses in downturns, make you a more unemotional investor, pay you more in dividends, and potentially offer some tax advantages. For me, these are good enough reasons to own. Until I see evidence of the market downturn being complete, CDC remains a buy.
Be the first to comment