

Grand Warszawski/iStock Editorial via Getty Images
Tales from the bond market
When seeing to anticipate movements in the U.S. stock market, the best sources of information often come from other capital market segments. One particularly useful asset class for explaining expected stock market performance is the bond market. More specifically, a specialized category deep within the bond space has been a notably strong predictor of future stock market performance.
Most speculative, also predictive
The high yield corporate category holds a special space within the bond market universe. Unlike most of the other major segments such as U.S. Treasuries (TLT) and mortgage backed securities (MBS) whose returns are effectively uncorrelated if not negatively correlated to U.S. stocks and investment grade corporate bonds (LQD) that have only a low positive correlation, the high yield corporate bonds have returns that are highly correlated with U.S. stocks with a correlation coefficient in the +0.75 range (+1.00 is perfectly correlated).
But while the overall high yield market historically has been a coincident indicator of stock market performance (in other words, U.S. stocks and high yield bonds will typically reach inflection points at roughly the same time), the lowest quality subset of the high yield bond space stands out as different. Historically, shifts in high yield bonds rated CCC or lower have reliably foreshadowed eventual shifts in U.S. stocks with varying lead times. As a result, closely monitoring the option adjusted spreads over comparably dated U.S. Treasuries for CCC-rated and lower corporate bonds is useful in anticipating future stock market movements. And monitoring this reading may be particularly useful as we make our way through the final weeks of summer.
Six for six in the new millennium
Let’s consider the past six examples over the past quarter century to show how CCC-rated and lower spreads have predicted key inflection points in U.S. stocks.
For the purposes of this review, we will show the ICE BofA CCC & Lower US High Yield Index Option-Adjusted Spread on an inverted scale against the Wilshire 5000 Index, which is a stock index that effectively covers the entire U.S. stock marketplace. When CCC and lower spreads are widening, which means investors are becoming more risk averse, this will be reflected by the red line falling in the charts below.
Tech bubble
We’ll begin with arguably the most dramatic and longest example of this lowest high yield rung predicting what would eventually come for U.S. stocks that took place during the inflating and eventual bursting of the tech bubble at the start of the millennium. CCC and lower spreads bottomed at just over 5% back in late 1997 and began widening. As the stock market continued to soar into early 2000, CCC and lower spreads blew out by more than nine percentage points to over 14%. In other words, the lowest quality high yield bonds were screaming for a couple of years about the danger that eventually befell stocks by March 2000.
Federal Reserve Bank of St. Louis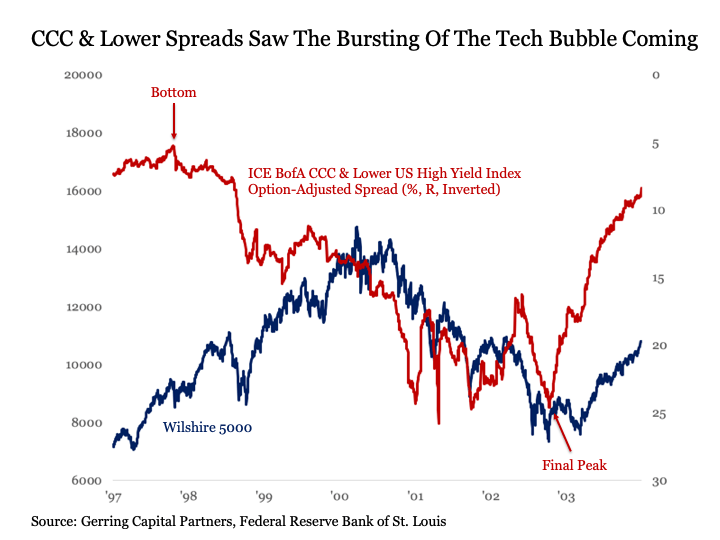
It is worth noting that the CCC and lower signal cuts both ways. While stocks did not reach a final bottom until March 2003, spreads on this lowest quality bond rung peaked in October 2002 and spreads had sharply narrowed by the time the final stock lows came roughly six months later.
GFC
Let’s move on to the Great Financial Crisis starting in 2007. For this instance, investors needed to be watching more closely, but the signs were still there. CCC and lower spreads bottomed in early June 2007 at just over 4%. More than a month later in mid-July 2007, the U.S. stock market reached its first peak. And by the time U.S. stocks arrived at their final peak roughly four months later in October 2007, CCC and lower spreads had widened by more than three percentage points to well over 7%. In short, trouble was clearly brewing. And the fact that CCC and lower spreads continued to blow out further as the stock market descended into 2008 provided confirmation that the bottom was not anywhere close to being in as some were inaccurately predicting at the time.
Federal Reserve Bank of St. Louis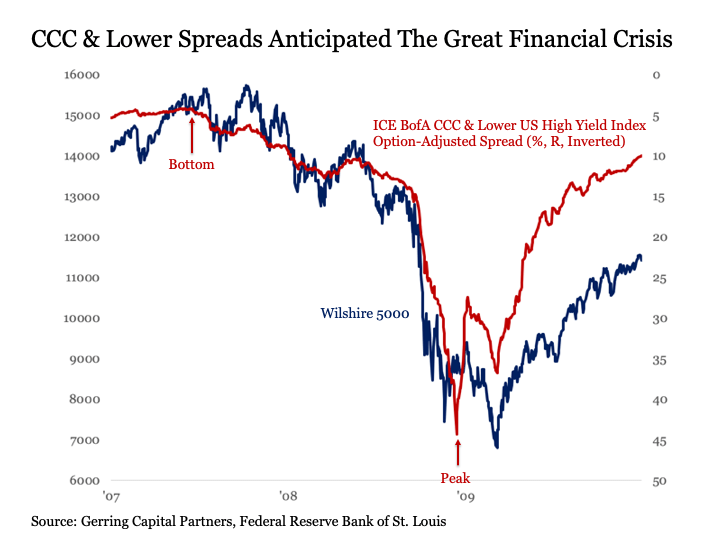
CCC and lower spreads once again also predicted the final financial crisis market lows. For while the U.S. stock market did not reach its final bottom until March 2009, CCC and lower spreads had reached their final peak more than three months earlier in December 2008 and had narrowed by roughly ten percentage points by the time stocks were hitting their final lows.
European Debt Crisis
We’ll continue forward to a relatively more minor but still notable episode in the European Debt Crisis, which took hold in a meaningful way in the summer of 2011. CCC and lower spreads bottomed at around 7.5% in mid-February 2011. By the time the U.S. stock market peaked more than five months later in late July 2011, CCC and lower spreads had widened by roughly two percentage points to just below 9.5%. A measurable correction subsequently followed that continued through October that year before finally bottoming.
Federal Reserve Bank of St. Louis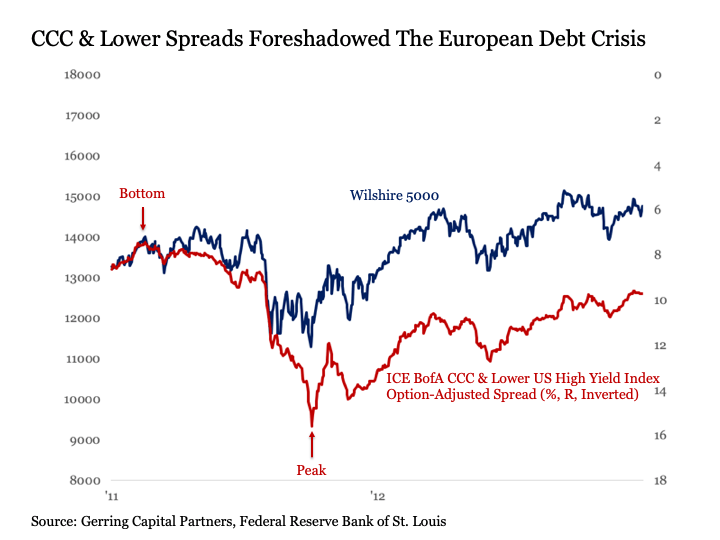
As CCC and lower spreads continued to narrow, so too did the U.S. stock market continue to rise from its lows.
Oil glut
Our next episode took place with the onset of the oil glut in the mid-2010s. CCC and lower spreads bottomed in June 2014 at around 6.25%. As the stock market continued to rise for roughly another year through mid-2015, CCC and lower spreads blew out by more four percentage points to around 10.50% by the time the stock market finally peaked before falling into correction. Although markets rallied strongly toward the end of 2015, CCC and lower corporate bonds signaled that we were not out of the woods just yet, as spreads continued to widen further while stocks were rebounding.
Federal Reserve Bank of St. Louis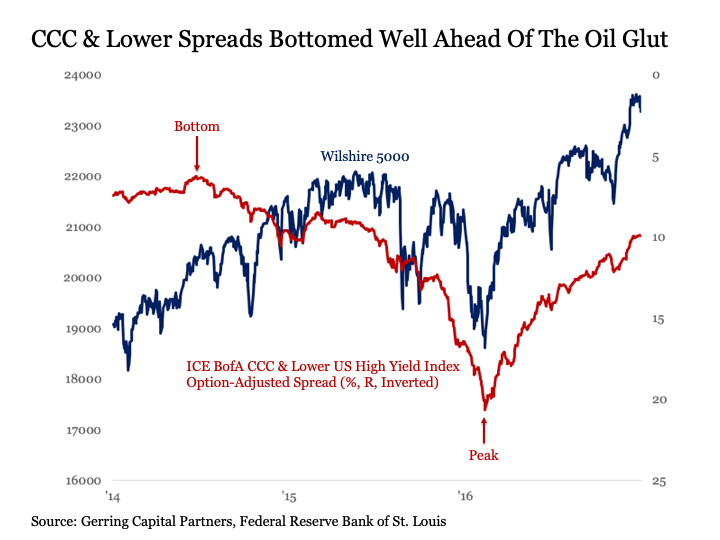
It was not until February 2016 when stocks finally bottomed along with CCC and lower spreads peaking. And this time, the sustainability of the rally was confirmed by the fact that CCC and lower spreads were also steadily narrowing.
COVID
While the stock market was shocked by the onset of COVID in February 2020, CCC and lower bonds had been signaling that underlying economic and market trouble was afoot long before the outbreak of the health crisis. CCC and lower spreads bottomed all the way back in October 2018 at around 6.6%. Although U.S. stocks continued to rise for another year and a half before peaking in February 2020 with the outbreak of the pandemic, CCC and lower spreads had been steadily widening by roughly five percentage points to more than 11.5%. In other words, COVID was simply the match that ignited a burgeoning stock market problem that had been already brewing for well over a year.
Federal Reserve Bank of St. Louis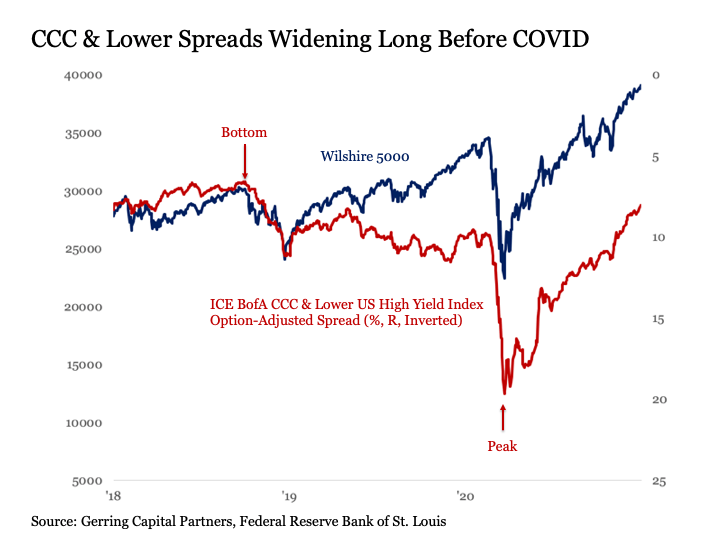
And a signal to confirm that the economy and markets were on the mend thanks to the monetary policy firehose that was blasted onto capital markets in response to COVID, CCC and lower spreads steadily narrowed along with the stock market rally.
Which brings us to today
Applying the same principles seen during the past five episodes mentioned above covering most of the past quarter century, it should have come as no surprise that stocks finally peaked in January 2022 and have been falling much of the year since until the past month. CCC and lower spreads bottomed back in July 2021 at around 5.75%. While U.S. stocks continued to rise through the start of January 2022, CCC and lower spreads had widened by as much as 150 basis points. In the months since as stocks accelerated their move to the downside, CCC and lower spreads blew out to as much as 12.25% by the Fourth of July.
Federal Reserve Bank of St. Louis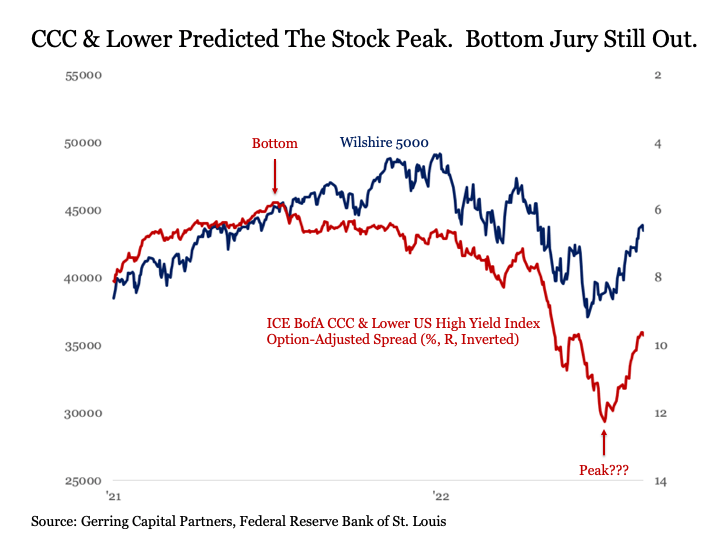
The key to watch in the days and weeks ahead
This brings us to the critical bottom line point as we make our way through the rest of August to Labor Day weekend. U.S. stocks have rallied strongly since mid-June. Initially, CCC and lower spreads were not confirming this move, as spreads continued to widen as stocks found their footing. But since early July, CCC and lower spreads have narrowed measurably as U.S. stocks continued to rally.
This is a decidedly positive signal for U.S. stocks, but one that should be taken with qualifications. For it is not unusual for CCC and lower spreads to narrow meaningfully during a risk-on phase for stocks, but this narrowing ultimately turns out to be a head fake. Eventually CCC and lower spreads start to widen out again, and eventually the U.S. stock market gets pulled down with it as investor risk appetites for default and equity premium dampen.
As a result, it will be worthwhile to monitor CCC and lower spreads daily over the next few weeks. For if spreads continue to narrow as stocks maintain their rebound, this bodes well for the sustainability of the bounce. Conversely, if CCC and lower spreads start to sustainably widen again in the coming weeks, this would be a signal that the recent stock rally may ultimately prove fleeting even if stocks maintain their upside movement into September.
Right now, signs from CCC and lower bonds remain encouraging. But keeping a close watch on this important leading indicator for stocks will be crucial in the days and weeks ahead.
Be the first to comment