

Pgiam/iStock via Getty Images
Introduction:
What is the put-call ratio?
The put-call ratio is calculated by dividing the daily volume of traded put options by the daily volume of traded call options. A call option is giving the owner the right (but not the obligation) to buy a certain amount of an underlying security at a specified price within a specified time (whereas the put option, in contrast, grants the holder the right to sell at a specified price within a specified time).
What is the theory behind the put-call ratio as contrarian indicator?
A holder of a call option will pocket a profit if the underlying security rises within a pre-defined period above a certain limit price (whereas the reverse is true for holders of a put option). As a result, both forms are hard cash bets on the future direction of the underlying security. The aggregated volume of all equity options is expressed as put-call ratio and can be then used to gauge investors sentiment.
For example, a put to call ratio of 1 shows that the volume of put options exactly matches the volume of call options on that given day. Extreme ratios within the put-call ratio occur when most option traders are betting on the same direction of the underlying security. Given the fact that, on average, 90% of option traders lose money, such strong imbalances in the put-call ratio should theoretically be a good indicator to pinpoint trend reversals.
How to use the put-call ratio for trading?
At a first glance, extreme values in the CBOE put-call ratio have, indeed, often occurred near or at major inflection points in the S&P 500 (SPY). Especially, stronger spikes in the CBOE put-call ratio look like they occurred quite regularly near or at market bottoms. Low put-call ratios in contrast, also look somehow relevant although they seem to appear less significant in identifying market tops.
Chart 1: CBOE Put-Call Ratio vs. S&P 500 (wallstreetcourier.com)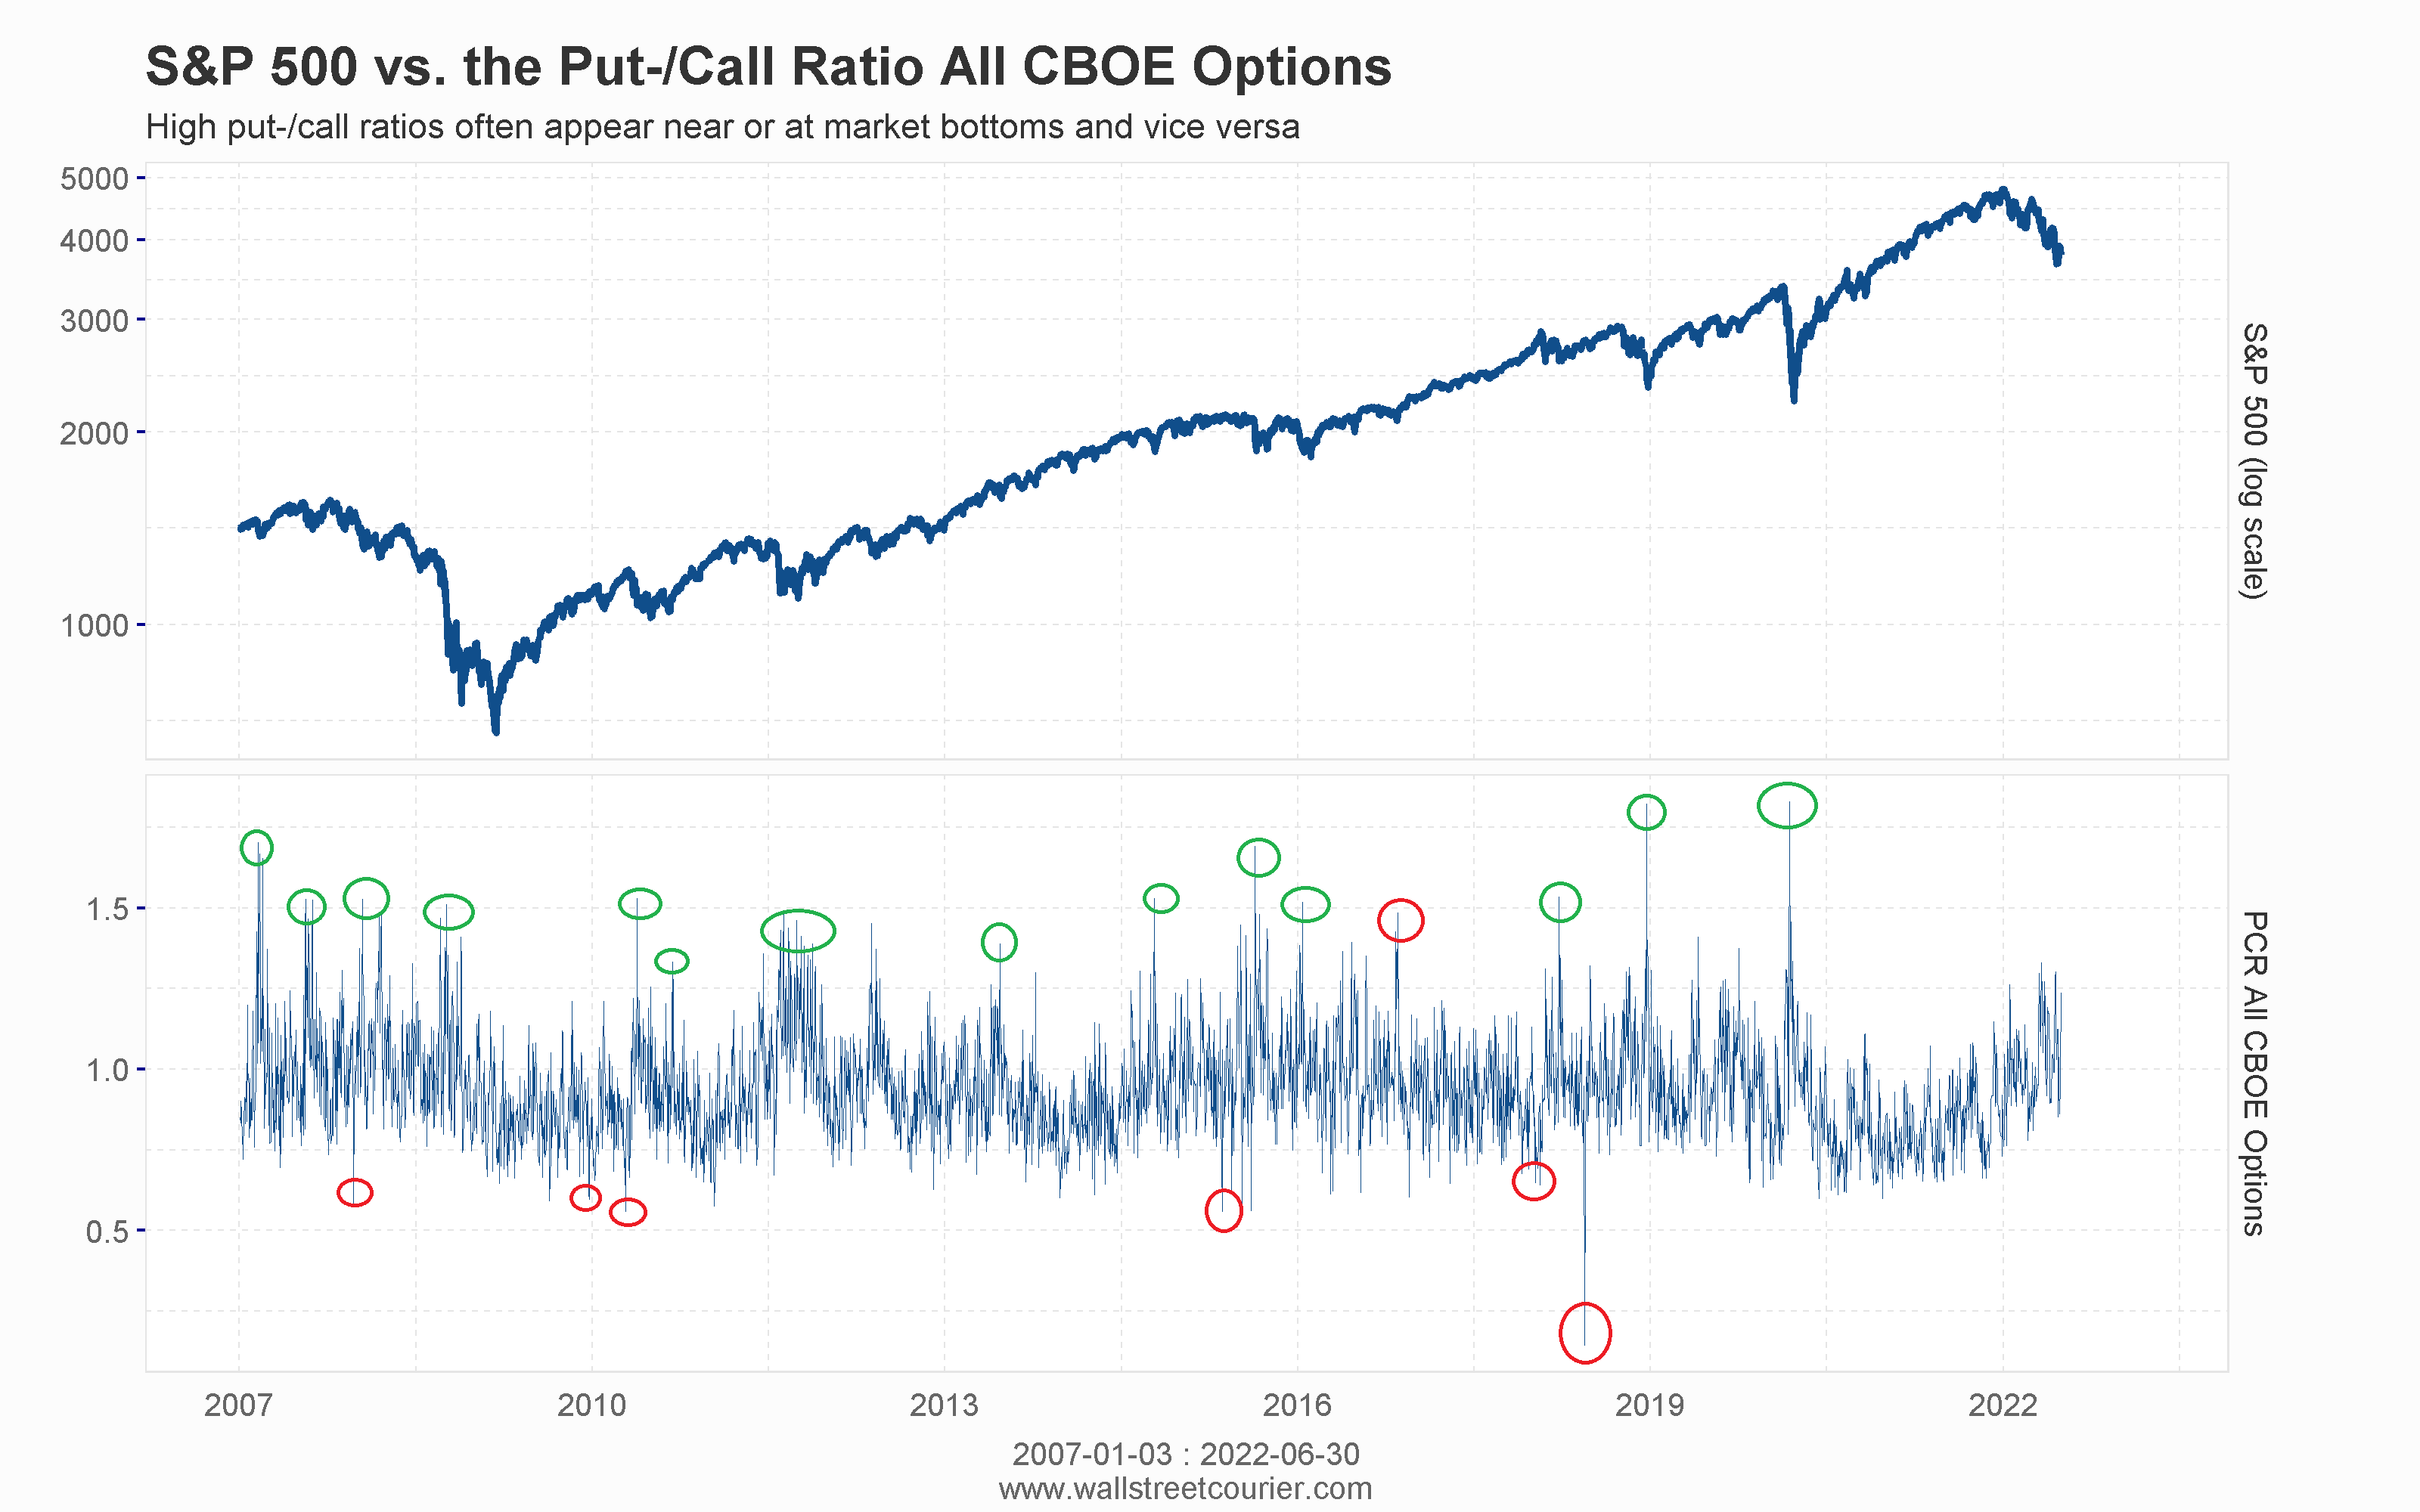
Statistical Analysis of the CBOE Put-Call Ratio:
To evaluate if a trading strategy based on the put-call ratio provides any value to investors, we will first use descriptive statistics to derive extremes levels of greed and fear. This ensures a rational approach in identifying relevant buy and sell thresholds when sentiment hits contrarian levels.
Afterwards, we will calculate the forward-looking returns of these entry- and exit points and compare it with the average returns of the broad market. This is a widespread practice and allows statements about the statistical significance of the generated signals. The forward-looking returns are the average returns for a certain period after a specific signal occurred. The more they differ from the average returns of the underlying market, the higher the chances that these signals are significant from a statistical point of view.
Identifying contrarian greed and fear levels in the put-call ratio:
To define extreme values, we sort the put-call ratio (of all CBOE options) ranging from January 2007 until June 2022, from the highest to the lowest value. Afterwards, we calculate the mean and the threshold values which represent the top and bottom 5%, 10% and 20% of all observations. Top threshold values should coincide with extreme level of fear and bottom threshold values with high complacent within the option market.
Table 1: Extreme greed and fear levels of the put-call ratio (wallstreetcourier.com)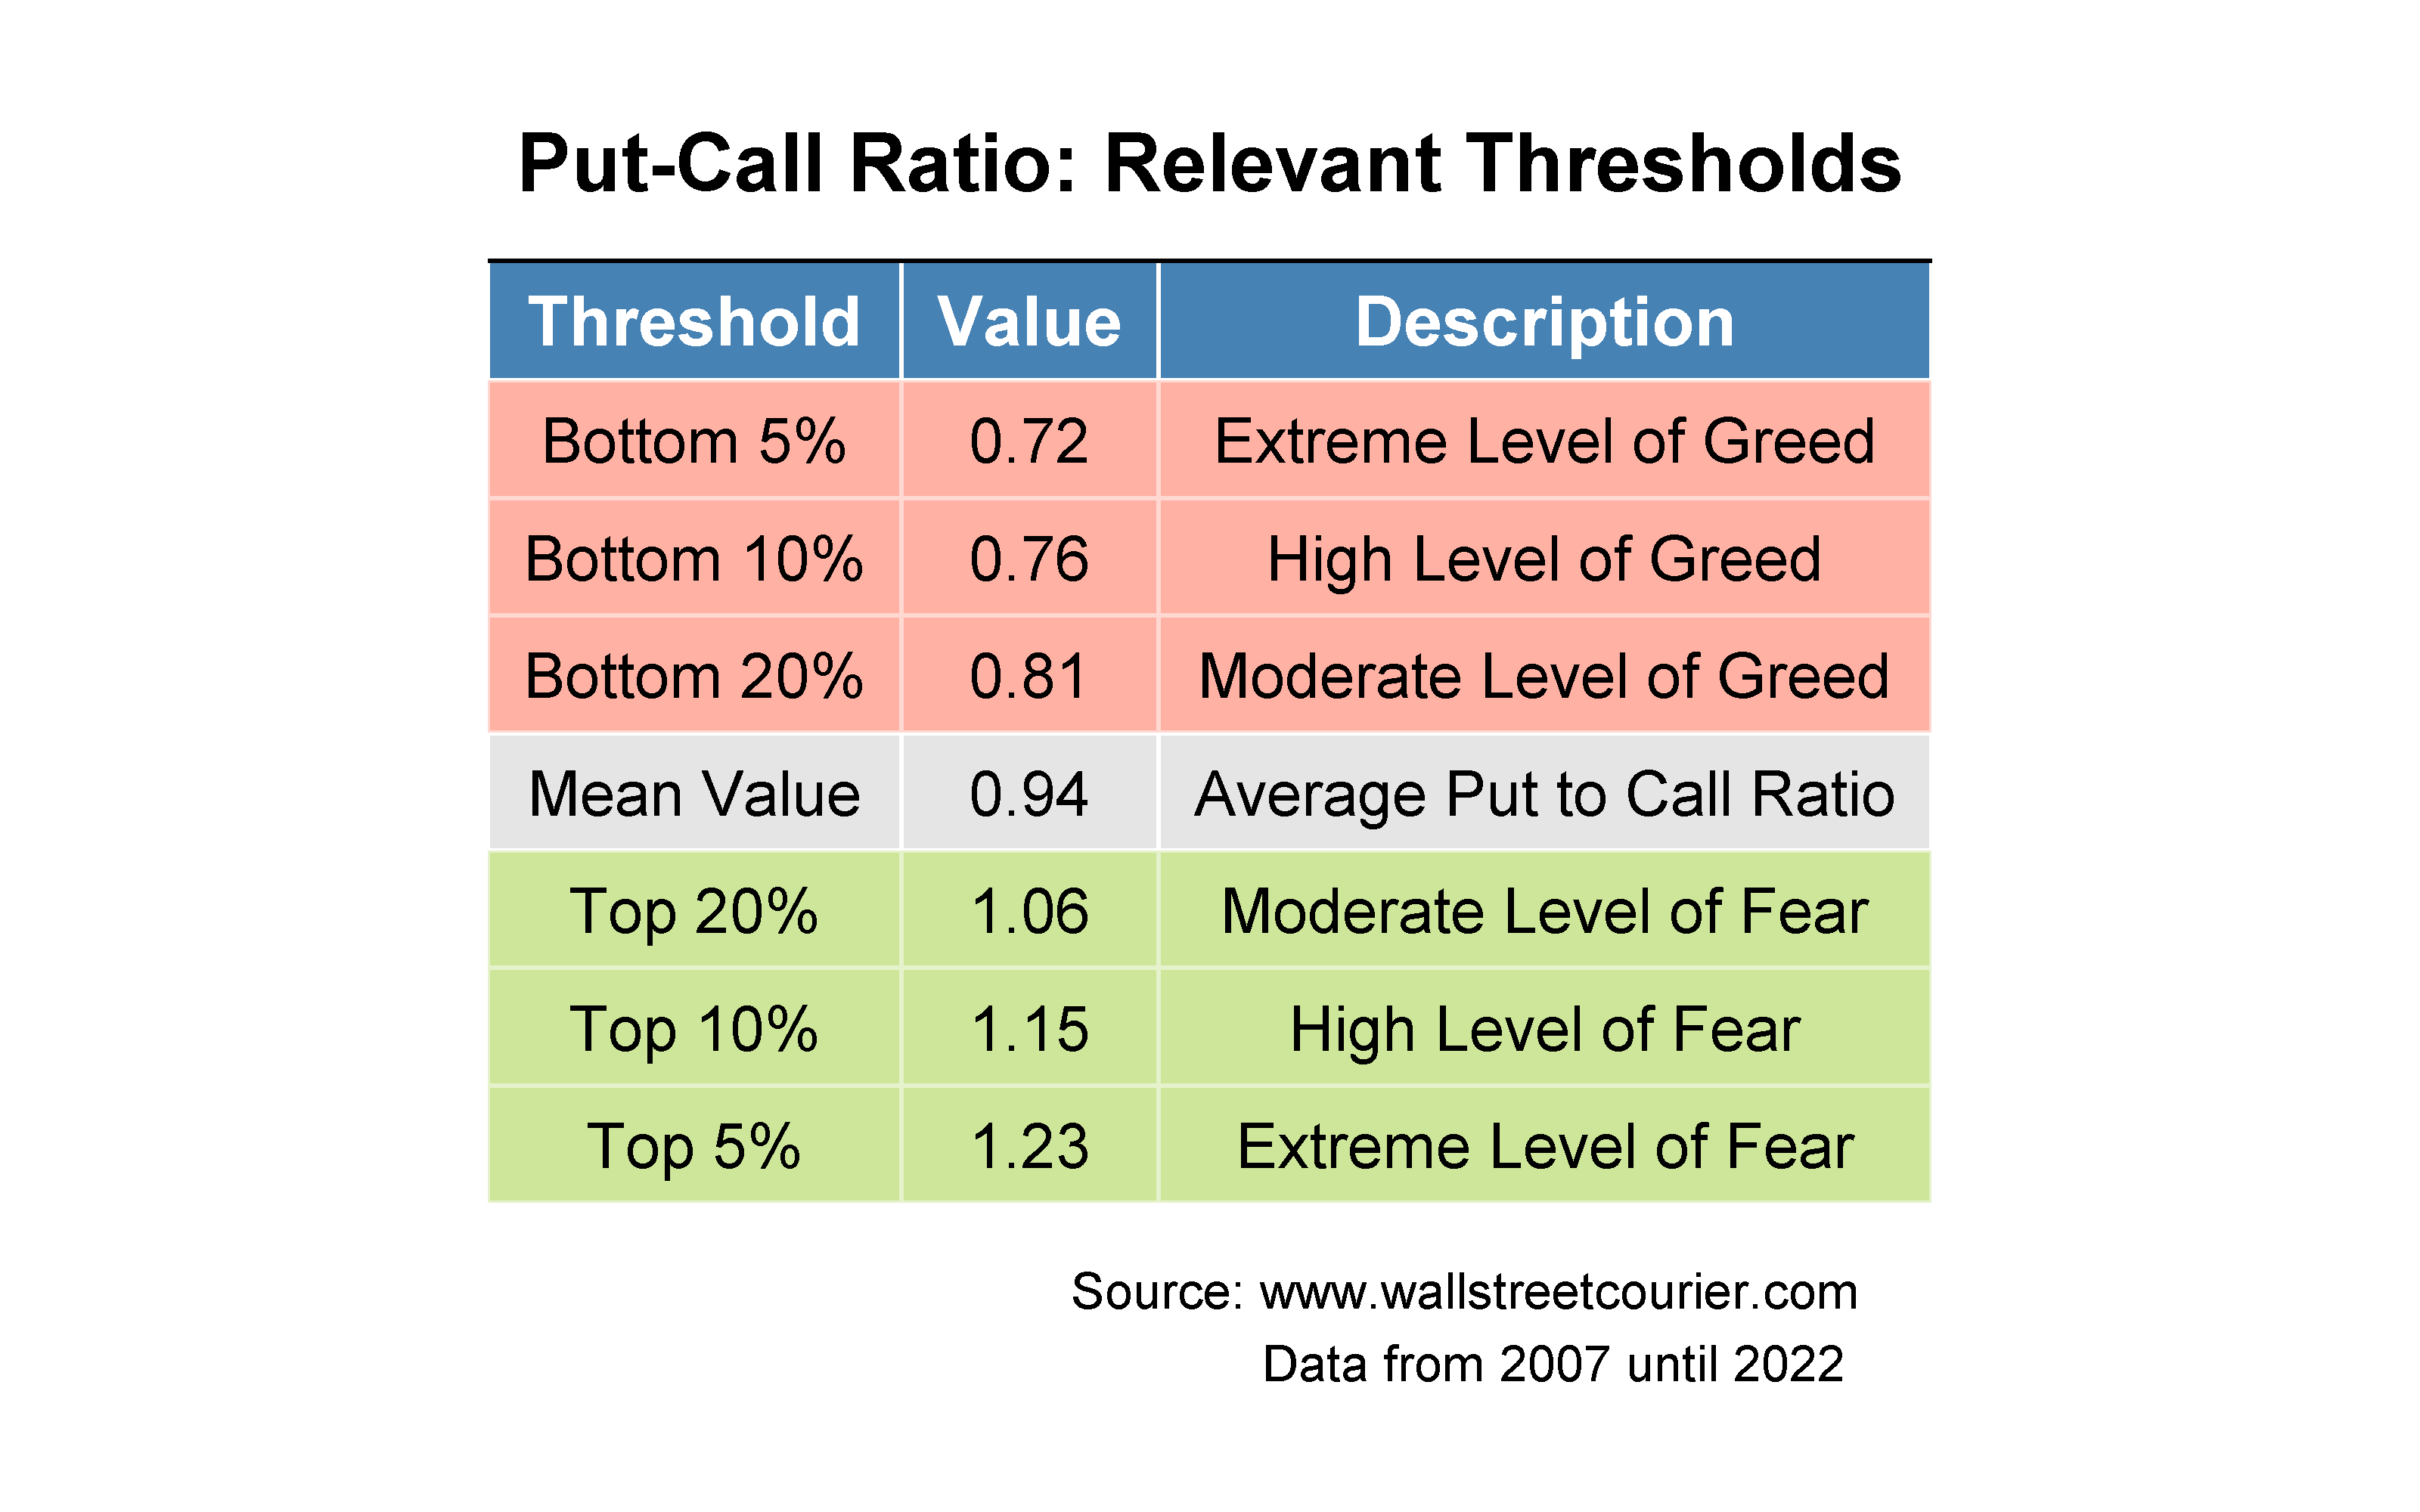
As shown in the table above, the average value of the CBOE put-call ratio since 2007 is 0.94 (and not 1). This makes sense since the market tend to rise in most of the cases. Therefore, there are normally slightly more investors buying call options than buying put options.
- In 5% of the time, the CBOE put-call ratio was below 0.72 (representing extreme levels of greed) or above 1.23 (representing extreme levels of fear).
- In 10% of all cases the CBOE put-call ratio was below 0.76 or above 1.15 (indicating high levels of greed and fear).
- In 20% of all observations the CBOE put-call ratio was below 0.81 and above 1.06 (showing moderate levels of greed and fear).
According to the contrarian theory, investors should buy if the put to call ratio passes the extreme fear threshold, and they should sell if market sentiment shows extreme greed within the option market.
Analyzing Forward-Looking Returns:
The best way to back test a contrarian put to call trading strategy is to analyze the average forward-looking return of the relevant entry- and exit signals (and compare it with the average returns of the broad market). This is a widespread practice and allows statements about the statistical significance of the used signals.
As input parameters, we will use the 5% of extreme put-call ratios shown in table 1, to calculate the average forward-looking returns for the next 5, 10, 30, 60, 90, 180 and 360 trading days (after the entry signal occurred). Afterwards, we will compare these returns with the average returns for the S&P 500 in the same period. We are aware that identifying thresholds on past data includes somehow a look-ahead bias, but given the stationarity of the data, the impact should be limited.
Historically, entry signals based on high put-call ratios have, indeed, shown stronger signs of statistical significance in generating above average market returns. The average forward-looking returns of the top 5% of all put-call ratios have outperformed the average returns of the S&P 500 by a larger extend between the following 30 and 60 days (with p-values below 5% as critical statistical threshold).
We have not found statistical significance for the following 5, 10 and 90 days, although these signals have also generated above average market returns.
Table 2: Average forward-looking returns of the top 5% of the put-call ratios (wallstreetcourier.com)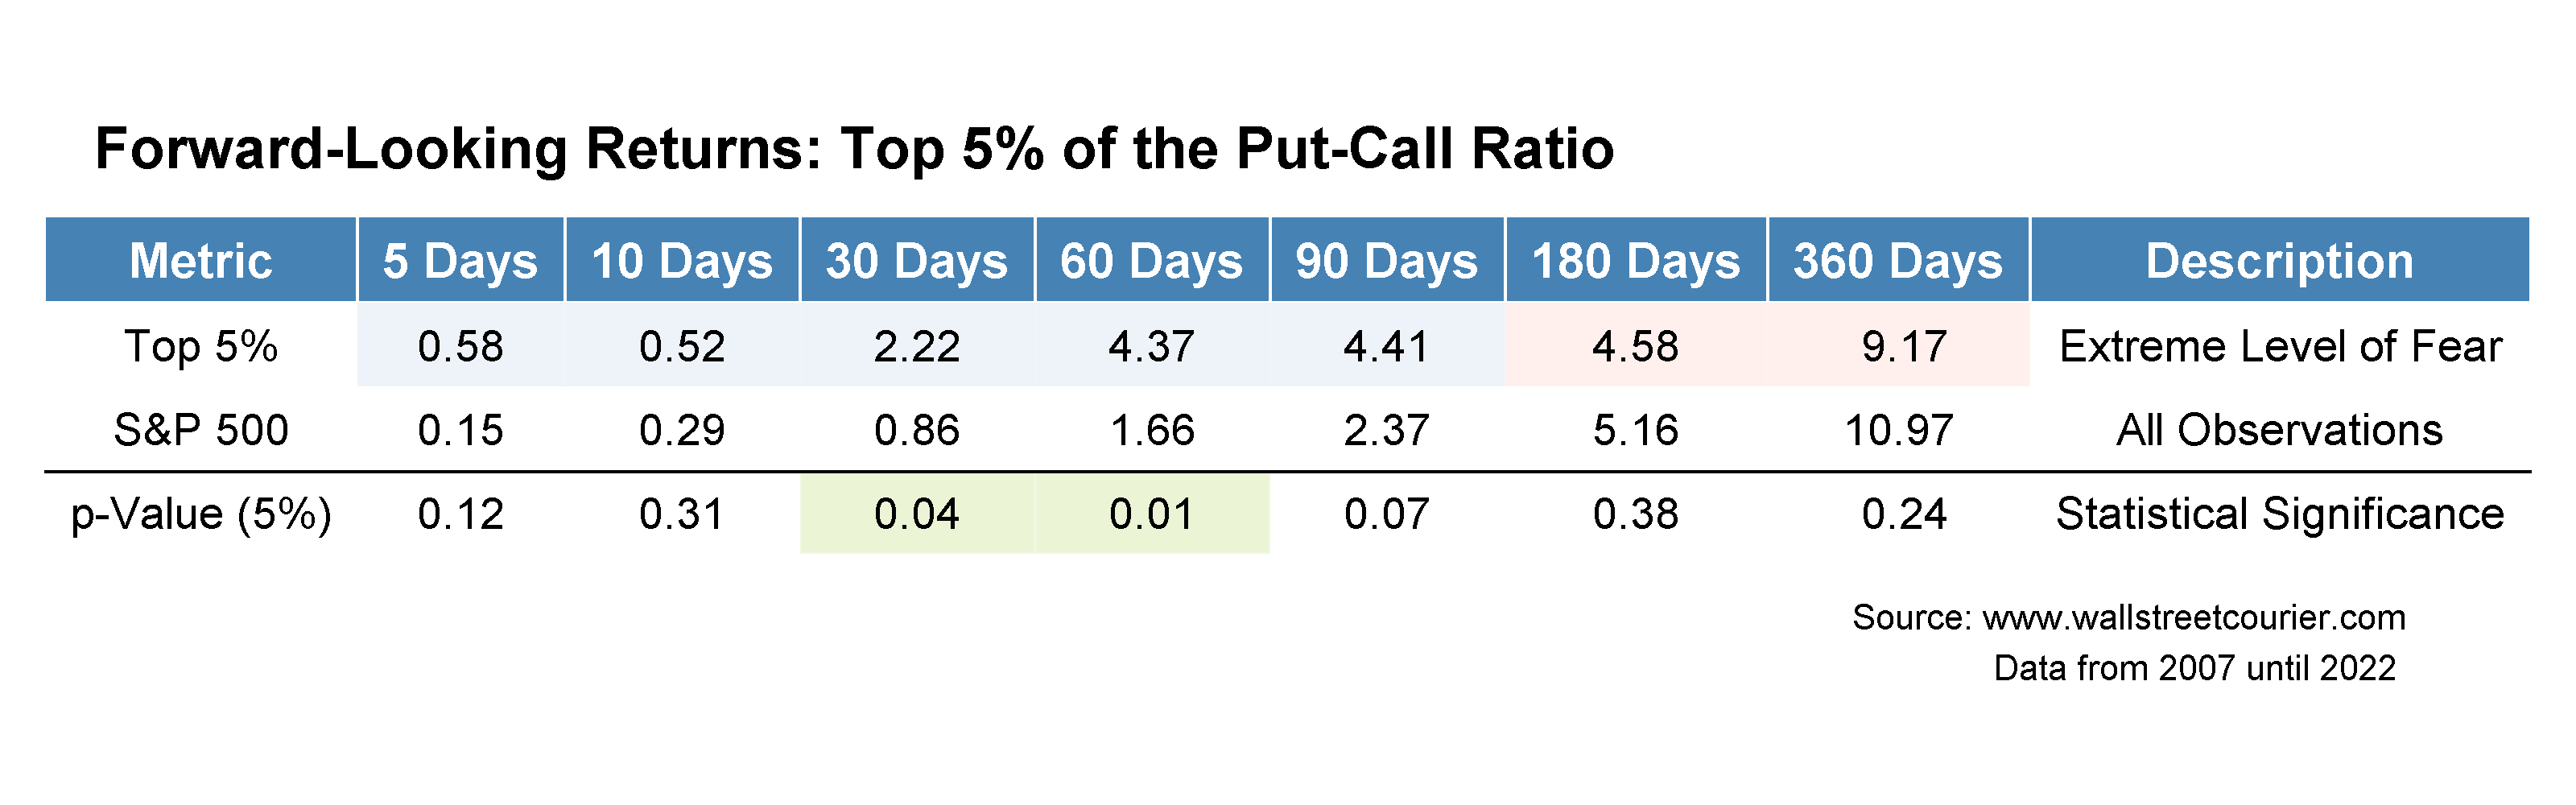
The bottom 5% of the put-call ratios have generated below average within the next 60 days the sell signal occurred. Although these results look quite promising, this underperformance was not significant from a purely statistical point of view (as the p-value is above the critical 5% threshold). Thus, low put-call ratios can be considered as useful information but should not be taken too seriously, when it comes to implement a contrarian driven investment strategy.
Table 3: Average forward-looking returns of the bottom 5% of the put-call ratios (wallstreetcourier.com)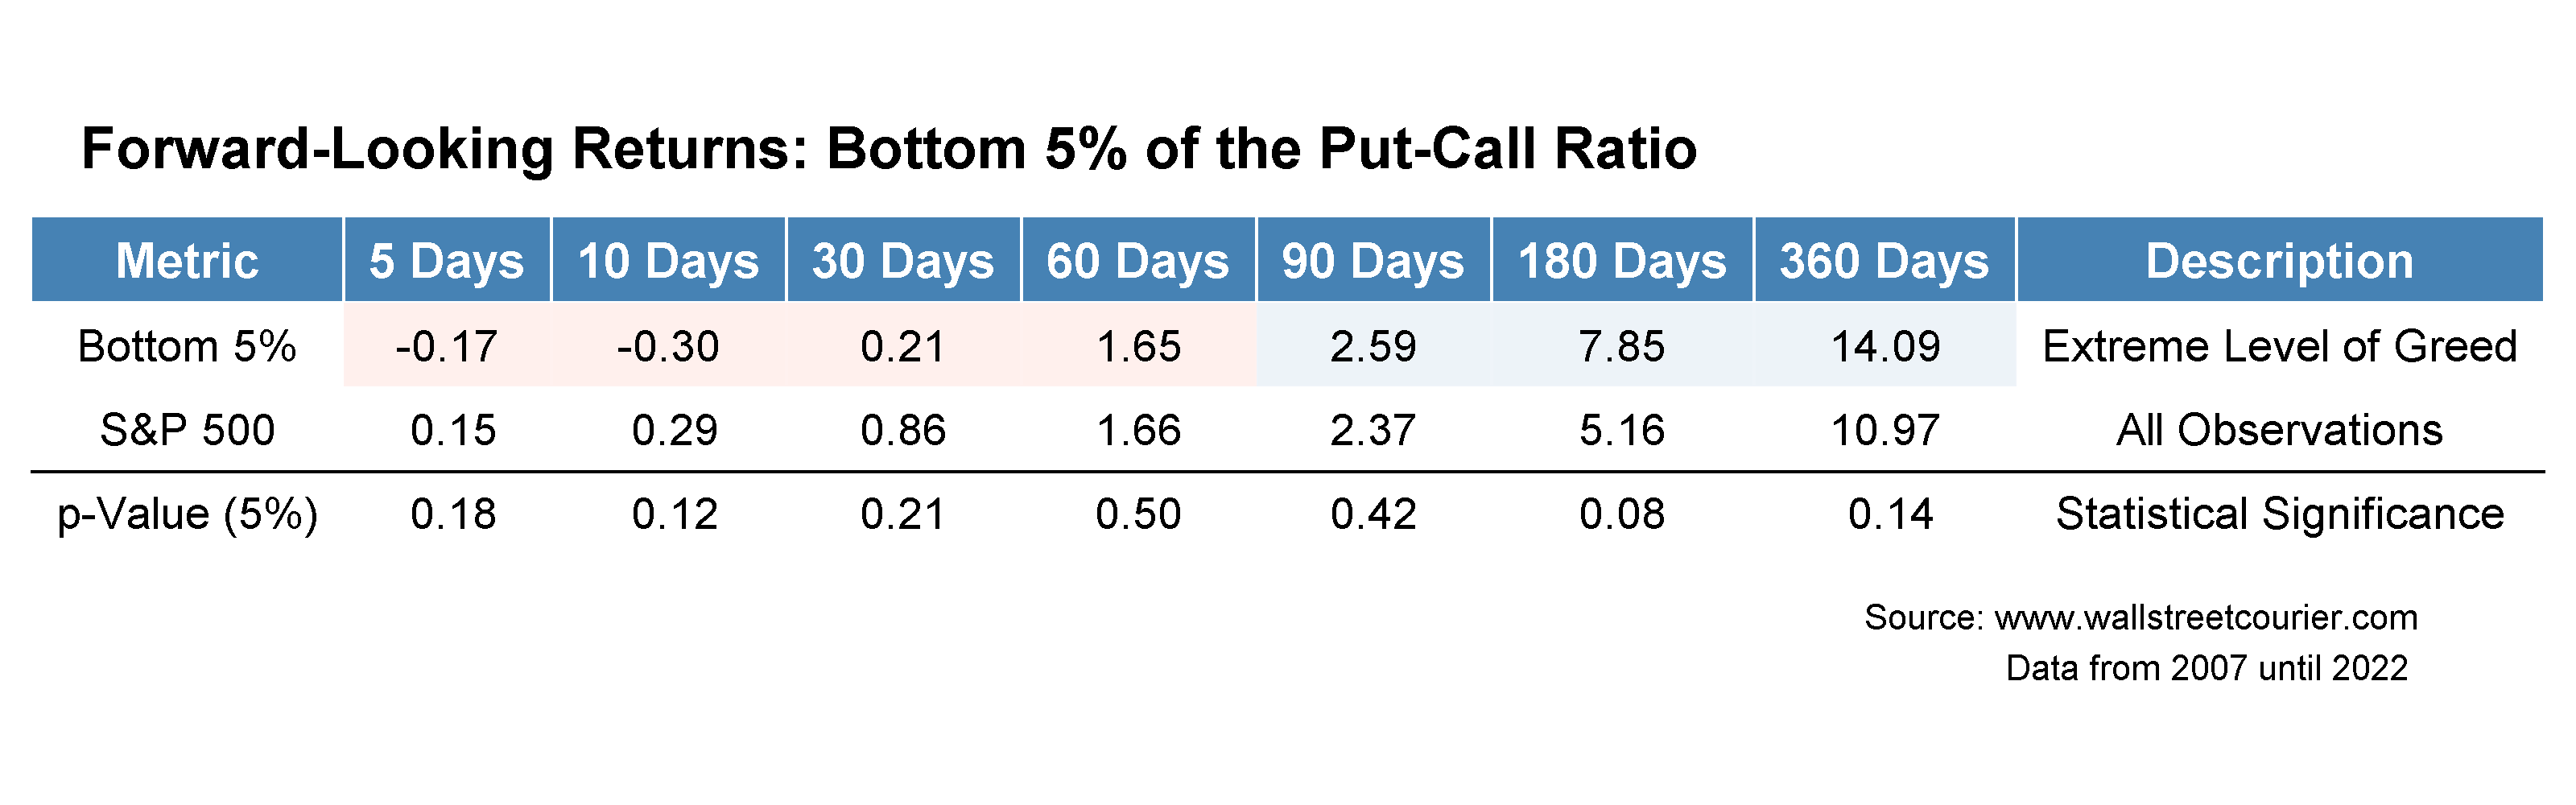
Summary and critical review:
Extremely high put-call ratios were historically, indeed, able to identify attractive entry points. Especially, the compelling above average returns after 30 and 60 days have shown high statistical significance. Thus, the put-call ratio can be a quite useful contrarian indicator to look at when market sentiment hits extreme negative levels. On the other side, the ability to generate reliable sell signals is limited. Although, market returns were below average within the following 60 days after the put-call ratio dropped to greedy levels, we have not found stronger statistical evidence for these results. Since low put-call ratios mostly occur during strong bull markets, it could be possible that high optimism within the option market might only cause consolidations and no major trend breaks within a positive market regime.
Although these results look quite promising, the biggest drawback of the put-call ratio is its limited number of trading signals. Additionally, most of the relevant signals occur in cluster, making it hard to exploit any statistical significance on a regular basis. Additionally, identifying greed and fear based on the full history of the put-call ratio might not reflect stronger and rapid shifts within normal ranges.
Excursus: Applying the Z-Score to Improve Results from the Put-Call Ratio
To overcome the shortcoming of rare and non-adaptive signals based on fixed thresholds, we also publish an advanced version of the put-call ratio indicator on our website. There, we use a rolling z-score approach to normalize the put-call values, which makes it easier to identify extreme values within the given lookback period.
The z-score measures how many standard deviations the latest observation is below or above the mean value. For example, a z-score of 2 shows that the latest put-call ratio is 2 standard deviations above its mean. Assuming a normal distribution, only 2.3% of all observations should fall into that bucket. Thus, values above 2 or below -2 should considered to be extreme. If the put-call ratio is the same as its mean within the given lookback period, the z-score will show a 0.
Chart 2: Z-Score CBOE Put-Call Indicator (wallstreetcourier.com)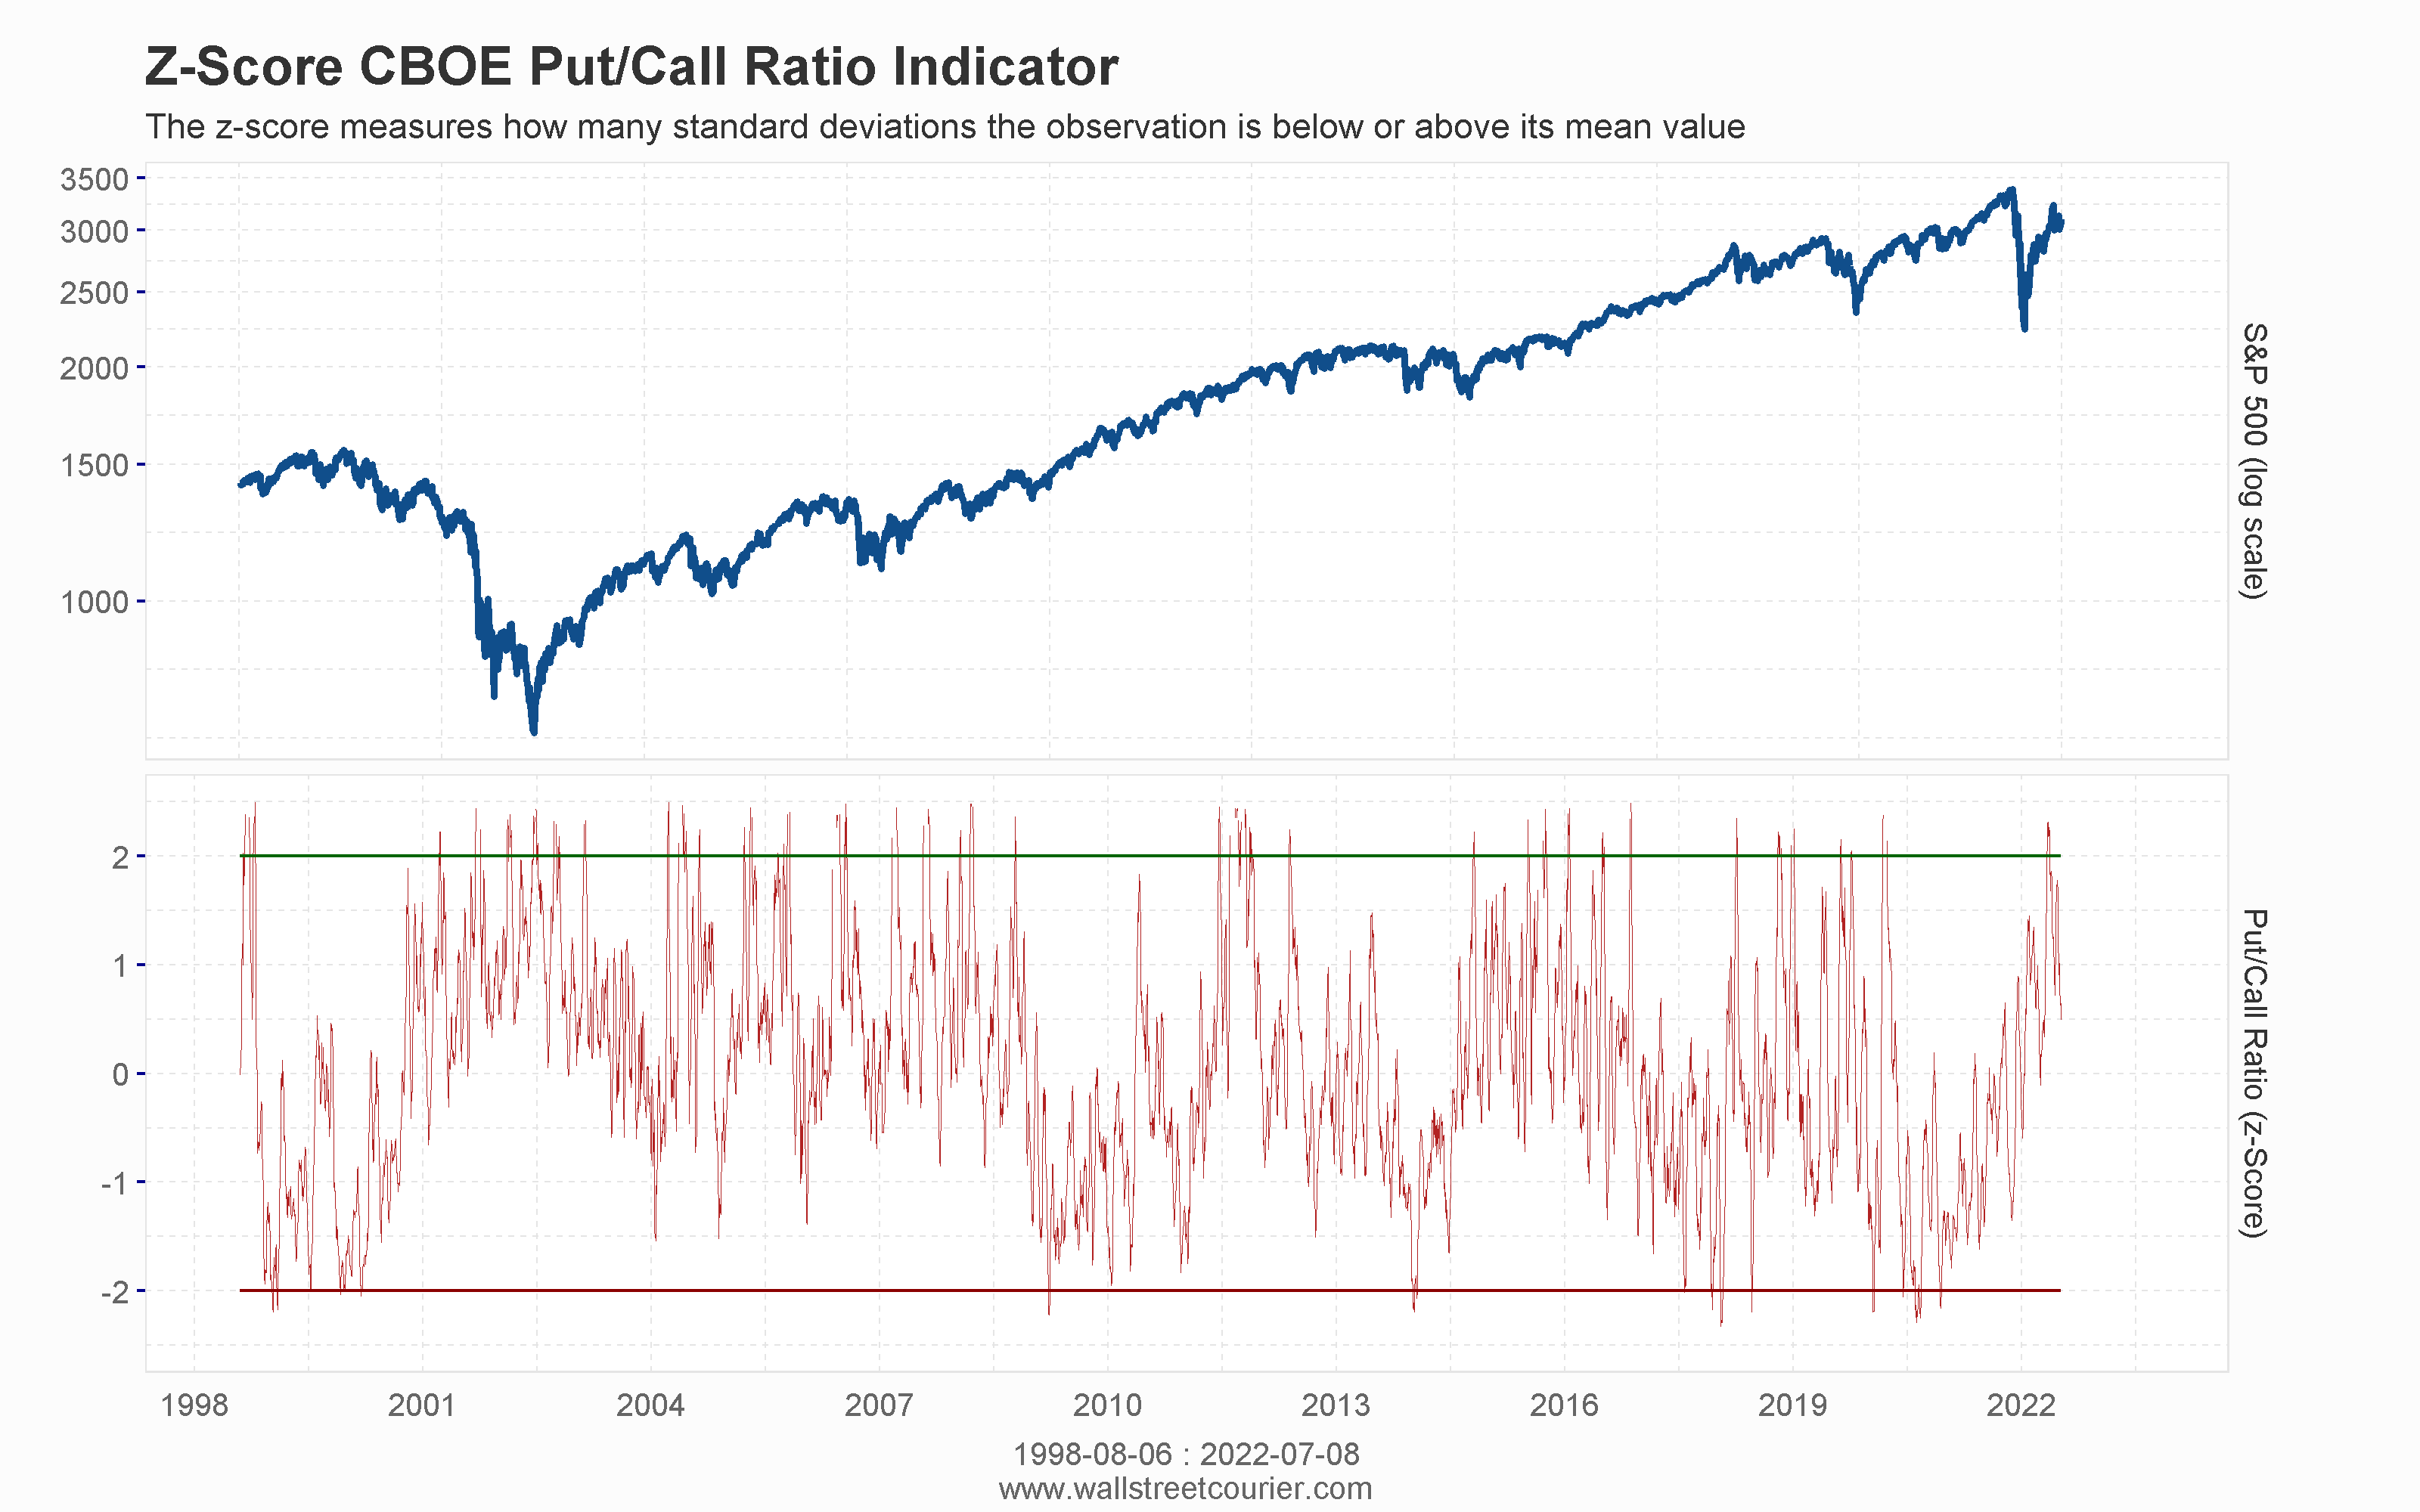
Apart from its standardization mechanism, the main advantage is that such an approach derives flexible entry- and exit points based on stronger shifts within the given lookback period. For example, a stronger increase after an extended period of low put-call ratios will automatically result in a high z-score. This leads to an increased number of signals since they automatically adapt to the prevailing market regime.
Most importantly, this approach also increases the statistical significance as shown in the tables below. There you can see that the average forward-looking return of z-score values equal or greater than 2 (of the put-call ratio) are strongly outperforming the broader market up until 180 days the buy signal was triggered. Between 10 and 90 days, this strong outperformance is highly statistically significant. Thus, the z-score normalization improves the results of the standard put-call ratio based on fixed thresholds considerably.
Table 4: Average forward-looking returns of z-scores (of the put-call ratios) >= 2 (wallstreetcourier.com)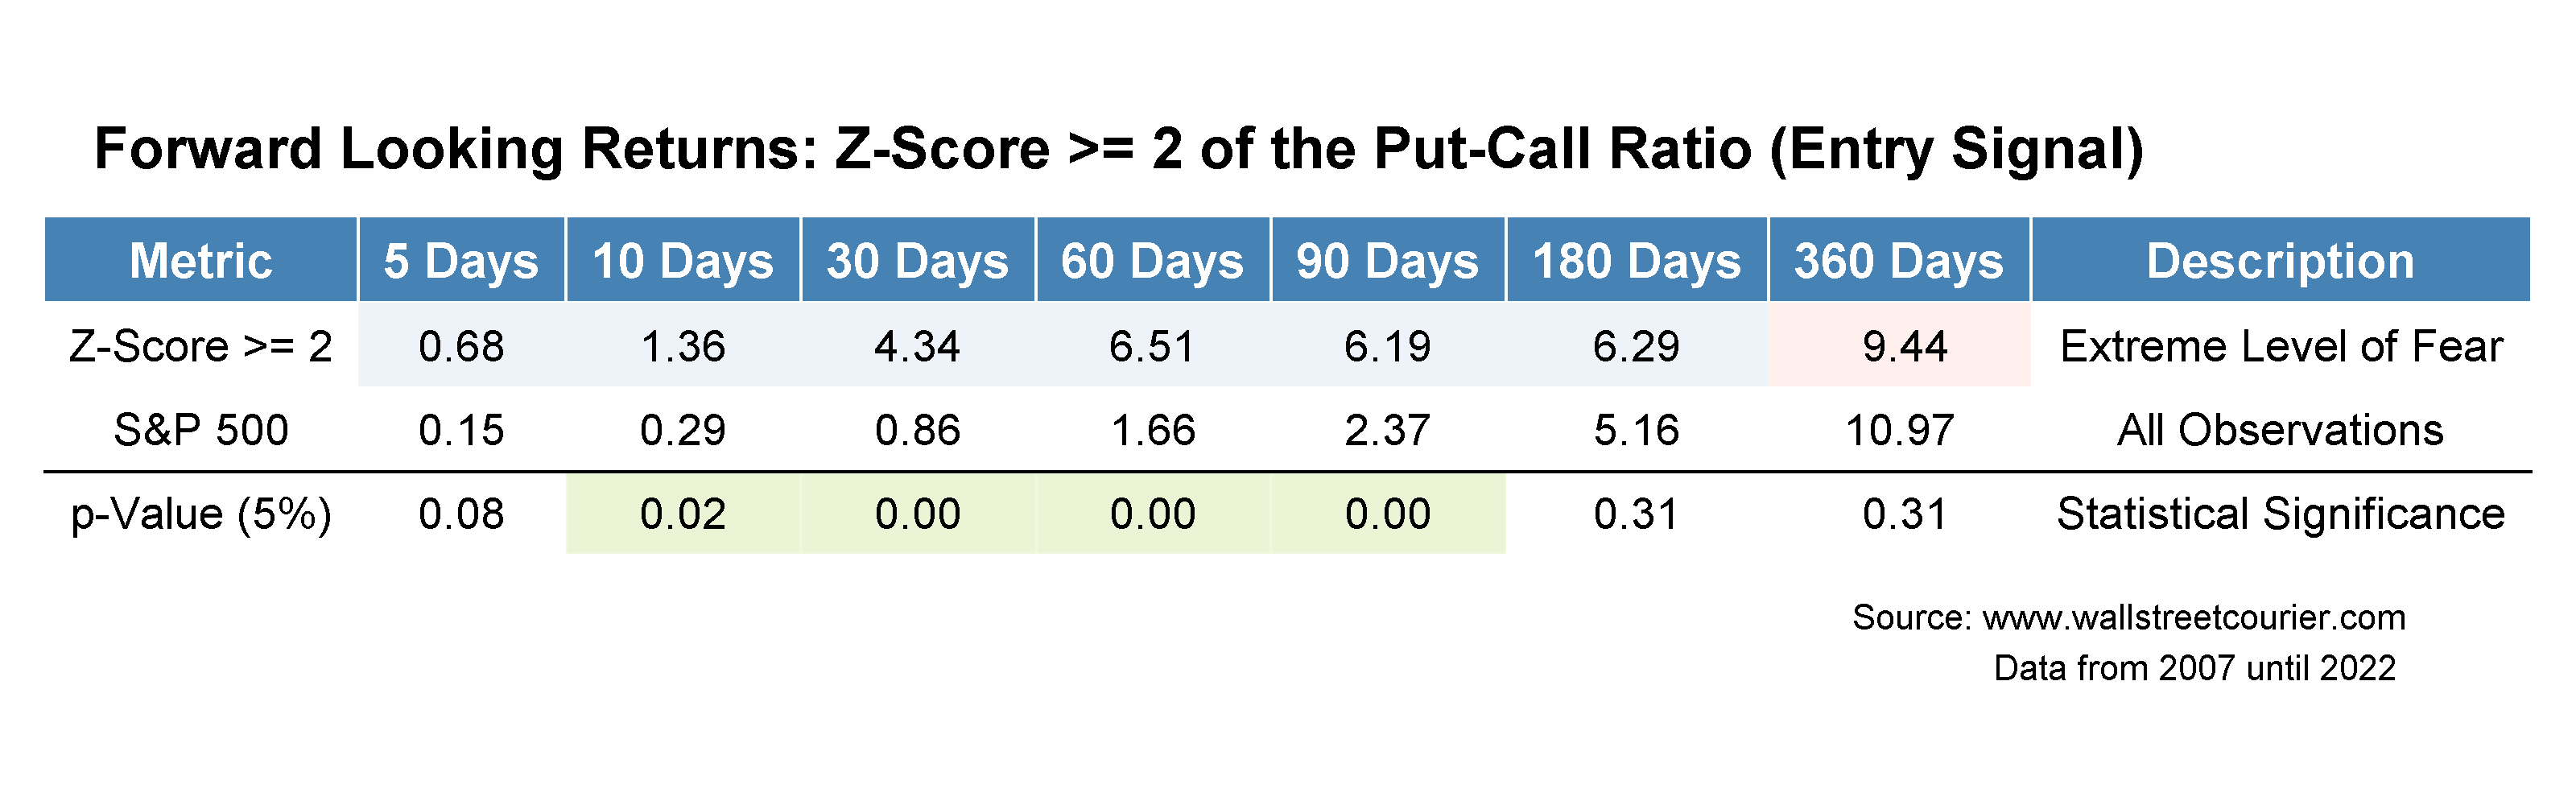
As shown in the able below, the z-score approach also leads to a significant boost in the quality of exit signals. There we can see that z-scores equal or below -2 led to statistically significant below average market returns on a 5, 10 and 60 days basis. This is a quite strong improvement compared to the sell signals generated by the fixed thresholds approach.
Table 5: Average forward-looking returns of z-scores (of the put-call ratios) <= -2 (wallstreetcourier.com)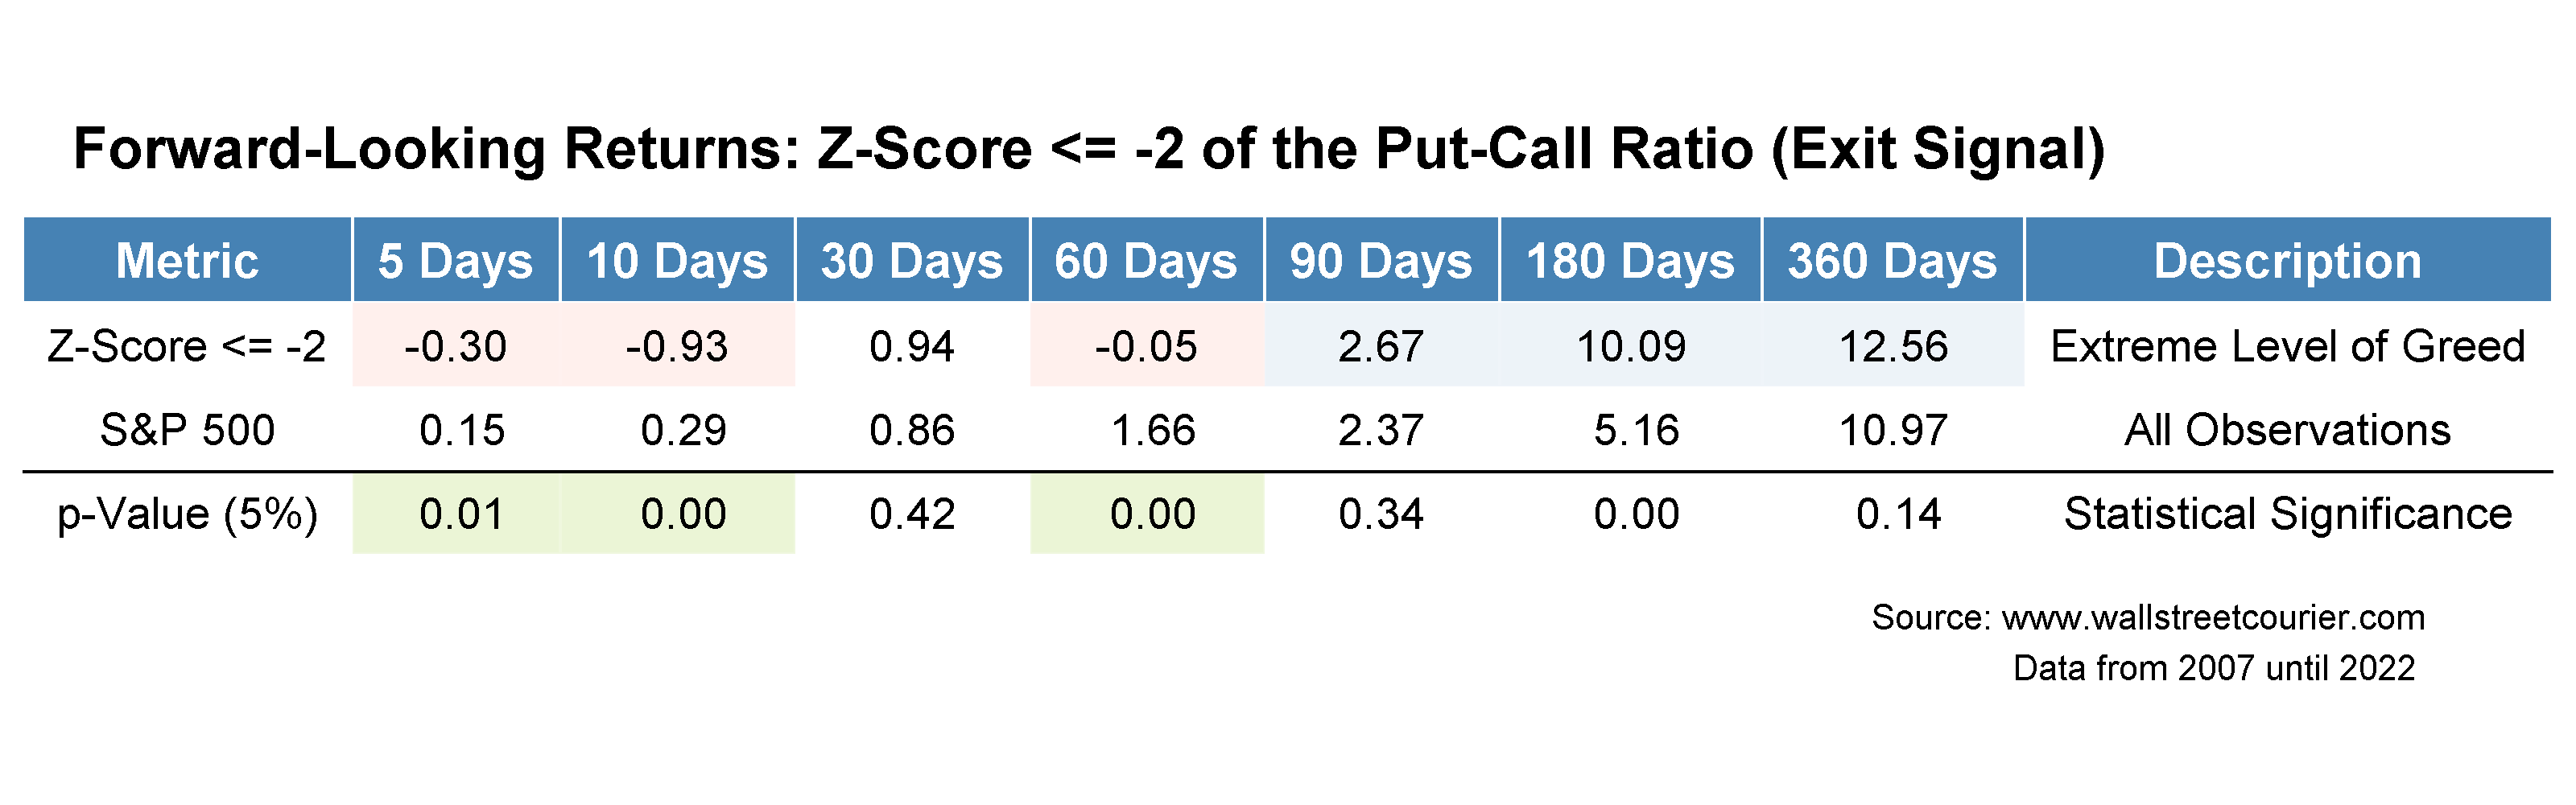
Conclusion:
The put-call ratio is indeed a very useful contrarian indicator to gauge market sentiment and, thus, to identify attractive trade opportunities. Especially, the z-score normalization should be part of the “must daily screen indicators” of active investors. Although the z-score put-call ratio indicator showed statistical significance in identifying attractive entry- and exit points, market sentiment indicators should just be an input parameter and not a major component of a sound investment process.
Be the first to comment