

mizoula/iStock Editorial via Getty Images
Over the past 12 months, MetLife (NYSE:MET) has returned a total of 16.9%, with most of that gain occurring since the start of 2022 (YTD total return is 15.7%). The rally is largely due to rising interest rates and expectations for further increases. MET, and life insurance companies in general, tend to benefit from higher rates. There is a strong positive correlation between changes in Treasury bond yields and MET’s price return.
12-Month price history and basic stats for MET (Seeking Alpha)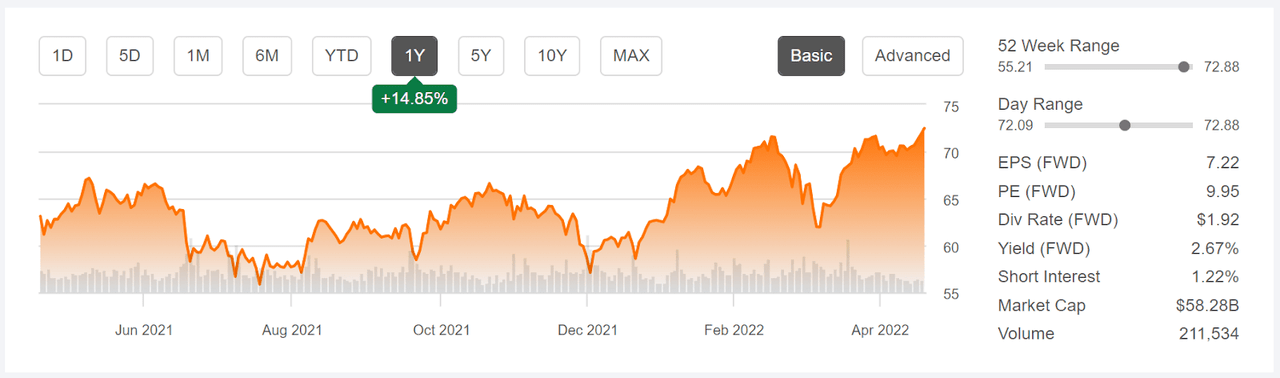
MET should not simply be lumped in with other life insurance companies, however. MET has far outperformed the life insurance industry as a whole for the YTD and over the past 10 years. While several major peers have performed almost as well as MET for the YTD (PRU, AFL, MFC), MET’s 3-year performance is a real standout. MET’s investment management business lines have performed very well, and this area is one of MET’s differentiators.
Trailing and estimated future quarterly EPS for MET. Green (red) values are amounts by which quarterly EPS exceeded (missed) the consensus expected value (E-Trade)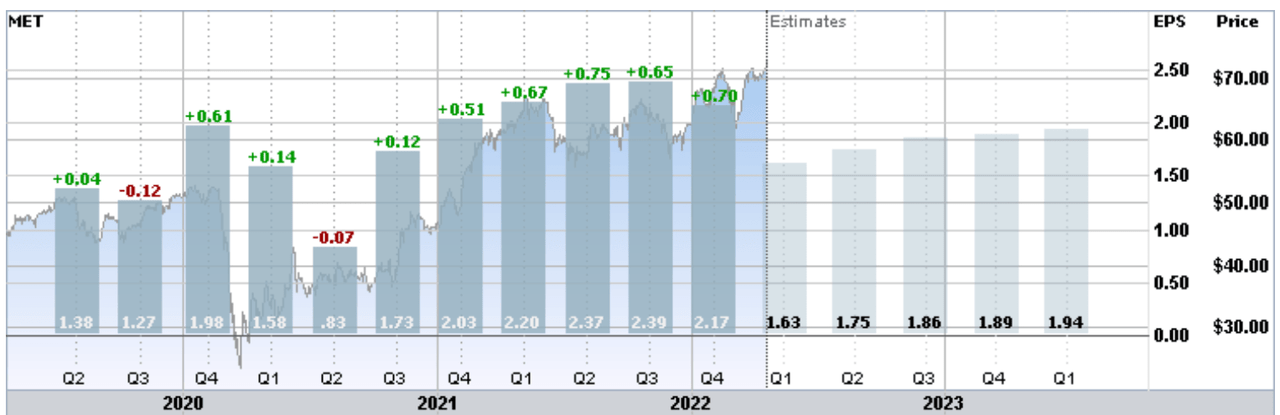
MET has reported 5 successive quarters with EPS beating the consensus expected value by more than 33%. The most recent quarterly EPS, for Q4 of 2021 (reported on February 2nd), exceeded expectations by almost 48%.
MET’s forward dividend yield is 2.67%, and the 3-, 5-, and 10-year dividend growth rates are 4.6%, 6.1%, and 11.3% per year, respectively. The dividend payout ratio is 21%, which is low compared to peers, but the consensus outlook for EPS growth over the next 3 to 5 years is only 4% per year. MET has some room to increase dividends faster than earnings growth because of the low payout ratio, but the expectations for EPS growth are not a good sign for the dividend.
I last wrote about MET on November 25, 2022, at which time I assigned a buy rating and the shares were trading at $62.91. Since that publication, the total return on MET is 21.5% vs. -2.4% for the S&P 500 (SPY). November 25th was a market holiday, so I have calculated these total returns using the (dividend) adjusted closing price as of November 26th as the starting point for the period. Three main considerations led to my buy rating in November. First, MET was gaining with rising interest rates and the outlook was for additional increases in rates. Second, the Wall Street consensus outlook for MET was bullish and the consensus 12-month price target was 17% above the share price at that time. Third, the market-implied outlook, which represents the consensus view from the options market, was bullish to the middle of 2022.
For readers who are unfamiliar with the market-implied outlook, a brief explanation is needed. The price of an option on a stock reflects the market’s consensus estimate of the probability that the stock price will rise above (call option) or fall below (put option) a specific level (the option strike price) between now and when the option expires. By analyzing the prices of put and call options at a range of strike prices, all with the same expiration date, it is possible to calculate a probabilistic stock price forecast that reconciles the options prices. This is the market-implied outlook and represents the consensus view from the options market. For a deeper explanation than is provided here and in the previous link, I recommend this excellent monograph published by the CFA Institute.
I have calculated the market-implied outlook for MET through the end of 2022 and compared to the current Wall Street consensus outlook in revisiting my rating.
Wall Street Consensus Outlook for MET
E-Trade calculates the Wall Street consensus outlook for MET by combining ratings and price targets from 9 ranked analysts who have published their views over the past three months. The consensus rating is bullish and the consensus 12-month price target is 6.7% above the current share price. In my November analysis, the expected return implied by the 12-month price target was 18.25% and the spread in the individual price targets was considerably lower.
Wall Street consensus rating and 12-month price target for MET (E-Trade)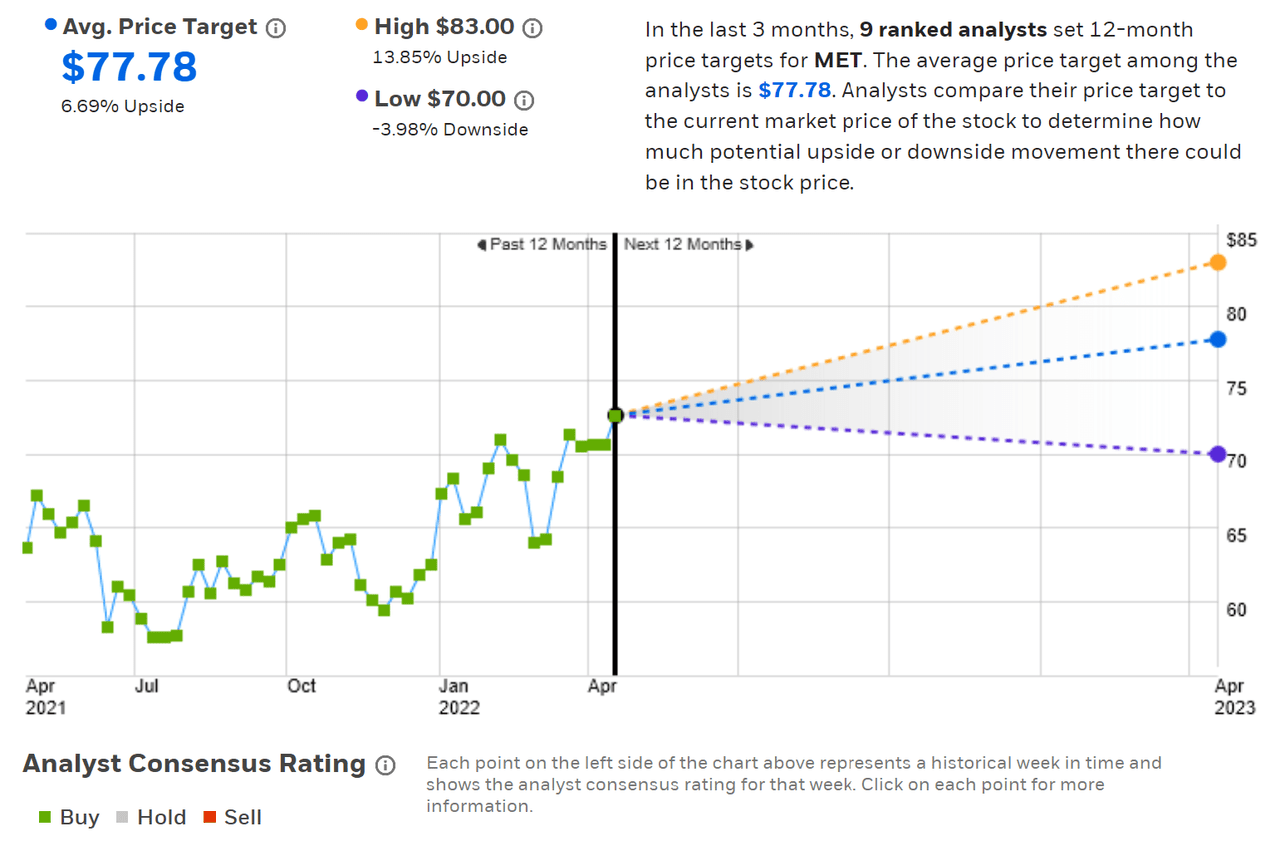
Seeking Alpha’s version of the Wall Street consensus outlook is based on the views of 16 analysts who have published ratings and price targets over the past 90 days. The consensus rating is bullish and the consensus 12-month price target is 4.2% above the current share price.
Wall Street consensus rating and 12-month price target for MET (Seeking Alpha)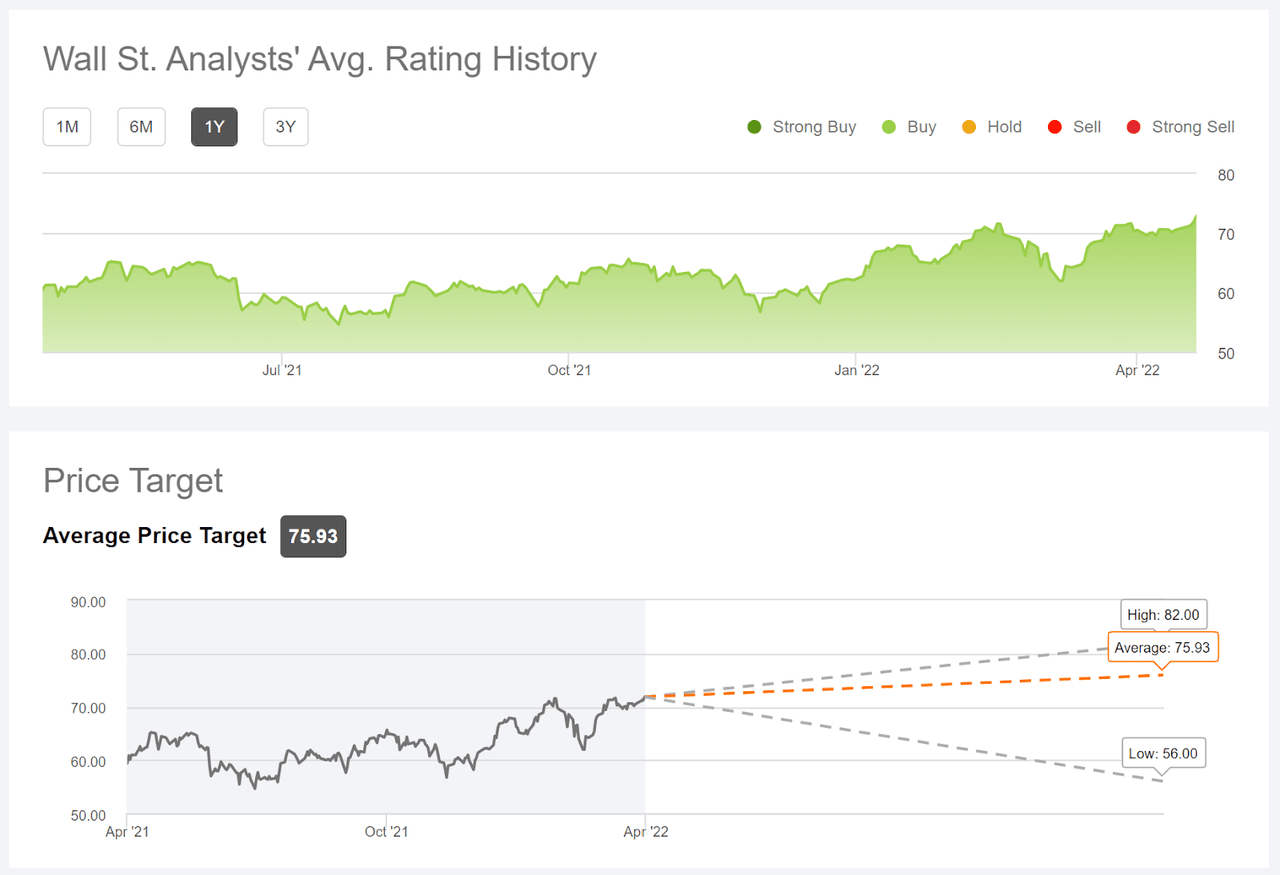
Even though the consensus rating on MET is bullish, the recent gains in the share price leave little expected upside relative to the 12-month price target. Averaging the two consensus price targets and adding the dividend, the expected total return over the next 12 months is 8.1%.
Market-Implied Outlook for MET
I have calculated the market-implied outlook for the 1.9-month period from now until June 17, 2022 and for the 9-month period from now until January 20, 2023, using the prices of options that expire on each of these dates. I selected these two periods to provide a view to the middle of the year and through the end of 2022, as well as because the options expiring in June and January tend to be more actively traded than most other months.
The standard presentation of the market-implied outlook is in a probability distribution of price return, with probability on the vertical axis and return on the horizontal.
Market-implied price return probabilities for MET for the 1.9-month period from now until June 17, 2022 (Author’s calculations using options quotes from E-Trade)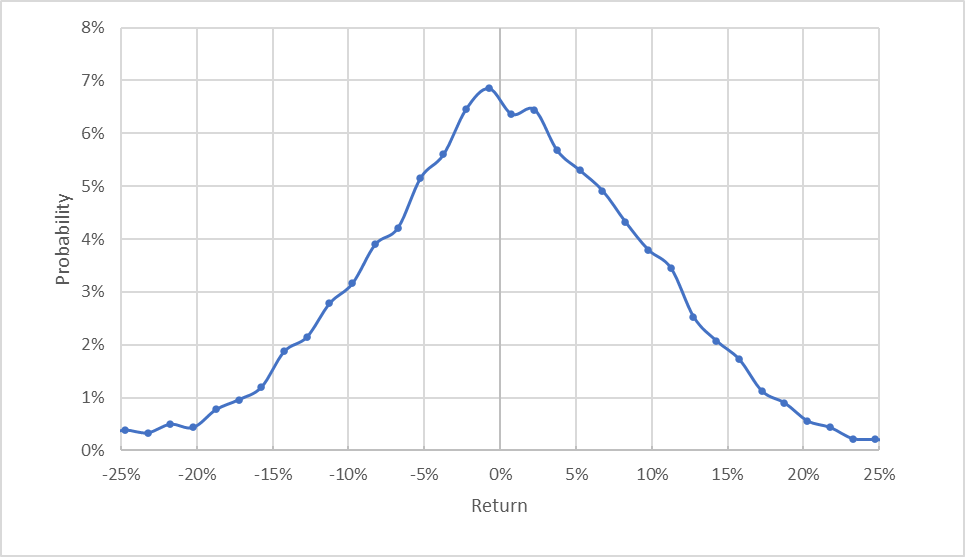
The outlook for the next 1.9 months is generally symmetric, with comparable probabilities of positive and negative returns of the same magnitude. The expected volatility calculated from this distribution is 28% (annualized), very close the expected volatility calculated for my November post.
To make it easier to directly compare the probabilities of positive and negative returns, I rotate the negative return side of the distribution about the vertical axis (see chart below).
Market-implied price return probabilities for MET for the 1.9-month period from now until June 17, 2022. The negative return side of the distribution has been rotated about the vertical axis (Source: Author’s calculations using options quotes from E-Trade)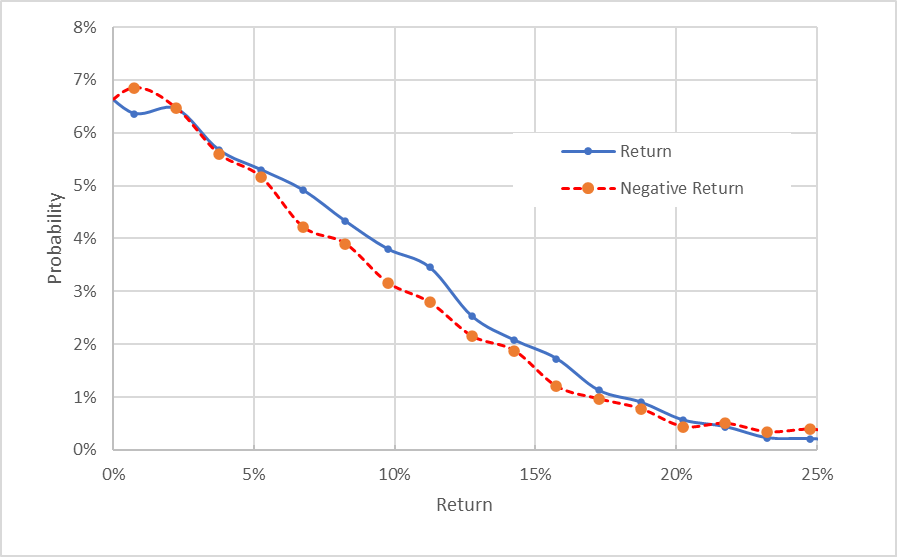
The probabilities of positive returns are higher than those of negative returns of the same magnitude across most of the distribution (the solid blue line is predominantly above the dashed red line). The market-implied outlook is slightly tilted to favor positive returns (a slightly bullish view). In my November 25th analysis, there was a (roughly) 2-month outlook to January 21, 2022, which serves as a basis for comparison. That outlook exhibited a significantly stronger bullish tilt than in the current results.
Theory suggests that market-implied outlook is expected to have a negative bias because risk-averse investors tend to overpay for downside protection (put options). While there is no way to determine whether this tilt is present, the potential for a negative bias reinforces the slightly bullish interpretation.
The market-implied outlook for the 9-month period to January 20, 2023 has less of a positive tilt. Given the expected negative bias, however, this outlook is interpreted as slightly bullish. The expected volatility calculated from this outlook is 30% (annualized). E-Trade calculates 27% implied volatility for the January 20, 2023 options.
Market-implied price return probabilities for MET for the 9-month period from now until January 20, 2023. The negative return side of the distribution has been rotated about the vertical axis (Author’s calculations using options quotes from E-Trade)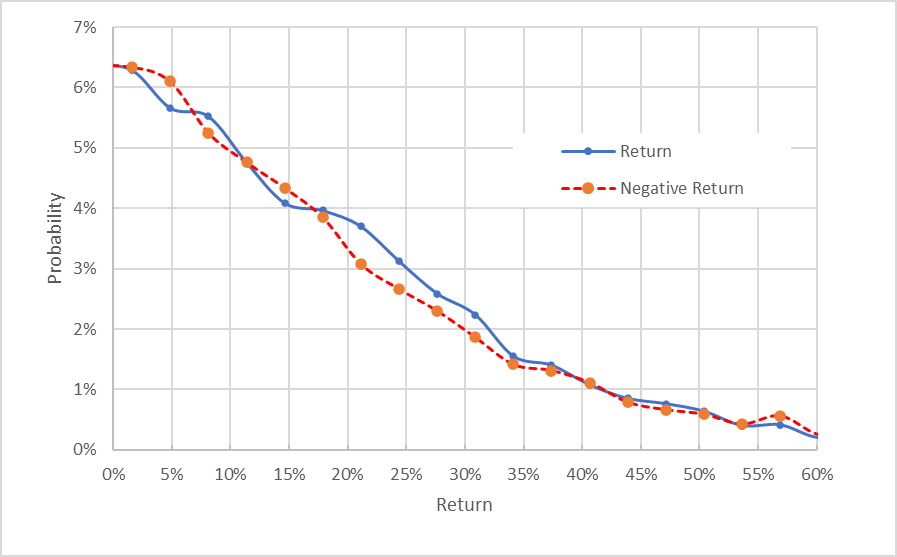
The market-implied outlook through the rest of 2022 and into January of 2023 continues to be slightly bullish, albeit less than in my analysis on November 25th.
As I have been writing this piece, I executed a covered call position on MET. I bought MET for $72.94 per share and sold January 20, 2023 calls with a strike of $72.50 for $7.02. Between now and when the options expire, 3 dividend payments are expected, for a total of $1.44. The expected total income (dividends + options premium) between now and when the options expire is $8.02 (having subtracted out the $0.44 in options premium that is below the current share price). This income equates to a total yield of 11% ($8.02/$72.94) over a period of 9 months.
Summary
Current market conditions are good for insurance companies. The iShares U.S. Insurance ETF (IAK) has returned a total of 9.6% for the YTD and 20% over the past 12 months, for example. Rising rates have been a substantial tailwind for MET, but the company has also delivered substantial earnings beats in recent quarters, suggesting that the market expectations have been too conservative. Looking ahead, the rising rate environment is likely to persist as the Fed tries to get inflation under control. The Wall Street consensus outlook for MET continues to be bullish, but the consensus 12-month price target implies a total return of only 8.1% over the next 12 months, well below historical annual returns. As a rule of thumb for a buy rating, I want to see an expected 12-month total return that is at least ½ the expected volatility (28%-30% from the market-implied outlook). MET is well below this threshold. That said, the Wall Street consensus outlook on earnings has been far below actual earnings in recent quarters, so the analysts have tended to be too conservative. The market-implied outlook for MET to early 2023 is slightly bullish, albeit less than in my November analysis. This is probably because the price gains in recent months have reduced the potential for additional upside. While I am less bullish than in November, I am maintaining my bullish / buy rating on MET. My cautious outlook on the shares is reflected in my decision to sell at-the-money calls, as described in the previous section.
Be the first to comment