

Darren415
This article was first released to Systematic Income subscribers and free trials on Sep. 29.
The sharp rise in short-term rates this year has pushed up yields on many income assets, including cash. In this article, we take a look at the value of having a cash management portfolio strategy and highlight why cash assets look fairly attractive in this environment, either as strategic or tactical assets.
We also highlight two types of cash alternative assets – securities that carry a very modest amount of credit and duration risk but offer yields above what investors would most likely earn in their brokerage account by default. Specifically, we focus on ultra short-term bond fund ETFs as well as AAA CLO ETFs.
Why Cash Alternatives Are Worth A Look Now
There are a number of reasons why cash alternatives are worth a look today. We define cash alternatives as high-quality tradeable securities with minimal (but non-zero) credit and duration risk. These securities are distinct from government money-market funds which try to maintain a stable $1 NAV both in their NAV mandate as well as their allocation strategies.
First, cash alternatives can be much more attractive options than outright cash. This is because brokers don’t pass on the riskless interest rate that is available in markets on idle cash in brokerage accounts. By riskless rate we mean the typical benchmarks like SOFR, Libor or short-term Treasury Bills all of which are around 3-3.5% as of this writing (and moving higher).
For example, Schwab pays 0.25% on uninvested cash in the brokerage account while Interactive Brokers does a bit better with 1.58-2.58% depending on the account (i.e., Fed Funds less 0.5% or 1.5%).
The key point here is that the opportunity cost for idle brokerage cash is very high today as high-quality liquid assets can be had at 4-5% yields – well above what brokerages typically offer.
Second, cash can be used as a strategic or tactical allocation in income portfolios. As a strategic allocation, it can be used to dampen the volatility portfolio returns, generate a growing level of income and de-risk portfolios.
As a tactical allocation, it can be used by investors to park cash as they rotate between various investments that look more or less compelling. It can also be used to manage a countercyclical allocation style – one that lightens up on risk when valuations are expensive (as they were in 2021) and puts cash to work when valuations are more compelling (as they are now).
Three, higher-quality allocations are now relatively compelling in the context of credit spreads that remain fairly tight. At around 5%, high-yield corporate bond credit spreads are close to 1% below their June peaks and well below what we would expect in a typical recession. For instance, even in 2016 (which was not a recession and only saw the Energy/Resource sector wobble) credit spreads reached close to 9%.
Four, an inverted yield curve means that shorter-maturity assets now, unusually, offer higher yields than longer-duration assets. For example, the 1Y Treasury yield trades around 0.25% above the 10Y yield.
Five, while yields on cash alternatives are clearly below those on higher-octane credit assets such as high-yield corporate bonds and bank loans, loss-adjusted yield differentials are not as high.
For example, while we can expect minimal, if any, losses on cash alternative assets, we can expect potentially high losses on high-yield corporate bonds. Deutsche Bank estimates losses may peak around 10% over the next few years.
DB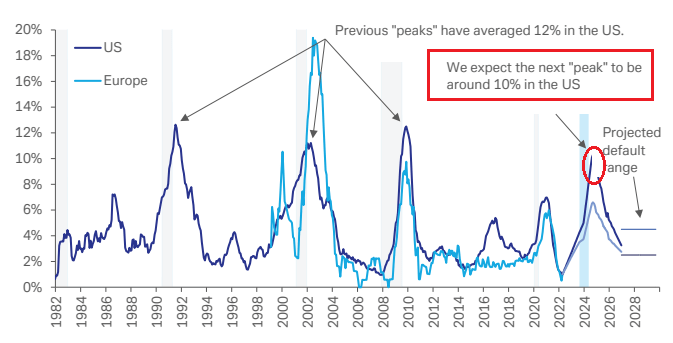
KBBA analytics forecasts a more benign figure of around 4%. These forecasts translate to a loss rate of around 2.5% – 6% at the peak. This suggests that on a loss-adjusted basis cash alternatives may be fairly competitive with high-yield corporate bonds at their peak default rate.
KBRA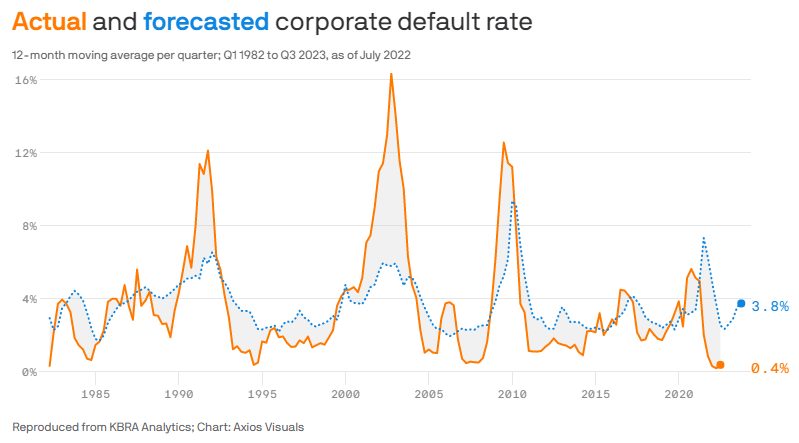
Sixth, for many income investors, outright cash might just be too high-quality. From a historical default risk perspective moving slightly lower in quality may not increase risk all that much. Clearly, any traded security, unlike cash, can have liquidity air pockets but low-risk assets tend to mean revert fairly quickly as was the case in 2020.
Finally, it may surprise some investors but cash is one of the few negative duration assets, i.e., assets that deliver positive returns when interest rates are moving higher. For the nerds in the room, the other ones include inverse floaters, IO MBS securities, Mortgage Servicing Rights securities and others – none of these are readily available to retail investors. The reason is simple – the higher short-term rates go, the higher the return cash (and cash alternatives) generates as it passes on the higher yield available in the market to investors, increasing returns.
For all of these reasons, cash, though boring from the looks of it, can have a role to play in income portfolios.
Ultra Short Bond ETFs
In these sections, we highlight two types of cash alternative assets: ultra short-term active fixed-income ETFs and AAA CLO ETFs.
There are quite a few ultra short corporate bond funds. On the shorter-duration side is the actively-managed JPMorgan Ultra-Short Income ETF (JPST) which has a duration of just 0.29 years. It also has a spread duration of 0.67 with an average life of 0.56. The fund has an investment-grade portfolio with about a quarter in AAA securities. JPST has a yield-to-worst of 3.94% and a fee of 0.18%. JPST is flat year-to-date in performance terms. Within the ultra-short sector, JPST is one of the best performers over the last 3 years with a +1% CAGR.
Another pretty strong performer is the actively-managed iShares Ultra Short-Term Bond ETF (ICSH) which features a very low 0.08% fee. The fund’s credit profile sweet spot is A-rated bonds with about a quarter in AA and another quarter in BBB bonds. The weighted-average maturity is 0.64. The fund features a 3.95% yield-to-worst. The fund is -0.1% year-to-date and has a 0.7% CAGR 3Y total NAV return.
Moving slightly out the maturity spectrum, the BTC BlackRock Short Maturity Bond ETF (NEAR) has a 0.25% fee. Its credit quality is split evenly in thirds in AAA, A and BBB-rated securities. Its weighted-average maturity is 1.2 and its duration is 0.44. The yield-to-maturity is 4.54%. The fund’s 3Y total NAV return is 0.6% which is a bit above the active ETF sector average of 0.5%.
On the more aggressive side of the ultrashort sector is the PIMCO Enhanced Short Maturity Active Exchange-Traded Fund (MINT). The fund has an effective maturity of 0.49 and duration of 0.44. Its yield-to-maturity is 4.97%. The fund’s fee is on the high side at 0.35%. The fund allocates to securitized assets (ABS and non-agency MBS) in addition to the usual investment-grade bonds. About 35% of the portfolio is unrated which doesn’t necessarily imply low quality. The fund’s more aggressive stance means its year-to-date performance is worse than the funds mentioned above at -1.7%. This has also caused a drag on its 3Y total NAV return which stands at 0.2%.
While all of the funds above make sense we would like JPST for investors looking for a very conservative cash alternative allocation and to NEAR for one with a slightly higher risk profile.
AAA CLO ETFs
The other types of high-quality, low-duration assets worth mentioning here are AAA CLO ETFs.
One way to think about AAA CLOs vs. investment-grade bond ETFs is that the former get paid for taking systemic risk while the latter get paid for taking an idiosyncratic risk.
In other words, a AAA CLO will not be impacted by a few individual defaults in the CLO portfolio. This is because of the huge buffer that AAA CLOs have before they have to take losses – an illustrative schematic is shown below. In other words, a typical ultrashort investment-grade ETF can hold something on the order of 300-600 bonds, and even though it’s extremely unlikely to suffer a serious loss on any one position, it cannot be ruled out. However, suffering a loss on a AAA-rated CLO would be a historic event and would imply the kind of credit crisis that we have not seen this century, if not much longer.
MS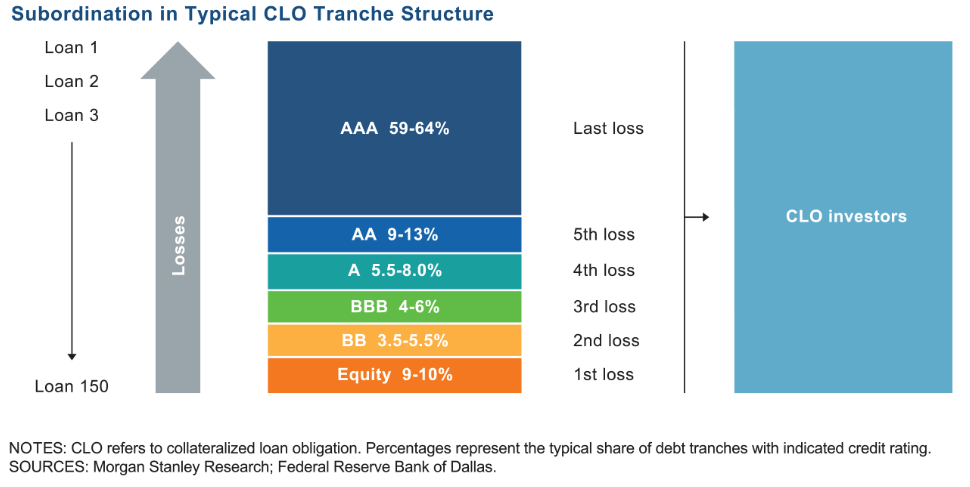
Fitch estimates that the break-even default rate for AAA CLOs was north of 20%. This compares favorably with the historical loan default rate. Also, keep in mind that CLO portfolios are higher quality than the broader loan market due to the limit on CCC-rated loans in the portfolio.
S&P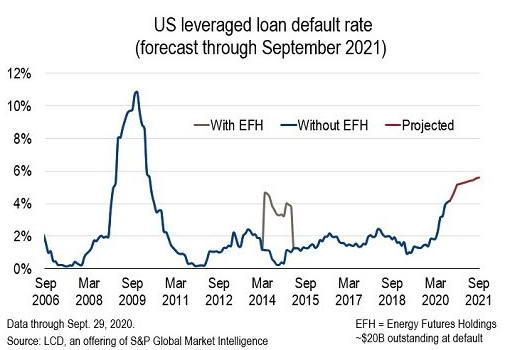
It’s also important to keep in mind that according to S&P no CLO tranche originally rated AAA or AA ever defaulted (“ever” being the period from 1996).
Getting a sense of AAA CLO yields is tricky as the funds don’t disclose their portfolio yields-to-maturity. What we can do instead is to rely on two sources (TCW and Palmer Square) that provide AAA CLO spreads over Libor which are around 1.6-1.75% over Libor as of August. With 3-month Libor around 3.6%, this equates to around 5.3% before fees as of this writing. This should continue to move higher over time as Libor continues to rise.
The other attraction of AAA CLO ETFs over their ultra short bond ETF alternatives is that all of the CLO ETF holdings are floating-rate which means they reset quicker to higher rates – every 3 months – whereas a 1-year bond that an ultrashort bond ETF holds would take a year to reset to a higher coupon.
One disadvantage of the CLO ETF is that the maturity of the holdings is significantly longer than those of ultra short ETFs (which don’t tend to go much over 1 year). AAA tranches can be on the order of 2-5 years to maturity which means their spread duration can be significant.
There are not many AAA CLO ETFs. In fact, there are just two (soon to be three). The one to focus on in our view is the Janus Henderson AAA CLO ETF (JAAA). The fund has $1.56bn in assets and a 0.26% fee. It is down 1% year-to-date.
Takeaways
As highlighted above, cash alternatives offer a number of benefits in the current environment both for investors who view cash as a strategic allocation as well as those who treat it as a tactical tool.
When evaluating cash alternative assets, investors should pay attention to the following key metrics: yield-to-maturity/yield-to-worst, credit risk, interest rate duration, credit duration (also called spread duration), liquidity and performance (both year-to-date and longer-term).
Investors have to be careful in evaluating the yield of a particular fund. Specifically, there are, at least, three different yield metrics: current yield, SEC yield and yield-to-maturity/yield-to-worst. The most useful metric is the last one as it more closely captures what investors actually earn on their holdings before fund fees. The other metrics are somewhat artificial and can be all over the place.
For instance, the screenshot below from MINT shows the three different yields. The first two yields ignore pull-to-par and so do not do a good job of showing what investors are expected to earn through the maturity of the portfolio. That said, the yield-to-maturity/yield-to-worst typically does not include the management fee.
PIMCO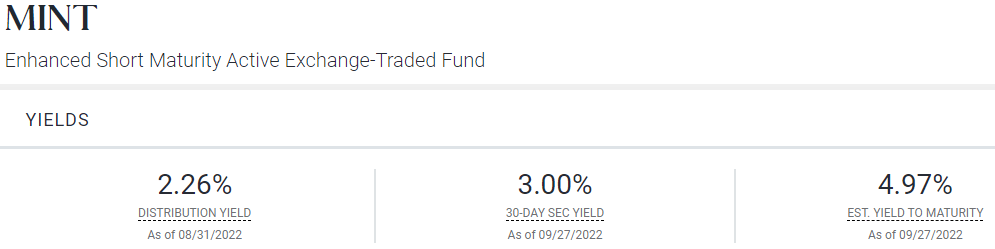
Investors should also use the duration metric with caution as it is not always representative of the risk in the portfolio. For example, a fund can have a very low level of duration (due to a preponderance of floating-rate securities) but can carry a significant amount of credit risk and be very sensitive to risk-off market periods. For this reason, investors should check the weighted-average maturity or spread duration of the given fund.
Overall, cash management plays an important role in investor portfolios and it, along with other portfolio allocation strategies, can improve absolute and risk-adjusted returns over time if used well.
Be the first to comment