

Former Chief of Staff Rahm Emanuel is perhaps more famous for this one liner than anything else:
“You never want a serious crisis to go to waste.”
That quote has been used as ammunition by politicians on both sides of the aisle ever since it was uttered during the stormy seas of the Great Recession.
There is an undeniable grain of truth to his message that applies directly to investing: humans are emotional beings and tend to react with passion (good or bad) instead of rationale. The greater the implications (e.g. Tesla (TSLA) restructuring the automotive sector) the stronger the conviction.
Global media’s appetite for sensational stories reminds of a Greek myth about Erysichthon, King of Thessaly.
Erysichthon grabbed an axe and cut it down himself, killing a dryad nymph in the process. The nymph’s dying words were a curse on Erysichthon… Eventually, Erysichthon ate himself in hunger. Nothing of him remained the following morning.
Headlines concerning the coronavirus have stirred controversy. Others paint a picture of pure cataclysm spreading around the world one infected person at a time.
Williams Equity Research (“WER”) does not consider ourselves infectious disease experts, and as curious as we are, it is not a domain we wish to explore intimately. We are well acquainted with irrational group think, however, and its impact on financial markets. Humble recognition of this fact is why we constructed the Institutional Income Plus portfolio with a concrete and detailed framework around individual security and sector diversification requirements.
Observing sensational headlines and the ensuing panic always piques our interest. The coronavirus is an excellent example of this and investor comments on this subject tend to follow this model:
Already manipulated Chinese GDP is going straight into the gutter and with it global GDP. Any company reliant on Asian tourism is doomed. The real impact of this crisis will take many more quarters or even years to accurately measure.
In our experience working at multiple hedge funds and large financial services companies throughout several crises, particularly the Great Recession, the timeline associated with this line of thinking never changes. That’s not an appeal to authority but context on our perspective.
Six months from now, the same indefinite period before it’s “safe” to invest will still apply. The identical situation applied to those overweight cash for years after the market started its steep ascend from from the Great Recession. Many of those who are afraid of the coronavirus’s implications will maintain that thinking long after the data suggests otherwise and the unwarranted stock losses quickly reverse. It’s just human nature.
There are many tools to mitigate this natural flaw but we prefer using probability analysis. We gather the relevant data then run scenarios on the actual impact to variables we consider most critical, all of which is grounded in fundamental analysis of the company and sector. Sometimes the group think is dead on and the incredible fear or joy is not misplaced. Often, however, it’s gone too far one way or the other. We’ll see which way the scale tilts as we work through Carnival’s business, financial condition, and prospects.
Carnival Corporation (CCL)

Source: Google
This is a live screen shot of googling “cruise ships coronavirus” taken at lunch on Friday, February 21st. This doesn’t exactly make me want to book a cruise. This random sliver of news demonstrates investor sentiment to a “T.”
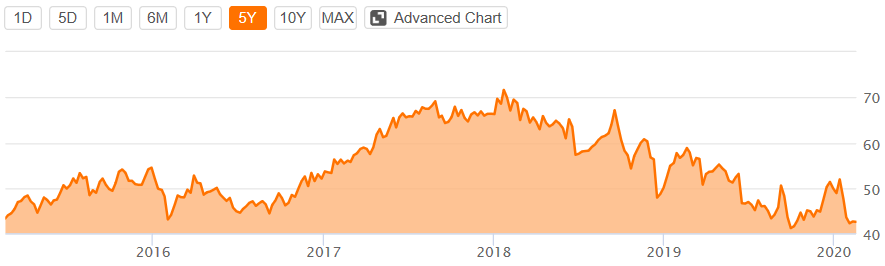
Source: Seeking Alpha
It’s also contributed to CCL stock falling from 2018 highs above $70 per share to five year lows near $40.0 (the stock trades at $41.88 as this is written). For context, CCL traded in the $30 to $50 per share range starting in late 2009 through mid-2015 so current levels are not extremely depressed unless Carnival Corporation has posted immense and sustainable earnings growth over the time period.
Given our focus on income investing, there is an important attribute not shown on the previous chart.
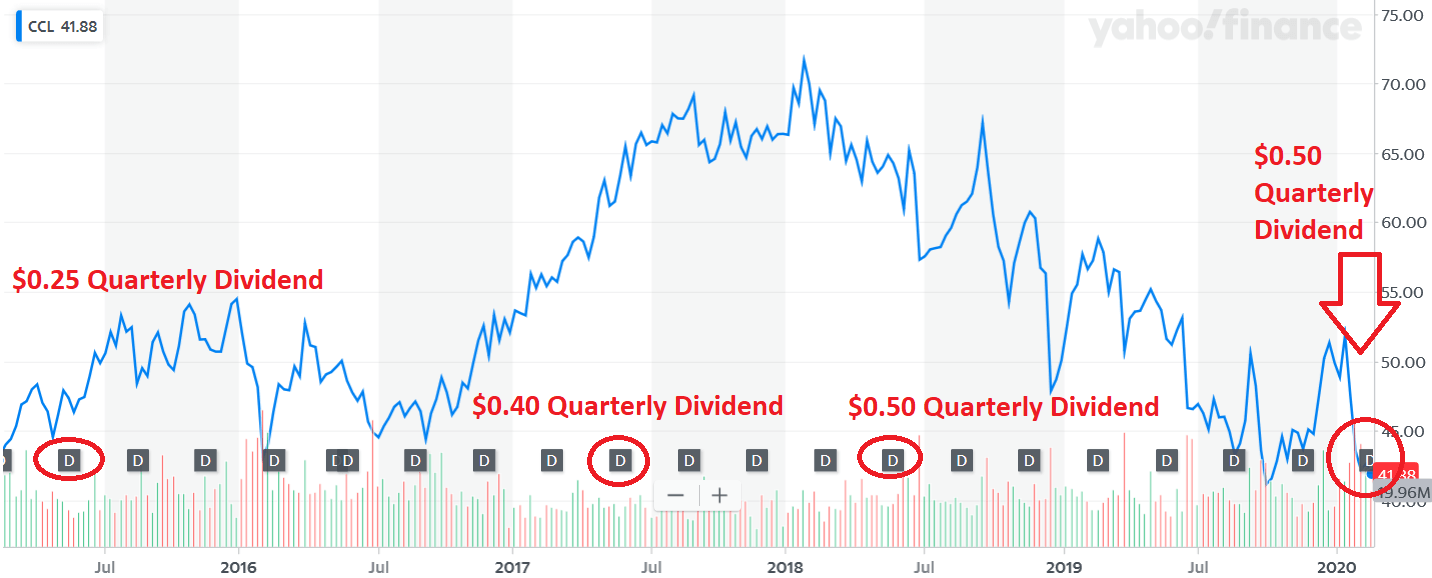
Source: Yahoo! Finance & WER
In the last five years, Carnival has doubled its annual distribution. It now yields just over 4.6% or over two and half times the S&P 500. How has that compared to historical levels for Carnival’s distribution yield?

Source: Macrotrends.com & WER
Quite favorably. Before we get into the mechanics of how Carnival pays its growing dividends and if the firm’s cash flows have grown alongside the distribution, let’s get a better grasp on its business.
Carnival’s Structure & Business
Carnival trades on the New York Stock Exchange and London Stock Exchange under Carnival Corporation and Carnival plc, respectively. Interestingly, Carnival is the only company in the world to be included in both the S&P 500 index in the US and the FTSE 100 index in the UK. Depending on how it’s defined, Carnival is the largest leisure company in the world with over 100 ships stopping at more than 700 ports. 19 more ships are on the way between the end of 2019 and 2022. The fleet serves approximately 50% of all cruise guests annually. Carnival’s portfolio of brands extends well beyond the line that carries the firm’s name. Knowing the appeal, success, overlap, and scale of each brand is necessary to understand Carnival Corporation as a whole.
Carnival

Founded in 1972, Carnival Cruise Line is one of the most recognizable brands in the cruise industry and carried over 5.4 million guests in 2018, the most of any individual cruise brand.
The Carnival line is considerably larger than any other portfolio brand with 27 ships. Carnival is most familiar to U.S. citizens because effectively all its ships debark from that country. It’s the most popular cruise brand on the continent and aims to provide a balance of value and luxury. Shaquille O’Neal, Carnival’s Chief Fun Officer, created the “Big Chicken” restaurant concept (this is not a joke) for the ship and is a testament to the lengths Carnival is willing to go to test new ideas. They are also constructing BOLT, the first roller coaster at sea and reaches nearly 40 miles per hour. Carnival also boasts the first cruise ship in North America to be powered by LNG. Demographic trends, a strong U.S. economy, and smart decisions by management have enabled this division to perform very consistently for a semi-luxury cruise liner.
Princess Cruises

Princess Cruises began operations in 1965. Currently operating a fleet of 19 ships visiting more than 350 ports around the globe, it is the world’s largest premium cruise line.
The Princess line is the third largest globally based on passenger capacity with 19 ships operating from more than 350 international ports. It’s also the largest “premium” cruise line and offers trips as long as 111 days. This line even has its own private island, the Princess Cays, in The Bahamas. While all cruise ships pay close attention to dining and entertainment, the line excels at it with a long list of awards going back over 10 years as confirmation.
Holland America Line

For 145 years, Holland America Line has been carefully crafting your clients’ next journey. Our fleet of 14 spacious, mid-sized ships offer a classic style of cruising to more than 425 ports of call in 100+ countries on all seven continents.
This division has been sailing to Alaska for over 70 years but also goes south to Mexico, Panama, (it’s consistently ranked #1 in those two nations) and nearly 100 other countries. Another leader in the premium segment, Holland America boasts 14 ships.
Seabourn

Seabourn, which began operations in 1988, provides the world’s finest ultra-luxury travel experience on smaller ships that focus on highly personalized service and guest recognition.
Seabourn hits the niche of luxury without the gigantic ships now common in the industry. Its ships are among the newest in the segment and help fill the “ultra-luxury” slot for Carnival. Carnival’s largest ships now boast capacity for 6,600 guests which is over 10 times that of Seabourn’s largest vessel.
Cunard

The line Cunard is globally recognized as operating the most famous ocean liners in the world — offering legendary travel experiences with outstanding service. The brand currently sails three ships: Queen Mary 2, Queen Victoria and Queen Elizabeth, with a fourth vessel set to debut in 2022.
Cunard operates three “mega-luxury” cruise liners with another under construction. We found that it received accolades from many publications and groups that appear to carry weight in the industry.
AIDA

With its casual and premium-quality cruise concept, AIDA Cruises established a new chapter in the history of cruising in 1996. Today, AIDA Cruises is the market leader in the German-speaking cruise market.
AIDA focuses on families with children and forgoes some of the luxuries found on other Carnival lines. It’s a good diversification from the baby boomer generation which we think is an intelligent move. AIDA is one of the fastest growing and profitable tourism businesses in Germany and employs approximately 9,000 people.
Costa

Costa has been providing cruises since 1948 and today visits more than 260 ports around the world. In 2016, its ships carried over 2 million guests.
Costa is the largest cruise liner in Europe. If travelers want Italian, that’s exactly what they are going to get with Costa: Italian food and style. Based on our research of independent reviews, Costa excels on average in terms of the quality and beauty of their ships, impressive bars and drinks, and port stops. Reviews were more mixed on the dining and entertainment experience as well as features/design of some of the newest ships.
P&O Cruises (“UK”)

P&O Cruises is the leading and most recognized cruise brand in the UK, operating a fleet of six premium ships. Its newest ship, Iona – a 180,000-ton vessel powered by liquefied natural gas (“LNG”), the world’s cleanest burning fossil fuel – will join the fleet in 2020.
Based out of the UK, P&O has navigated BREXIT and allows customers flexibility in paying in Euros and Pounds. P&O is the leading cruise company for the UK market but is relatively small compared to the North American and European business lines.
P&O Cruises (Australia)

P&O Cruises (Australia), which began cruising from Australia in 1932, is the leading cruise operator in the Australia and South Pacific region.
P&O Australia focuses on the – you guessed it – Australia and New Zealand geographies. This business line incorporates Southeast Asia with short to medium-length trips of 7 to 18 days. With only four, this division’s scale by number of ships is smaller than all others except Cunard’s three vessels.
Carnival Corporation Financials
We’ve established that Carnival is a very large and global firm with over 100 large ships in its portfolio. Although squarely in the luxury cruise liner business, it is well diversified within it. That says little about its profitability or balance sheet. Let’s start with Q4 results that were just released.
• U.S. GAAP net income of $423 million, or $0.61 diluted EPS, for the fourth quarter of 2019, compared to U.S. GAAP net income for the fourth quarter of 2018 of $494 million, or $0.71 diluted EPS.
• Fourth quarter 2019 adjusted net income of $427 million, or $0.62 adjusted EPS, compared to adjusted net income of $492 million, or $0.70 adjusted EPS, for the fourth quarter of 2018.
• Adjusted net income excludes net charges of $5 million for the fourth quarter of 2019 and net gains of $2 million for the fourth quarter of 2018.
• Record total revenues for the fourth quarter of 2019 were $4.8 billion, higher than $4.5 billion for the fourth quarter of 2018.
• Gross cruise revenues of $4.7 billion for the fourth quarter of 2019, higher than $4.4 billion for the fourth quarter of 2018.
• In constant currency, net cruise revenues of $3.7 billion compared to $3.7 billion for the fourth quarter of 2018, an increase of 0.5 percent.
Subscribers are keenly aware of our thoughts on “adjusted” metrics so let’s take that head on.
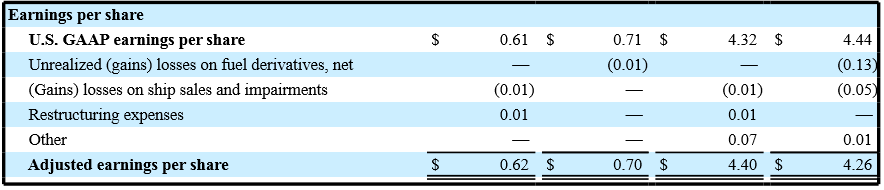
Source: Q4 Results
Unlike most companies, Carnival’s adjusted metrics are within a few percent of U.S. GAAP numbers. In other words, and we don’t say this often, it’s safe to rely on Carnival’s adjusted figures for at least 2018 and 2019.
Despite the headlines, Q4 2019’s gross cruise revenues were up a meaningful 6.8% versus Q4 2018. To be fair, most cruises are booked well in advance so this is informative but not a reliable indication on the impact of recent coronavirus issues. Q4 adjusted earnings and EPS were down a few percent year-over-year. Let’s look bigger picture at full year 2019 versus 2018.
• U.S. GAAP net income of $3.0 billion, or $4.32 diluted EPS, for the full year 2019, compared to U.S. GAAP net income for the full year 2018 of $3.2 billion, or $4.44 diluted EPS.
• Record full year 2019 adjusted net income of $3.0 billion, or $4.40 adjusted EPS, compared to adjusted net income of $3.0 billion, or $4.26 adjusted EPS, for the full year 2018.
• Adjusted net income excludes net charges of $52 million for the full year 2019 and net gains of $123 million for the full year 2018.
• Record total revenues for the full year 2019 were $20.8 billion, higher than $18.9 billion for the full year 2018.
• Gross cruise revenues of $20.4 billion, higher than $18.6 billion for the prior year.
• In constant currency, net cruise revenues of $16.0 billion, higher than $15.4 billion for the prior year, an increase of 4.0 percent.
2019’s adjusted earnings per share (“EPS”) of $4.40 grew a modest 3.3% over 2018’s. Constant currency revenues, the best metric to use to gauge sales, rose 4.0% over the period. Cash flow from operations is at a healthy $5.5 billion annual run rate; that applies to 2018 as well. Earnings and revenues are on a positive mid-single digit trajectory so let’s move to the balance sheet then examine the distribution.
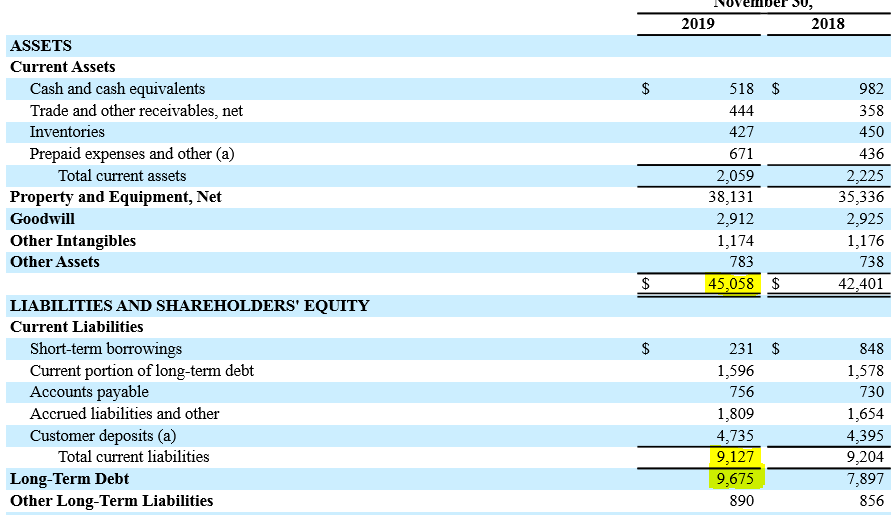
Liquidity is a little tight in the traditional sense but Carnival generated $5.5 billion in operating cash flow last year so it can afford a minor miss-match in total current assets and liabilities. Long-term debt of $9.675 billion is low relative to total assets of $45.0 billion. Its leverage ratio is conservative even backing out goodwill and intangible assets; these are items most ignore but shouldn’t. We are skeptical of Carnival’s ability to offload cruise ships during a crisis as their competitors, who are highly likely to simultaneously be in a panic, are the only realistic buyers. Nonetheless, they are in the ship business and it makes sense that’s where most of their equity would reside.
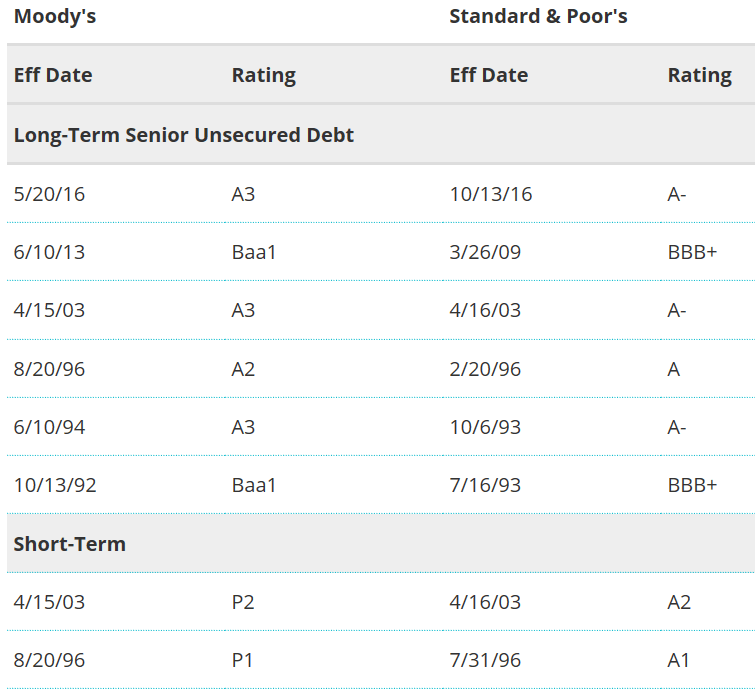
Let’s get a reminder on what these represent on the scale.

Source: Moody’s
This is more confidence from the rating agencies than many would expect. The green box we placed represents the range Carnival has landed in since the early 1990s demonstrating impressive consistency.
Interest expense is approximately $200 million annually compared to over a $1 billion in quarterly cash from operations and $400+ million in quarterly EPS. There is no issue there and contributes to the firm’s above average credit ratings.
The finances are tighter when it comes to the distribution. For full year 2019, Carnival paid $2.00 per share in dividends compared to $4.32 in EPS. Few companies with near 5% yields have 46.3% full year EPS payout ratio. Converting cash flow from operations into a per share equivalent lowers the distribution payout ratio to 25.0%. Before you buy 1,000 shares with a market order, take a close look at the next chart.
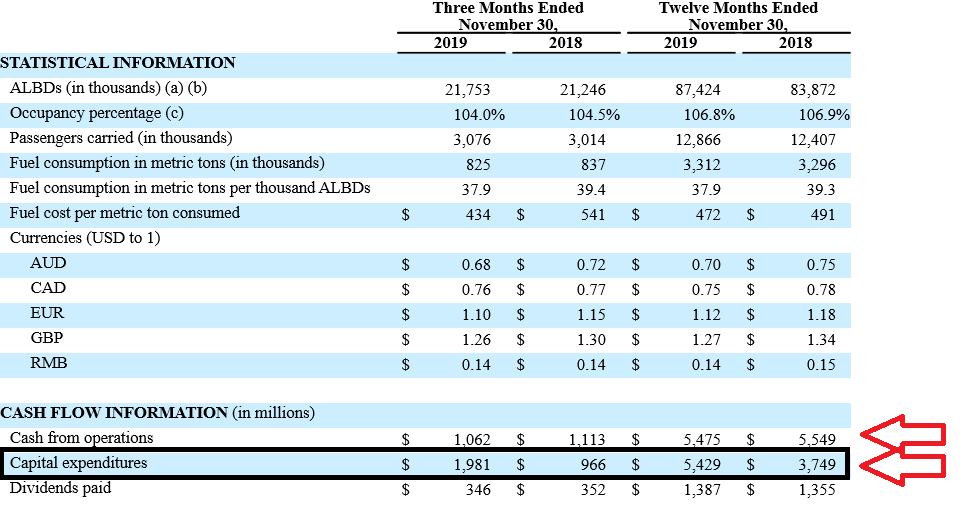
Cash from operations almost mirrors CapEx. In more recent times, Carnival has not generated enough cash flow to cover its tremendous CapEx requirements and its distribution. Maybe it’s a recent phenomenon?
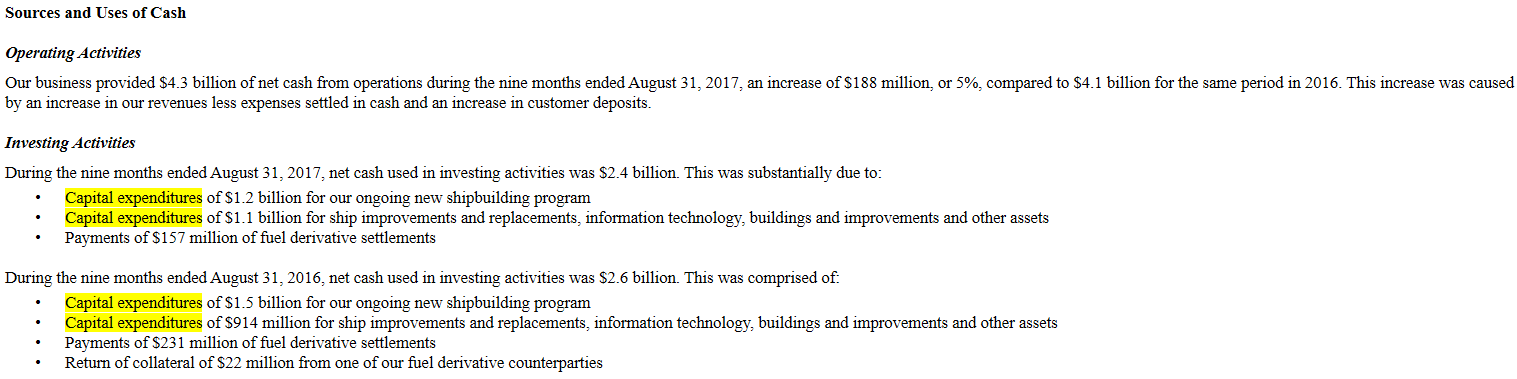
For both 2017 and 2016, over half of operating cash flow was directed toward CapEx to construct new ships and redevelop old ones. That being said, Carnival generated enough cash flow to support these programs, pay the distribution, and have ~$1.0 billion left over. This is positive in that the current imbalance of cash flow versus spending may be temporary but negative from a trend perspective.


The story of CapEx devouring most cash flow is the same going back the start of this bull market. Unlike previous years where there was some money left over, free cash flow will be near zero for 2020 and 2021. Both our projections and management’s indicate it has the potential to increase to $1 to $2 per share in 2022 and beyond depending on CapEx and if the global economy holds up. That’s progress but modest numbers for a stock trading around $40 per share.
2020 Outlook & CapEx
Carnival is entered fiscal year 2020 with record bookings from an occupancy point of view. As of the end of 2019, advanced bookings were slightly improved versus 2019 though at marginally lower prices. Hurricane Dorian is now considered the worst natural disaster to hit The Bahamas and slowed bookings notably in Q4.
Management provided a few useful specifics including net cruise revenues up 5.0% for the full year. They also pointed to the delay of the Mardi Gras.
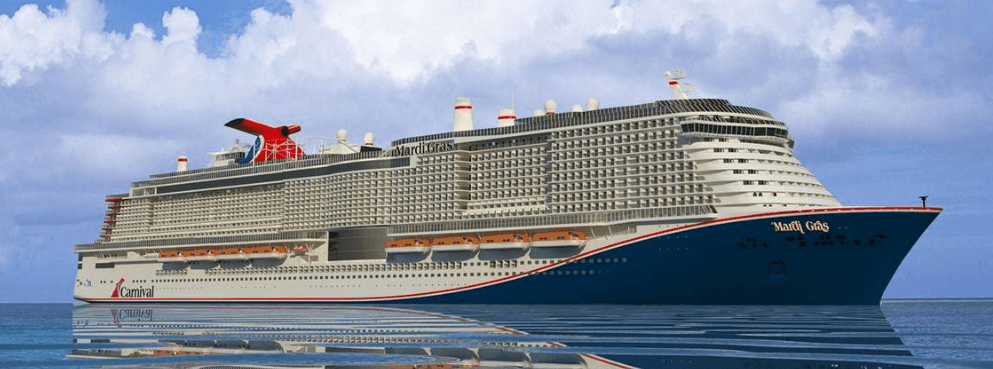
Source: BBC. Rendering of the Mardi Gras.
The Mardi Gras is set to be the largest ship in Carnival’s vast fleet so its delay consequential. Carnival’s 2020 outlook is materially impacted by changes in fuel including greater usage of Marine Gasoil (“MGO”) in line with sulfur emission regulations. As discussed in the “Risks” section, these ships look pretty but their pollution is in line with an oil tanker. MGO fuel usage is expected to more than double from approximately 20% in 2018 to 50% in 2020; the remainder is the more cost-effective but polluting Heavy Fuel Oil (“HFO”). In aggregate, management estimates a loss of $0.17 to $0.24 per share due to changes in fueling. Adjusted earnings are anticipated at $4.30 to $4.60 compared to 2019’s $4.40.
Risks
#1 The Panda in the Room
Below is management’s estimate of a if not the key negative aspect associated with the coronavirus.
However, while not currently planned, if the company had to suspend all of its operations in Asia through the end of April, this would impact its fiscal 2020 financial performance by $0.55 to $0.65 per share, which includes guest compensation.
If we apply this to expected earnings in 2020, the most conservative estimate ($4.30 and $0.65) is $3.65 per share while the most optimistic is $4.05 in adjusted EPS. This issue is challenging to encapsulate into hard numbers beyond what Carnival provided for us. It’s reasonable to assume bookings around the world will at least be modestly negatively impacted by 24 hours a day coverage on the coronavirus and the inevitable cases involving cruise ships.
We searched for news in each major global region and there are minimal cases outside of China though groups have emerged in Singapore, Iran and South Korea. We couldn’t find any material issues in Latin America or the UK, for example. The first death in Italy was reported over the weekend but the nation has at least 50 known cases is now labeled a “cluster” for the virus. While Carnival’s own CEO was in the media in 2018 suggesting China would be the largest market for cruises within five to 10 years, most of its current customers are based out of North America and Europe. The P&O Australian line visits Southeast Asia but that area has been surprisingly void of cases despite very high population densities and widespread poverty. In aggregate, underwriting Carnival at the low end of guidance coupled with the high end of the cost of shutting down Asian operations entirely or $3.65 adjusted EPS for 2020 is a valid but imperfect way to incorporate these risks.
A reversal to normal operating conditions in 2021 also seems reasonable. We believe that in part because we took the time and analyzed data from the CDC on past flu outbreaks and most dissipate from the public eye entirely within 24 months with the actual “outbreak” contained to half that. To be clear, this virus, though the death rate and overall danger once infected seems similar if not lower than the normal flu, could become a contagion and effectively shut down travel in other nations. If the UK and Italy were to be totally isolated by an outbreak, that could drive adjusted EPS to $3.0 or below. We consider a “total shutdown” in a majority of Carnival’s primary markets a tail risk but a risk nonetheless. The CDC just (2/24/2019) raised its advisory threat level for travel to South Korea and other examples of curtailing non-essential travel by large corporations and regulators is likely to keep occurring in the near-term.
The track record of litigation surrounding events like this was mixed. In many cases, cruise ships charge customers for providing medical care. We have to assume that class-action lawsuits may appear at any time independent of Carnival’s actions or preparedness.
#2 Giant Heavily-Polluting Diesel Engines
As a company with a strong European presence and shares listed on the FTSE, it’s no surprise that Carnival Corporation complies with the environmental, social, and governance (“ESG”) best practices that are common in Europe. A weakness in its armor, however, is the fact that cruise ships are (very) far from green. Here’s an excerpt from a report by Transport & Environment out of the European Union:
Carnival Corporation, the world’s largest luxury cruise operator, emitted nearly 10 times more sulphur oxide (SOX) around European coasts than did all 260 million European cars in 2017.

This is the same European Union that heavily subsidizes renewable energy and is banning all but electric cars from many major cities. Given many of Carnival’s lines are based out of the U.K. and continental Europe, I find it hard to believe they will be able to stay out of the EU’s cash-strapped cross hairs indefinitely. The move to cleaner fuels help, but we have to assume a significant risk of the EU levying steep penalties and taxes due to environmental concerns.
#3 More Cleanliness Headline Risk
The other kind of “dirty” is the traditional one and people justifiably pay attention to this metric. Let’s see how the Center for Disease Control (“CDC”) ranks cruise ships via its Vessel Sanction Program.
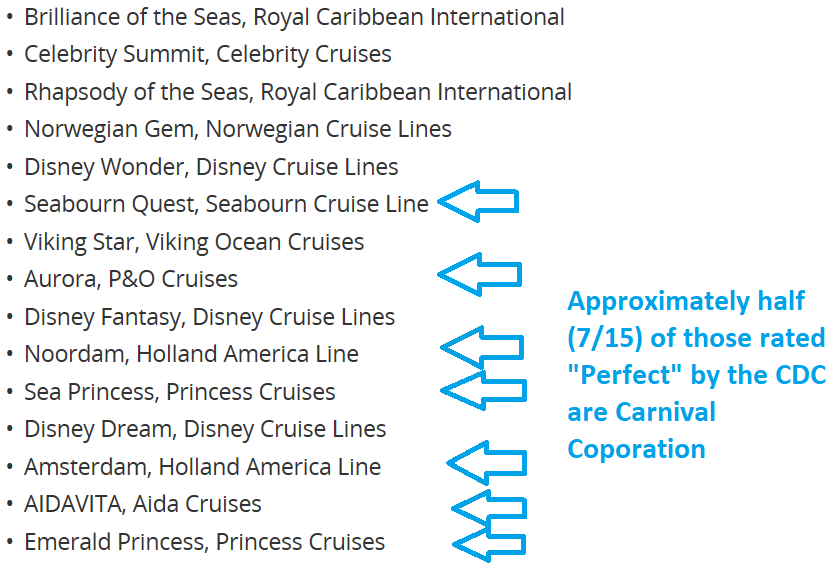
So far so good for Carnival Corporation with lots of scores in the “Perfect” category. Let’s jump to the bottom of the barrel and see what we find.
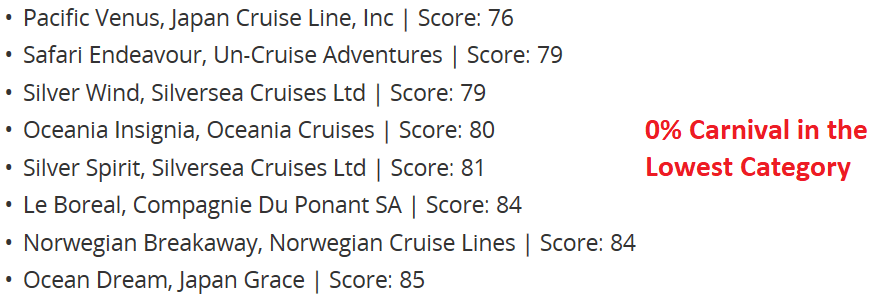
This list makes me more hesitant to travel on those ships but augments my confidence in Carnival.
#4 The Shipping Industry Are Slow Learners
The consistency that the shipping industry overbuilds to their own demise makes the oil and gas industry blush. Although it has done better than many peers, Carnival also tends to aggressively grow their fleet as the economic cycle expands. It takes years to build large ships and you can already surmise how this story ends. The very top of the economic expansion is when the industry has made the most commitment to more ships. These inevitably have uneconomic utilization rates as demand decreases; tough times transform into disasters. The same pattern applies to dry ships and other areas of the shipping market. Carnival currently has 19 ships, or nearly 20% of its entire fleet, under construction to be delivered in the next 24 months. This results in a significant net increase in capacity whether or not consumer demand is there. And as if it needs to be said, giant luxury cruise liners do not have much utility outside of taking passengers on vacation.
Demographic tailwinds offset this risk though not entirely. The baby boomer and older generation are the wealthiest in history and tend to enjoy cruises both in North America and Europe. This group is anticipated to choose cruises over more taxing vacations as they age. This gives the cruise industry a boost for the next 10 to 20 years. Carnival’s pointed investment toward attracting younger families via its AIDA line and cost-efficient millennials through other lines reduces its dependency on baby boomers.
Valuation & Peer Comparison

Source: Yahoo! Finance
Carnival Corporation isn’t the only one who’s had a rough two years. Royal Caribbean Cruises Ltd (RCL) and Norwegian Cruise Lines Holdings (NCLH) are down 13% to 18% over the period, respectively, but Carnival takes the crown at -36%.
Norwegian and Royal Caribbean have forward price-to-earnings (“P/E”) ratios of 9.15x and 10.85x, respectively, compared to Carnival’s 9.50x. Despite its greater share price decline, Carnival is currently trading with its peer group valuation wise. We performed cursory reviews of Carnival’s two peers and they also suffer from high CapEx and struggle to generate free cash flow though Norwegian has had periods of higher growth. All three tend to necessitate higher CapEx than depreciation over time; the high degree of investment is a structural element of the businesses. Based on a small but random sample of old ships, none operated for over 30 years.
Why does that matter? Cruise liners tend to depreciate their vessels over that time frame meaning true depreciation is larger than what’s listed on the financial statements. This reconciles some of the disparity between CapEx and depreciation. CapEx has a major influence on Carnival’s financial condition and distorts its true cash flow generation and distribution payout ratios. It also makes it’s price-to-earnings ratio seem lower than it really is.
Price-to-Earnings Multiple: Good. Free-cash-flow Multiple: Better.
Imagine two firms, A & B, each generating $1 in EPS. Firm A trades at 20x earnings, or $20 per share, and must reinvest 25% of its profits to maintain $1 in EPS.
Firm B trades at a much cheaper 10x earnings multiple, or $10 per share, but needs 75% of its earnings reinvested to maintain the status quo. It’s not obvious, but Firm A is actually “cheaper” when you run the numbers.
In the end, $20 invested in Firm A provides 75 cents in annual free cash flow or a 26.6x FCF multiple. One $10 share of Firm B produces $0.25 in annual free cash flow. That’s a 40x FCF multiple!
This phenomenon is happening right before our eyes with Carnival, Norwegian, and Royal Caribbean. These are profitable and surprisingly consistent businesses (not compared with the durability of Canadian banks or most Dividend Aristocrats but rather to investor expectations) but it’s critical to use realistic and holistic underwriting when determining the proper entry price.
We reserve specific entry/exit points and risk ratings for subscribers to Institutional Income Plus but believe an attractive entry point from a risk-adjusted perspective is does exist below today’s levels. Our assessment on Carnival Corporation is positive in terms of its long-term prospects, reasonable leverage, international diversification, and strong credit ratings.
We initially submitted this article for publication when CCL traded between $41 and $42 per share and used this language:
But at this point in the cycle coupled with the challenges we’ve discussed, our math and experience points toward waiting for a lower entry price as the smart move.
At the time, that seemed unrealistic if not extreme. Only days later (2/26/2019), CCL trades at $33 and it’s at the high end of our acceptable valuation range. Investors should expect very high volatility in the cruise ship companies until a better grasp on the coronavirus is achieved but with high risk comes the opportunity for high reward.
Thank you for reading.
Interested in more income recommendations across traditional and nontraditional asset classes including real-time alerts?  Start a free trial of our Institutional Income Plus service. Learn about our institutional investing approach built through experience not just books. Join the community to access this week’s recommendations, and specific entry and exit targets in real-time, involving BDCs, REITs, Preferred Equity, and many others. We have an all-inclusive income model portfolio, allocation guidelines, and issue bi-weekly market commentary.
Disclosure: I/we have no positions in any stocks mentioned, but may initiate a long position in CCL over the next 72 hours. I wrote this article myself, and it expresses my own opinions. I am not receiving compensation for it (other than from Seeking Alpha). I have no business relationship with any company whose stock is mentioned in this article.
Editor’s Note: This article discusses one or more securities that do not trade on a major U.S. exchange. Please be aware of the risks associated with these stocks.
Be the first to comment