


CatLane
Introduction
Over the last year, the stock of Carlisle Companies (NYSE:CSL), a supplier of building envelope products, has performed reasonably well; even as the broader markets have witnessed erosion to the tune of mid-single digits, CSL has delivered steady returns of ~12%.
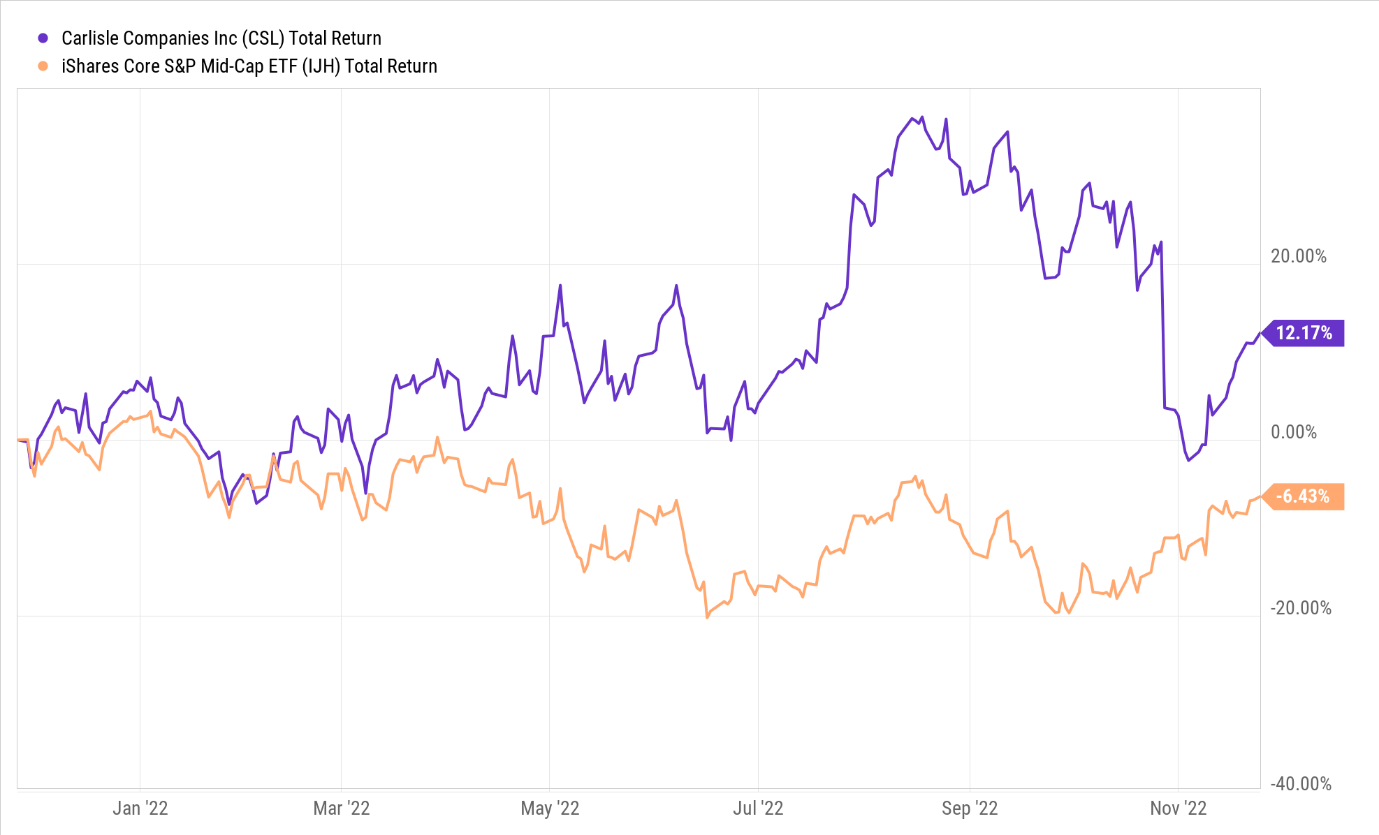
YCharts
So far so good, but at this juncture, I would advise investors to tighten their seatbelts. Here are a few reasons why I’m cautious about the stock’s prospects.
Reasons To Be Cautious
CSL may have been on a good ride for much of 2022, but typically, in Q4, business momentum tends to dip (at least compared to the summer months of Q2, and Q3) and I would expect that to play out this year as well. I also worry about the tough comps that CSL’s largest division-CCM (Carlisle Construction Materials) will come up against, and I don’t see how it will continue to maintain the same run rate (Revenue growth in Q4-21, Q1-22, and Q2-22 of 46.5%, 58.4%, and 58% respectively).
Investors should also be mindful of the recent data which suggests that industry trends could be poised to turn. In the Q3 call, CSL management had touched upon some weaknesses in the architectural metals space, and there’s reason to believe this could worsen in the foreseeable future. The Architecture Billings Index (ABI) is a leading indicator of non-residential construction activity by 9-12 months and the most recent report showed that the level of billings had declined for the first time since Jan 2021! CSL may yet have a sturdy backlog to tide over difficult times in the near future, but this is unlikely to sustain for too long. The AIA report also showed that the pace of new design projects has been dwindling.
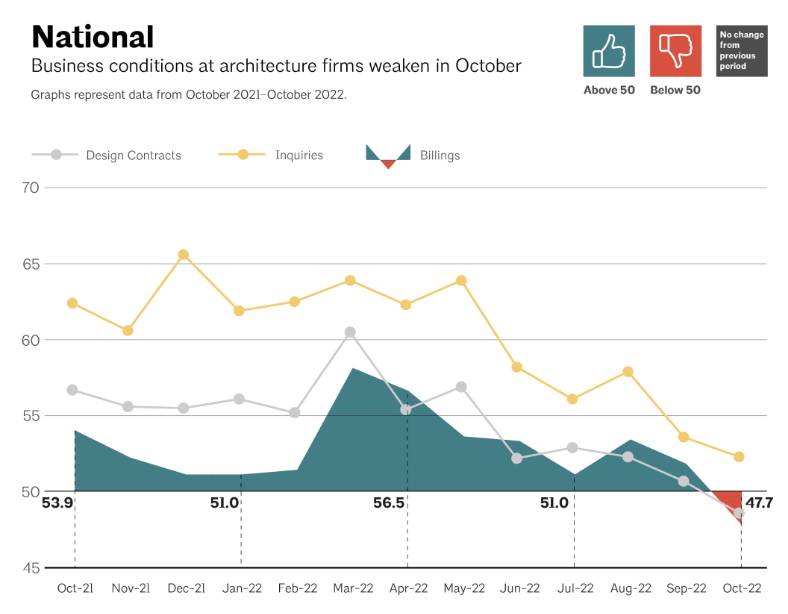
AIA
Admittedly, commercial construction bulls may also point to the sturdy pace of the Dodge Momentum Index which gives one a sense of non-residential planning momentum (the DMI typically leads non-resi construction by 12 months) but please also note how overextended the index looks, as it is inches away from the 200-point mark, and well above the highs seen in 2008; I don’t believe this momentum is sustainable and it should reverse soon enough.
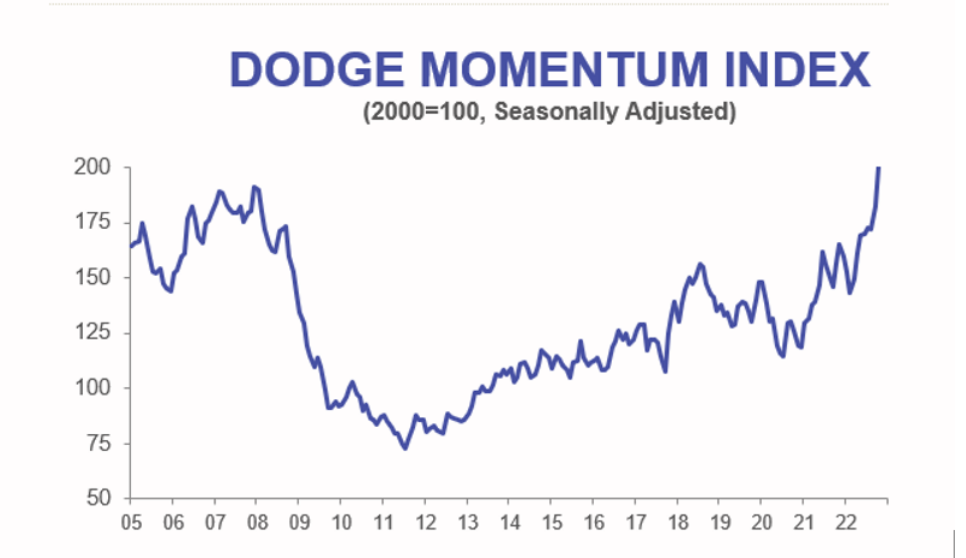
Construction
Then also consider that sourcing of HVAC equipment and wiring will continue to be a challenge for the foreseeable future, with lead times poised to persist till 2024. The prices of CSL’s key raw materials such as cement and drywall will also likely remain elevated until H1-23.
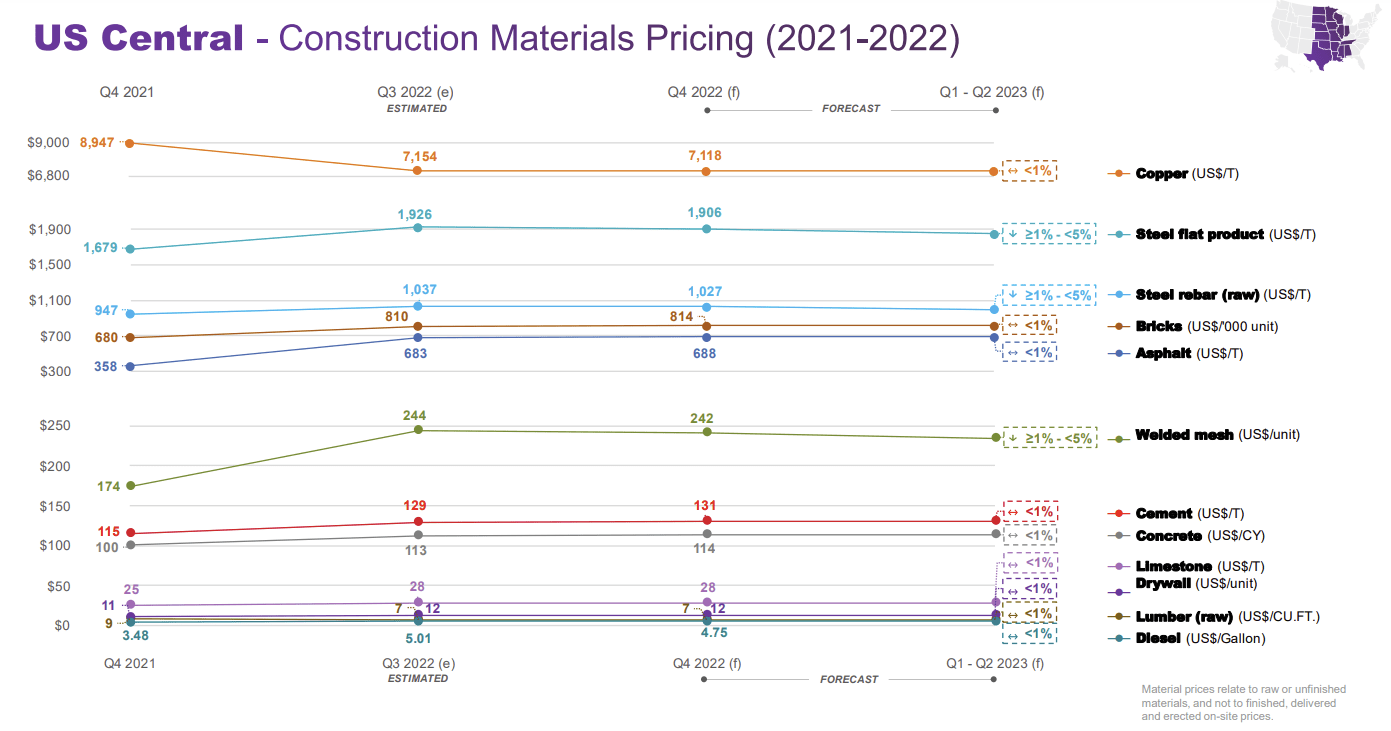
Linesight
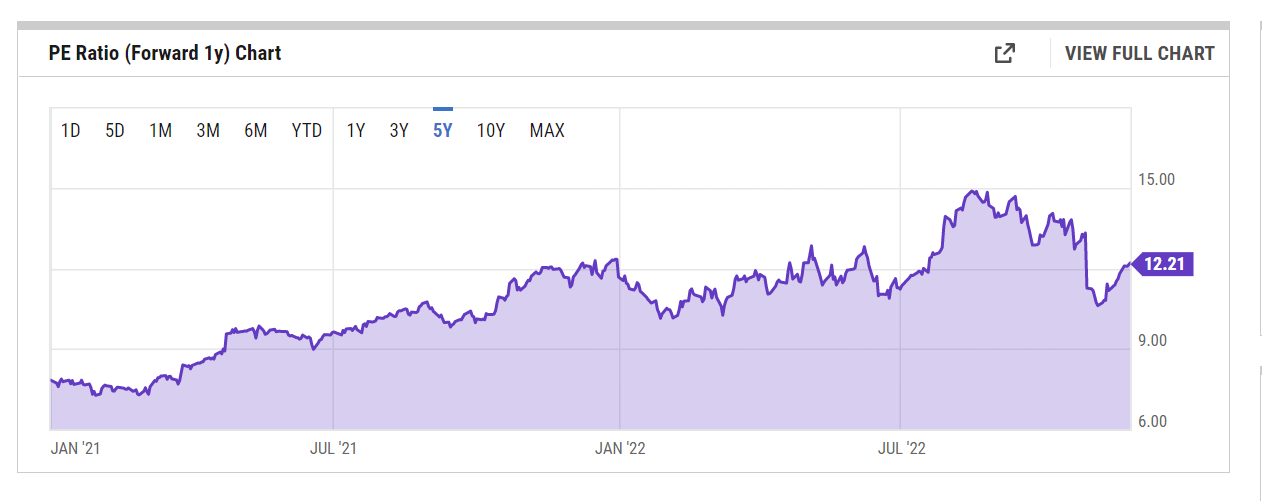
Then we come to the unappealing valuation backdrop. Despite a ~20% correction in the share price from its lifetime highs, the forward valuations based on FY23e numbers still look pricey. According to consensus, CSL will likely deliver an EPS figure of $21.16 next year, implying EPS growth of 7%; for that level of EPS growth, investors would be expected to shed out a P/E of 12.2x at the current share price, which is also 13% higher than the stock’s 5-year average multiple.
YCharts
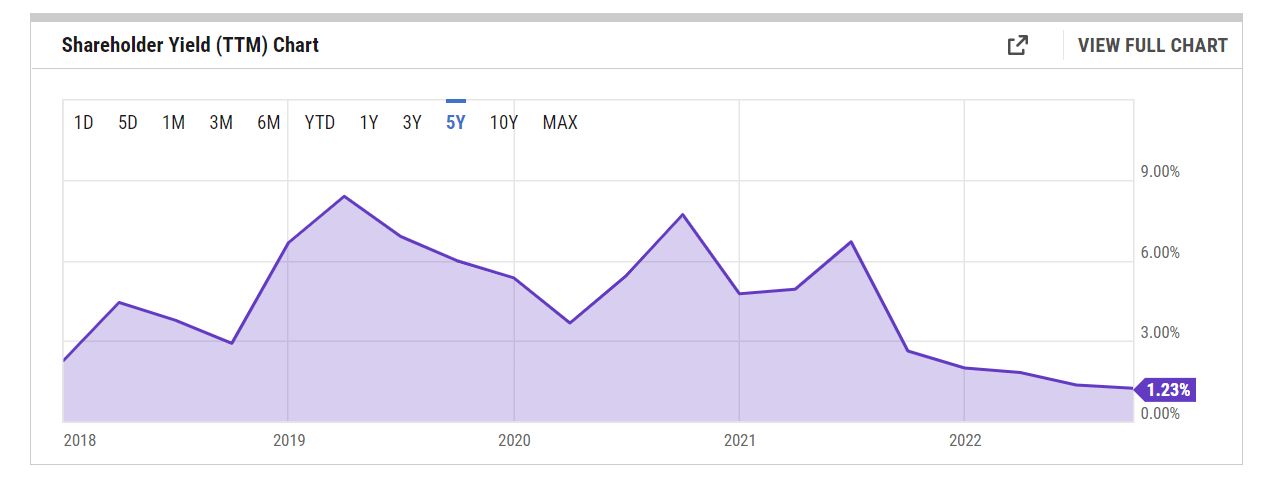
CSL also has a fairly long history of rewarding shareholders via distributions (increased dividends for 46 straight years, whilst it has been buying back its shares every year since 2015) but it’s worth noting that from a shareholder yield perspective (this metric is a function of dividends, buybacks, and debt paydown), at current price levels, CSL does not represent a great bet. Over the last five years, CSL’s shareholder yield has averaged nearly 4.5%, but currently, it is at its lowest point in five years at 1.23%, reiterating the sub-optimal entry point.
YCharts
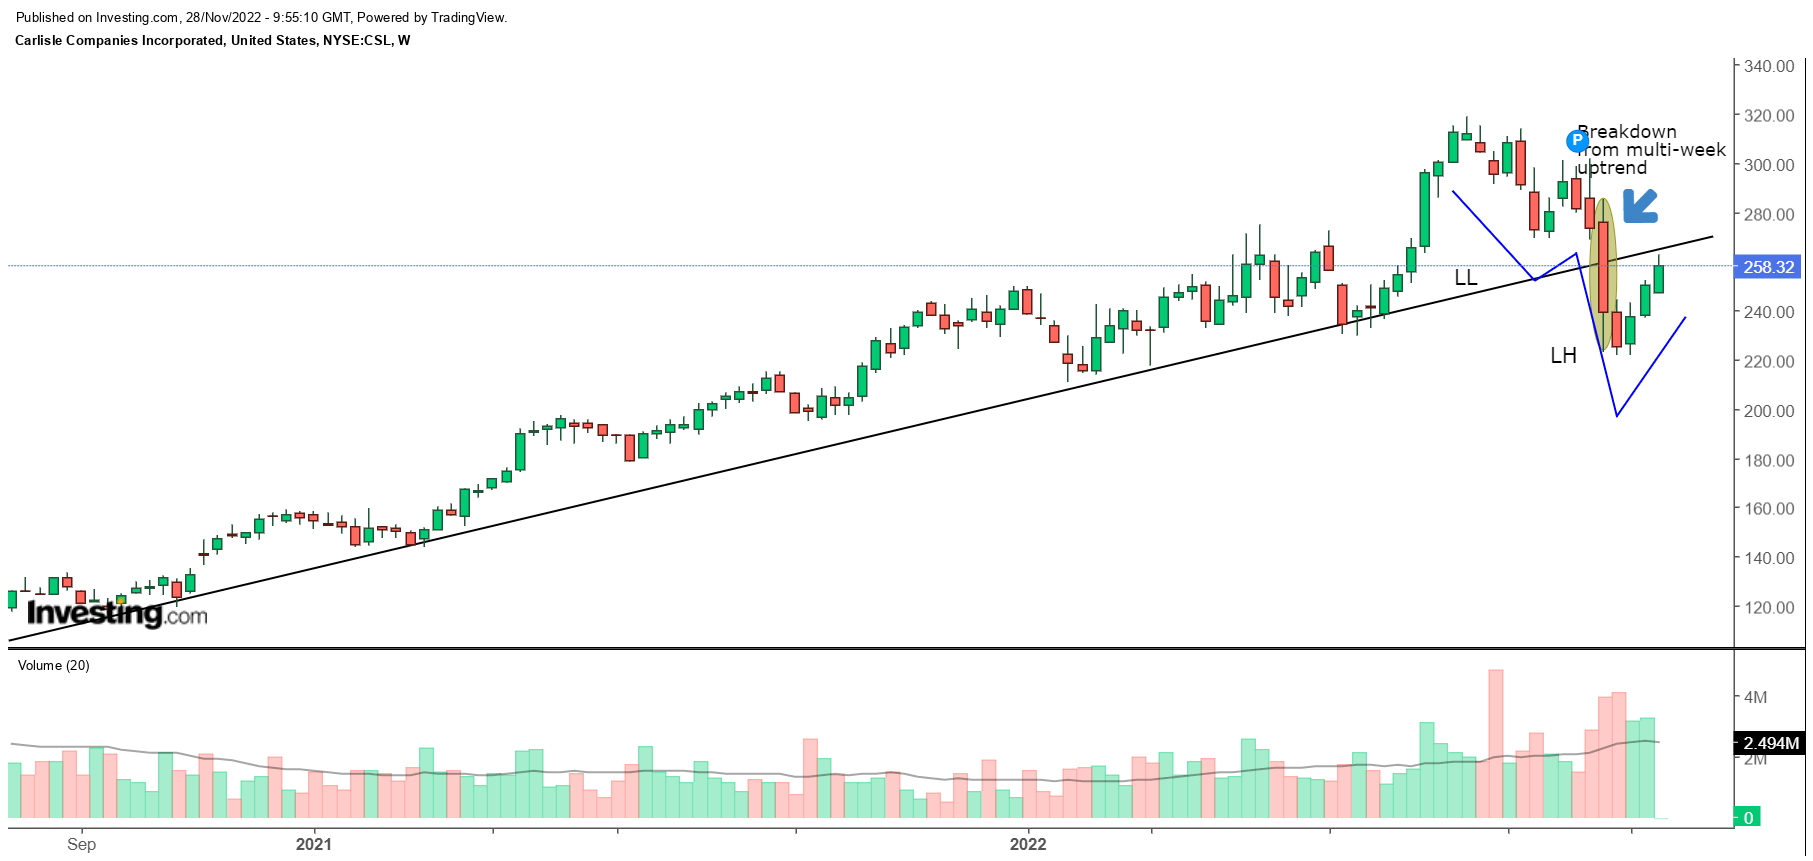
Then, when it comes to the technicals, things aren’t great here either. The stock peaked in mid-August, and in late October we saw the stock break down from a multi-week uptrend that had previously been in play since May 2020. The recurring patterns of lower lows and lower-highs reiterate the presence of an obvious downtrend, and until the stock can close above the $280-$285 levels on the weekly chart this will be in play.
Investing
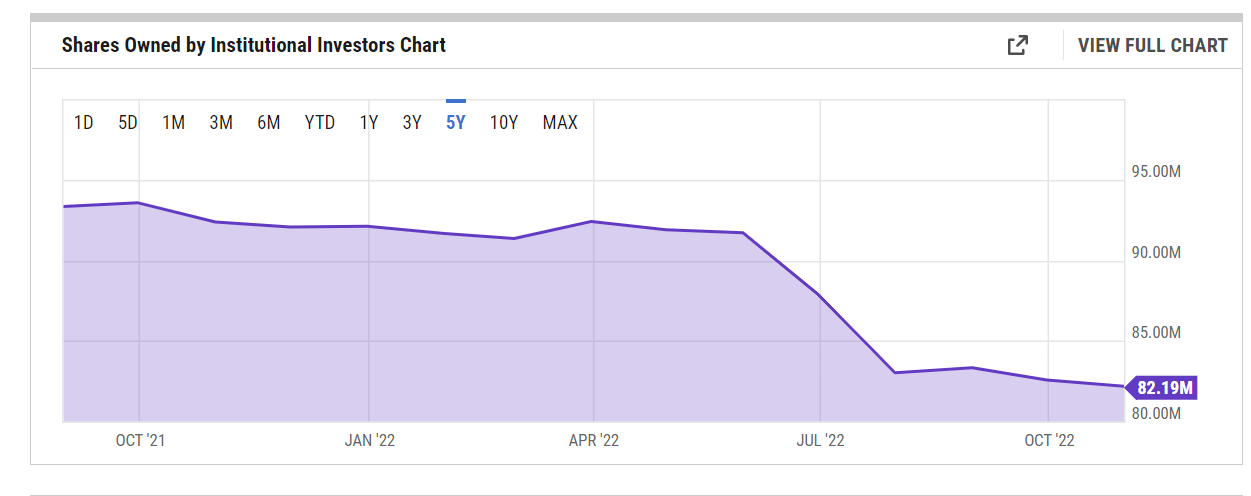
To get the stock to make big sustained moves on the upside, you would need to see investors with deep pockets back any potential move; in other words, the institutional investors; but judging from the latest data, these guys have shown no inclination to stall their selling in CSL stock. The image below highlights how shares held by institutional investors has come off meaningfully in recent months, particularly in H2-22
YCharts
Finally, it’s also difficult to view CSL as a suitable mean-reversion play as it looks overextended to the upside, relative to its peers from the mid-cap space, as well as its peers from the building and construction space. The chart below highlights how CSL is positioned relative to other mid-cap stocks. Note that the current relative strength ratio is still 22% higher than the mid-point of the long-term range.
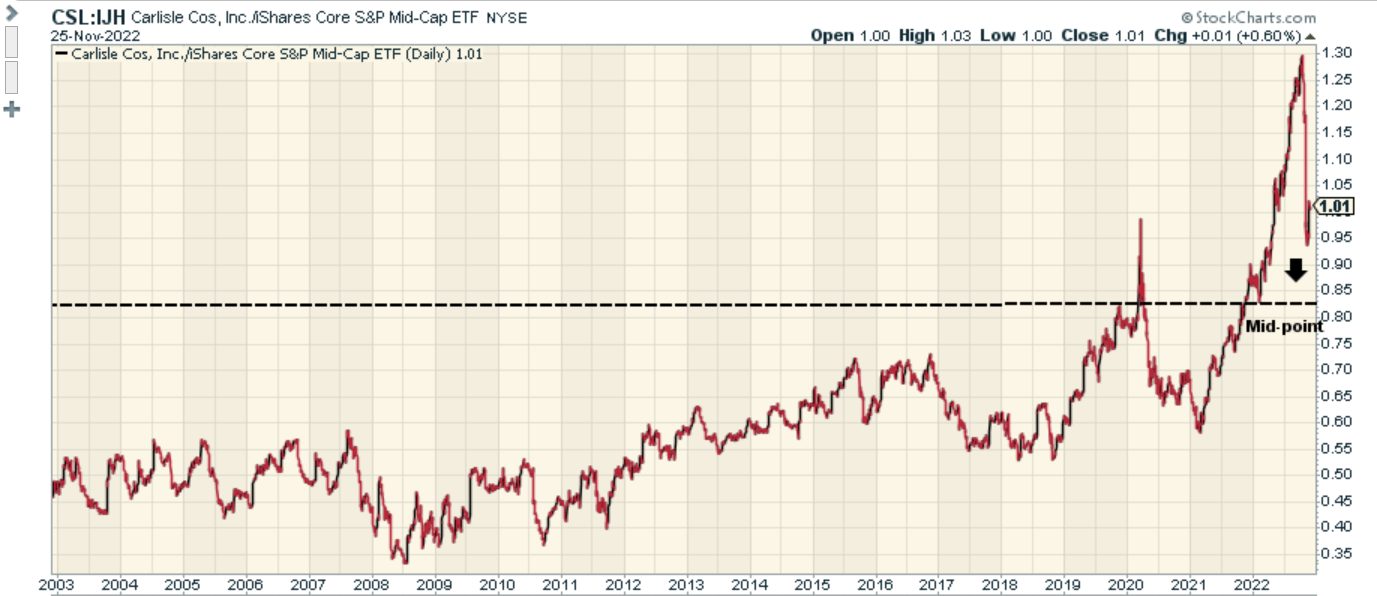
Stockcharts
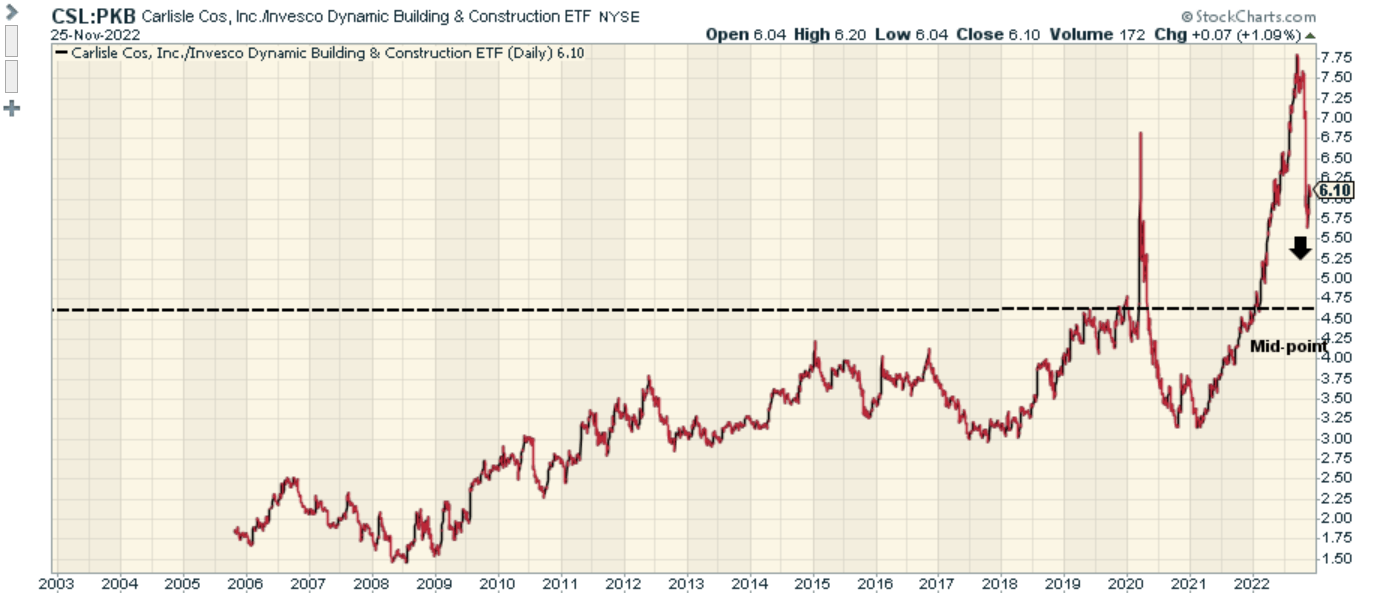
Meanwhile, the image below shows that the relative strength ratio of CSL and other building and construction stocks is still 32% higher than the mid-point of the long-term range.
Stockcharts
Until the relative strength ratios on both charts are below or close to the mid-point of its long-term range, I don’t believe the risk-reward for a long position in CSL looks suitable.
Be the first to comment