

Solskin
Investment summary
Recent company-specific tailwinds have seen shares of CareMax, Inc (NASDAQ:NASDAQ:CMAX) catch a strong bid in H2 FY22 and re-rate to the upside. Whilst there’s an element that’s beta-related from the July bounce in equities, there’s still plenty of idiosyncratic premia to harvest in this name. With the Steward Healthcare transaction now complete, we now have more conclusiveness on its accretion to pre-and-post-tax earnings. Shares are also fairly priced at 1.2 book value, and net-net, I rate CMAX a speculative buy.
CMAX Q2 earnings provide insights to FY22 full-year expectations
CMAX came in with a fairly strong set of numbers that saw upside against consensus at the top line. Revenue lifted 280% YoY to $172 million (“mm”). Meaningful growth was observed across Medicare and Medicaid at-risk revenue, each up triple digits YoY. In fact, Medicare members grew by 3,000 sequentially from Q1 this year, as the company converted this amount to full-risk revenue, thus helping secure the uptick in turnover.
Meanwhile, the consolidated medical expense ratio (“MER”) for Q2 came in at 73.6% and sub-70% when excluding the medical service organization (“MSO”) business. This does speak to the company’s success rate in ensuring patient health and safety.
Management believe that, if CMAX can achieve its MER targets and new MSO membership nudges past 85%, this could represent an annualized medical margin addition of $10mm [even with no additional members after hitting these targets]. CMAX defines medical margin as: [Medicare & Medicaid at-risk revenue minus external provider costs]. This number came in smaller than in Q2 FY21, adding ~240bps to the reported MER.
Further, cost of care numbers jumped 13% YoY to $30mm, as compensation adjustments were rolled out in April, plus from an uptick in pharmacy script volume [stretching up associated COGS]. More so, however, was that CMAX booked its first quarter of turnover from facility costs at the 3 de novo facilities opened recently in both Texas and New York. It continues to push towards opening 15 de novo centers for FY22 total.
One key standout has been the company’s contribution margin (“PCM”) from FY20 to date, as seen in Exhibit 1. Trends have exhibited a growth from low points in Q2 FY21 and are now back above FY20 levels, and this serves as a key tailwind to non-GAAP earnings looking ahead. CMAX defines platform contribution as [revenue, minus the sum of external provider costs and cost of care]. What’s been equally as pleasing is growth in these numbers has occurred alongside a simultaneous increase in new centers, patients and markets.
Exhibit 1. CMAX patient contribution margin trends from FY20–date
- Satisfactory growth trends across all segments
- PCM now back above FY20 levels
Data: CMAX 10-Q Q2 FY22, pp.26: “Platform Contribution”; see: table, “Non-GAAP Operating Metrics”. 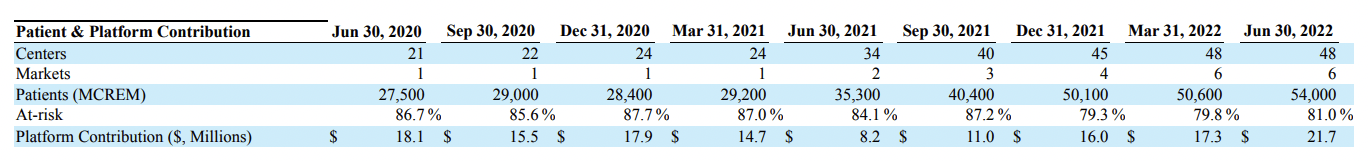
As seen in Exhibit 2, the leverage of new centers to PCM has been a positive relationship. The pace of new center openings has ratcheted PCM up by double-digits following each period where de novo centers are completed. This is a satisfactory set of numbers when looking ahead, and serves as a bedrock to the company’s planned growth trajectory. Should the company continue along this trend, this adds a bullish asymmetry to the risk/reward balance.
Exhibit 2. There’s a high degree of ‘operating leverage’ from new center openings on a sequential basis.
- Adds to predictability of future cash flows in gauging corporate value.
- Suggests efficiency in turning costs associated to new centers into contribution margin.
Note: All figures in $mm or [%]. “Operating leverage from Centres to PCM” defined as QoQ percentage change in new centres / change in platform contribution margin. (Image: HB Insights. Data: HB Insights, CMAX SEC Filings)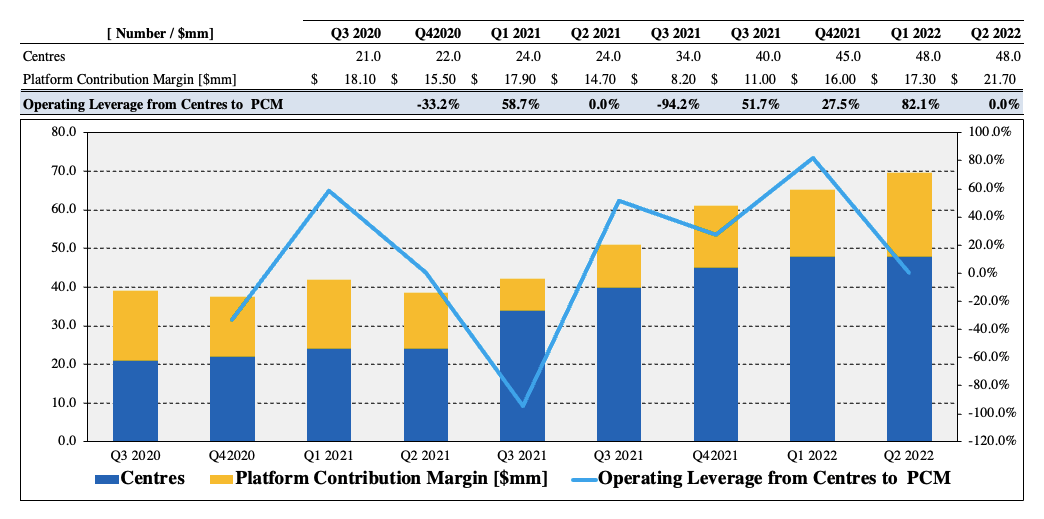
Price action – downtrend continues, seriously testing resistance
Given the stock’s relatively new entrance to public life [it listed in Q3 FY20′] I wanted to see how the market’s reacted since its NASDAQ debut. As seen in Exhibit 3, shares have walked the stairs down south in H2 FY22 in continuation with the longer-term downtrend shown below. However, there’s been a key change in price action to coincide with the Steward Health transaction [discussed later].
The stock has caught a bid since this point and tested lows of ~$3.45–$3.50 on 2 occasions before bouncing away and testing the long-term resistance level [light blue line shown to ceiling of resistance seen below]. In addition, long-term trend indicators have stretched up in the July bounce in equities, adding validity to the recent uptick. Momentum has, however, pulled back to range and is unsupportive of the same.
We need to see shares test the upper resistance level shown and break through this point for CMAX to catch another strong bid up to our price target.
Exhibit 3. Long-term downtrend since listing in FY20′
- Both price distribution and volatility has been held within this range.
- Now testing resistance at the levels seen below.
Note: 12-month chart shown with daily bars, with momentum and on balance volume in the 2 subsequent windows, respectively. (Data: HB Insights, Refinitiv Eikon)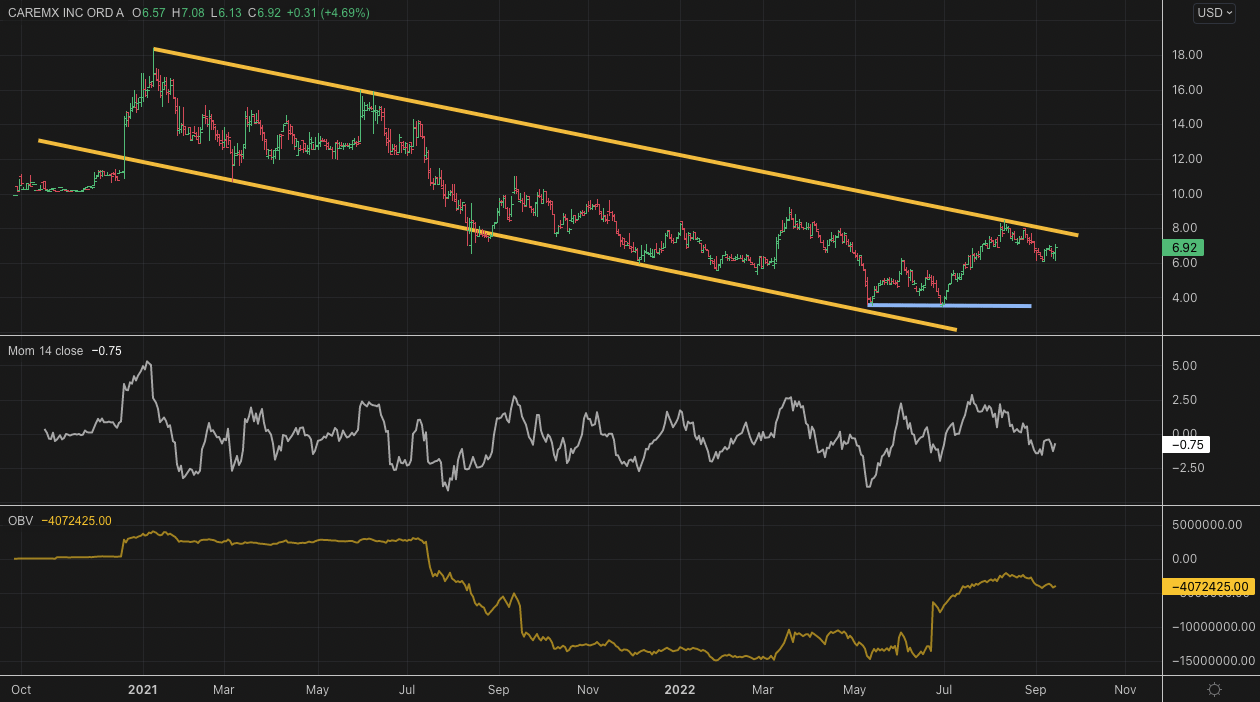
In addition, on the 9-month daily cloud chart seen below, shares are trading in the cloud and now garnering cloud support at current levels. The lag line [shown in white] is also stretched up above the cloud, and combined, these 2 features have me constructive on the validity on the bullish trend.
Exhibit 4. CMAX 6-month daily cloud chart exhibiting bullish price action
Data: Refinitiv Eikon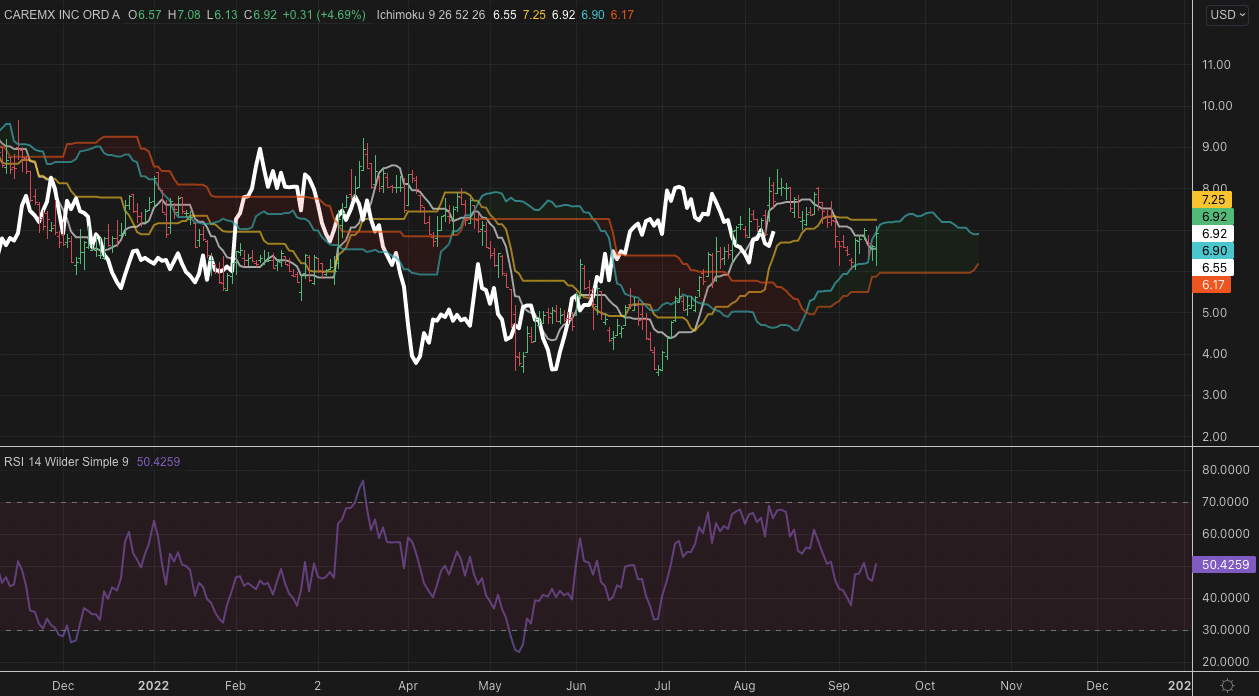
Steward Health transaction – key price catalyst
CMAX announced back in July that it signed a definitive agreement to acquire the Medicare value-based care business (“MVBC”) of Steward Health care System. CMAX is now the sole value-based MSO for the division.
Just as a side note – as an indication of the rich value to be derived in this space, note, value-based healthcare rival One Medical (ONEM) was acquired by Amazon (AMZN) in July as well, on a $3.9 Billion valuation [including net debt].
The company made the transaction on a part-cash / part-scrip consideration of $25mm cash, and another 23.5mm Class A CMAX shares. In total, the implied valuation on these metrics was ~$135mm, or ~8x EV/FY23 EBITDA [EV at the time, not today]. CMAX projects $100–$115mm in EBITDA from the newly acquired assets by FY25. There’s also an earnout feature embedded into the deal that would see Steward shareholders obtain a sizeable equity position [c.41% of the Class A shares outstanding], contingent on a transfer of revenue from 100,000 at-risk Medicare patients over to value-based risk turnover.
As a result of the acquisition, CMAX will now serve Steward’s Medicare network exclusively, managing 161,000 senior value-based lives, and another 1,800 providers across the 3 membership programs.
Valuation and conclusion
Shares are trading at an attractive discount to peers at book value and top-line multiples, as seen below. CMAX is priced at 1.2x book value and ~2x sales, however the lack of earnings is also something to consider here as well in terms of valuation. Despite this, however, these multiples offer compelling value especially in light of the idiosyncratic tailwinds outlined above.
Exhibit 5. Multiples and comps analysis
Data: HB Insights, Refinitiv Datastream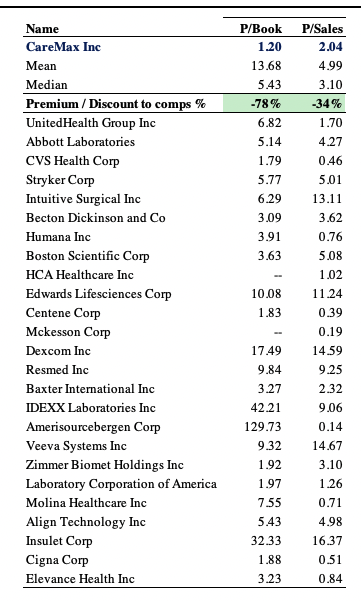
In view of the points raised throughout this report CMAX is a buy, by our estimate. Shares are adequately priced and there are a number of tailwinds still being priced in, both company-specific and related to sector-beta. The Steward Healthcare transaction is a key upside driver that looks to be accretive to earnings over the coming 2-3 years. I’m not confident the market has fully priced this in yet, and therefore firmly believe the alpha opportunity is still readily available to harvest in this name. I rate CMAX a buy.
Be the first to comment