

Zolak/iStock via Getty Images
By Luke Oliver
What a time to be in the carbon markets. As we pass mid-year, the KraneShares Global Carbon Strategy ETF (Ticker: KRBN) celebrates its 2nd anniversary of opening the global carbon markets to investors. In the same week, the US Senate has just worked out an epic $369bn climate and energy deal. The Inflation Reduction Act of 2022 marks a continued acceleration towards decarbonization and tightening efforts around emissions. At this pivotal moment for carbon markets, I see a material opportunity ahead and some misunderstandings too.
The first half of the year has been incredibly interesting for all markets, not least carbon markets, due to the ongoing invasion of Ukraine that has materially disrupted the energy supply in Europe. With the specters of the market recession, inflation, and geopolitical risk comes a unique window of opportunity. In this paper, I will briefly recap what happened in the carbon markets so far this year and then discuss what I think will happen next for the major emission trading schemes.
First Half of 2022
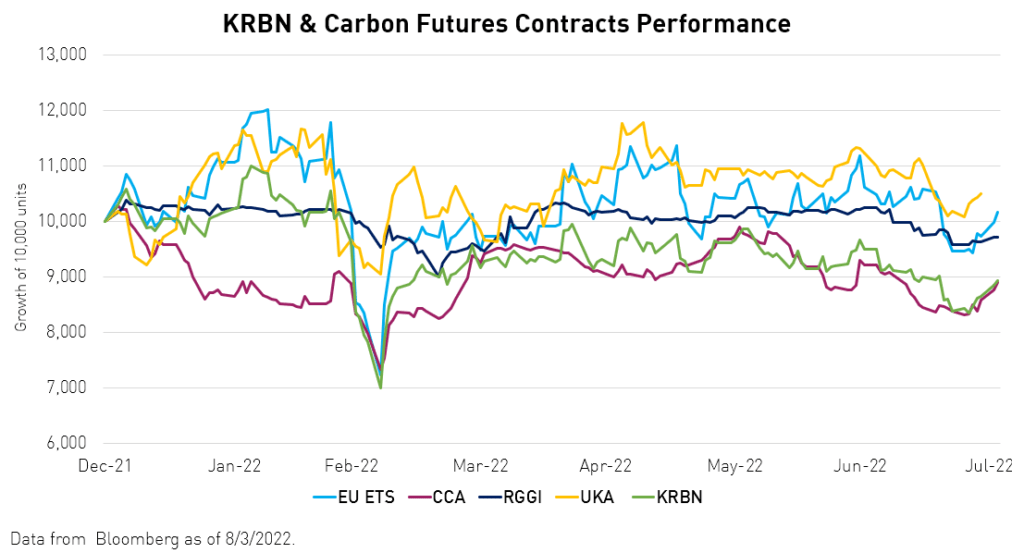
I will keep the H1 recap brief. KRBN posted 108% return in 20211 and was the second-best performing US-listed ETF of the year.2 This piqued a lot of interest in the rapidly growing asset class and put allocation to environmental products on the map.
The performance data quoted represents past performance. Past performance does not guarantee future results. The investment return and principal value of an investment will fluctuate such that an investor’s shares, when sold or redeemed, may be worth more or less than their original cost, and current performance may be lower or higher than the performance quoted. For performance data current to the last month-end, please visit our website at www.kraneshares.com or call +1 (855) 8KRANE8.
2022 started out much the same way, with European and UK carbon both posting ~19% returns in the first quarter, before the Russian invasion of Ukraine turned many of the region’s dynamics on their head. We had been vocal with clients in Q1 about the dwindling inventories of natural gas and reduced supply from Russia, which could increase the price of carbon as the risk that more coal would need to be burned to keep EU lights and A/C on during the summer. What we did not realize at the time was that this was likely a strategic initiative to put Europe in a weaker bargaining position following the invasion. The invasion is first and foremost a humanitarian tragedy. If we focus on the market impact, and specifically the carbon market, it created an unusual scenario.
Firstly, there was a technical sell-off in the days following the invasion that I covered in detail here though I will not dwell on it in this paper as it does not change fundamentals. Less natural gas, because of the geopolitical disruptions, means more coal burning, which was “good” for carbon prices as it increased demand for emission allowances. However, extremely less natural gas could mean two things; much higher energy prices, which could tip the EU into recession, AND the potential for short-term gas rationing or cutting certain industrial processes such as fertilizer or metals production. Both could soften the demand for allowances. And, the increasing realities of climate change, including global heatwaves, may lead to a push for tighter regulation and increased action, which should be highly constructive for carbon allowances.
So, what’s next? Let us dispel some myths and answer the questions I am hearing in the market.
Correlations
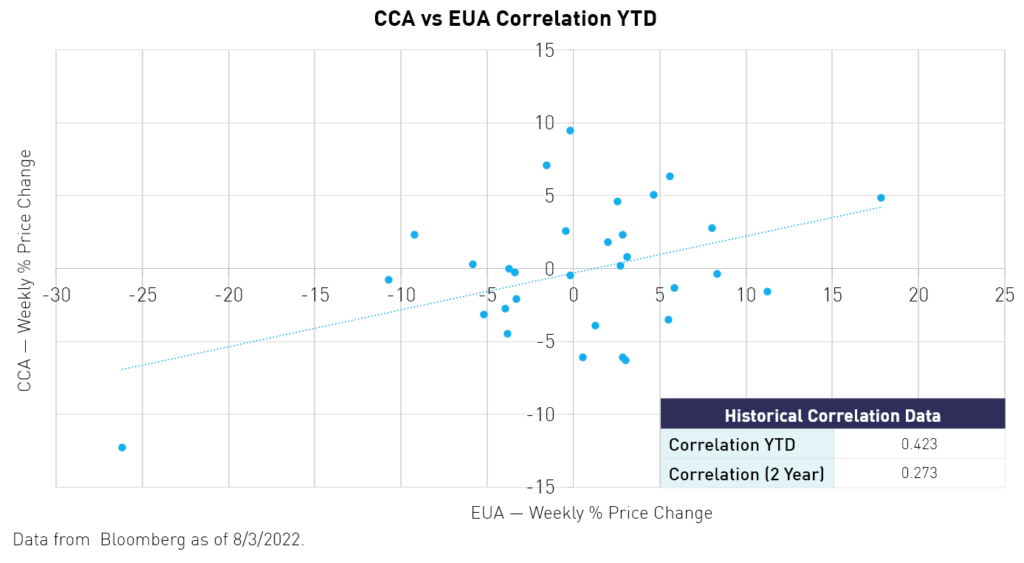
First, a quick one. People keep asking why carbon is suddenly correlating with other asset classes and why carbon markets seem to be correlating with each other. They are not. Just because an asset correlates with another asset at a specific moment or over a specific time period does not make them correlated. A wise person once told me, “If you need to cherry-pick periods to find correlations, the things don’t correlate” (if it was you, remind me, and I’ll credit you). Yes, there were some extreme days where markets moved together and with other asset classes too. Global macro views will always find occasion to cross asset classes, and margin calls in one asset can draw on the liquidity of other assets. However, each of the four major carbon markets have differentiated drivers that will continue to keep them decorrelated. These range from having different emission targets, demand/supply ratios, economies, fuel mixes, climates, political regimes, etc., and of course, none of them are fungible with each other. As I type, year-to-date (YTD) performance for EU allowances (EUA) is -2%, California allowances (CCA) -16%, Regional Greenhouse Gas Initiative (RGGI) -6.7%, and UK allowances (UKA) +4.4%3… these are not correlated.
Europe
This is the big one so I will spend most of our time here. The European ETS, or EUA, is 60% of KRBN and 100% of the KraneShares European Carbon Allowance Strategy ETF (Ticker: KEUA). Their law-making process, which we wrote about here, is lengthy and complex. This often leads to the proposed policy being reported in a way that sounds like policy implementation, potentially creating confusion about which measures are being implemented. As a result, we constantly get asked: Is the EU ETS still tightening? Is the EU now easing? Are they limiting speculators? Are they selling extra allowances from the market stability reserve? Is the sky falling? The answer to these questions is mostly NO, with just a little bit of “maybe”. And this, we believe, creates opportunity.
Let’s be crystal clear, EU Allowances are only down 2% YTD.3 This is incredible and reflects how the market is pricing the news flows – the sky is certainly not falling. The perception that there is a reversal here is greatly exaggerated. We’re just not up 66% as we were at this point last year. It is worth noting that euro (EUR) weakness, or US dollar (USD) strength depending on how you’re looking at it, is what has caused the drag for US-based investors. However, this price move looks to be rolling over with the EUR-USD bouncing off parity in mid-July.
Since the volatility of late March, there have been new proposals and advancements in existing proposals in the European ETS. The developments are overwhelmingly a tightening of the program, which is constructive on reducing emissions and constructive on EUA prices. Important to note, these measures being voted on and implemented are tightening measures, not easing. The linear reduction factor (LFR), which is the percentage decrease in the annual emission cap, will now be 4.5% from 2.2%. The Market Stability Reserve (MSR)* will continue operation and will be maintained at 24% of the annual auction, rather than the default 12%. This means that only 76% of the cap will be made available at auction, forcing polluters to use existing inventory and reducing the overall supply in the market. Both measures are material and should continue to be major drivers of performance, especially as the Total Number of Allowances in Circulation (TNAC) continues to fall.
Another measure being implemented is an adjustment to the upper band trigger. If the price rises above, and stays above for more than 6 months, two times the preceding 2-year average, the MSR will introduce an extra 10% supply to the market to cool the price. This is a change from three times. While this would fall into the camp of potential easing, we note that hitting either the 2x or 3x multiple on a 2-year average is mathematically challenging without excessive price moves, and as such, this measure has little to no effect in our pricing models. We modeled that a 100% return could be sustainable without this level being triggered in the future.
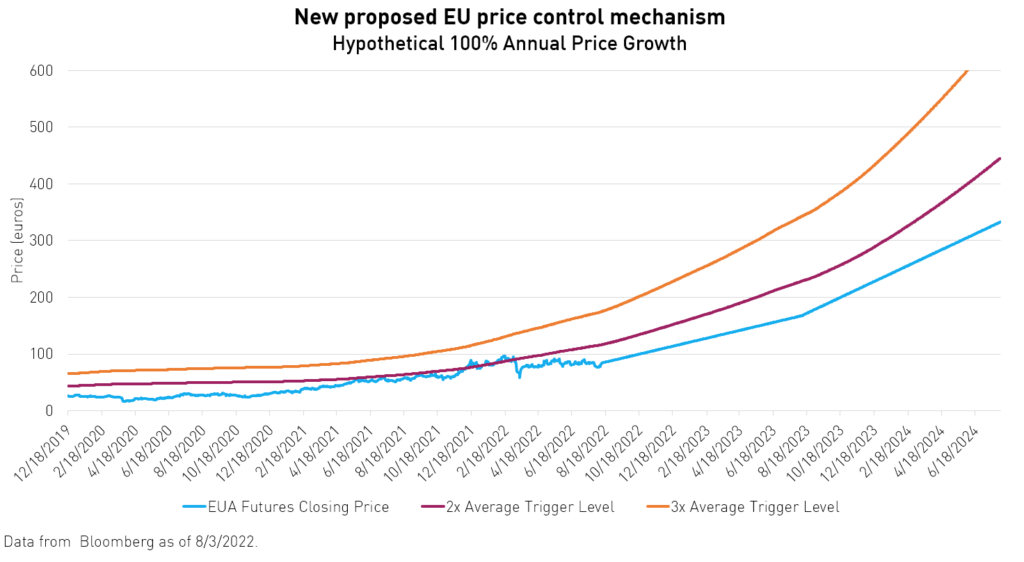
The diagram above shows the EUA price modeled to rise by a linear 100% per year and how it should not trigger the price control mechanism with either the x2 or x3 multiple. However, it’s worth noting that under the newly proposed method, we hit the upside back in late 2021 but not for over a six-month period to trigger it.
So, who said there would be easing? There has been a proposal to sell 200-250 million allowances from the MSR to raise funds for accelerating Europe’s decarbonization and independence from Russian gas. This would provide an extra $20bn to the total $300bn being raised.4 We’ve previously stated how we thought this measure could be frustrating to the market in that it would change the rules of the MSR and partially unwind the tightening measures that had occurred over the past year and year ahead. However, we also noted that it might give European industry desired relief in the face of high energy prices and be a long-term win for the program and, therefore, the climate.
Since then, we have seen the proposal lose popularity in Europe, with analysts giving it a 50/50 chance at best of passing.5 We would be happy with this not passing as it would maintain the course of reducing allowances faster and therefore reducing emissions with higher allowance prices – this is the win/win scenario we are all looking for. Why are European countries against it? The countries objecting do not want to see extra supply soften prices, which would reduce the auction revenues they are earning from the allowances. This is the beauty of a cap-and-trade program, it aligns climate activists and capitalists to fight on the same side.
And what about those curbs on speculators? This one has made very little progress and most analysts do not see this happening. Our view is that removing the price discovery mechanism, risk transfer and every other mechanism that comes into play when markets are open and transparent would reduce the ETS’s ability to achieve its goal. As such, we do not believe it will gain enough support to pass. For context, only the EU Parliament has voiced support, the EU Council has been silent, and the EU Commission is strongly against it.
The remaining part of this outlook is to think about demand. There is no doubt that European industrial numbers are showing a pullback and that could lead to lower emissions than currently anticipated. The reduced natural gas supply may also lead to steeper limits on certain high carbon-intensive industries in Europe that should further reduce, albeit short-term, the emissions. There is a lot to digest here so I will try to keep it concise.
The biggest headwind for EUA prices in the short term is a temporary suspension of emissions from natural gas-intensive industries, mainly in Germany. However, this is mostly priced in at this stage and we do not expect further news of gas rationing or process halts to materially change pricing models. This kind of emission reduction, unfortunately, doesn’t aid climate action as the processes will simply have to be ramped up again in the future to compensate. This also ensures that any price weakness we have today, due to potential trimming of demand, will have to come back stronger in the future. Think of it a little bit like a short. Yes, it has pushed the market down today, but those shorts must buy back in the future and will be doing so in a tighter market!
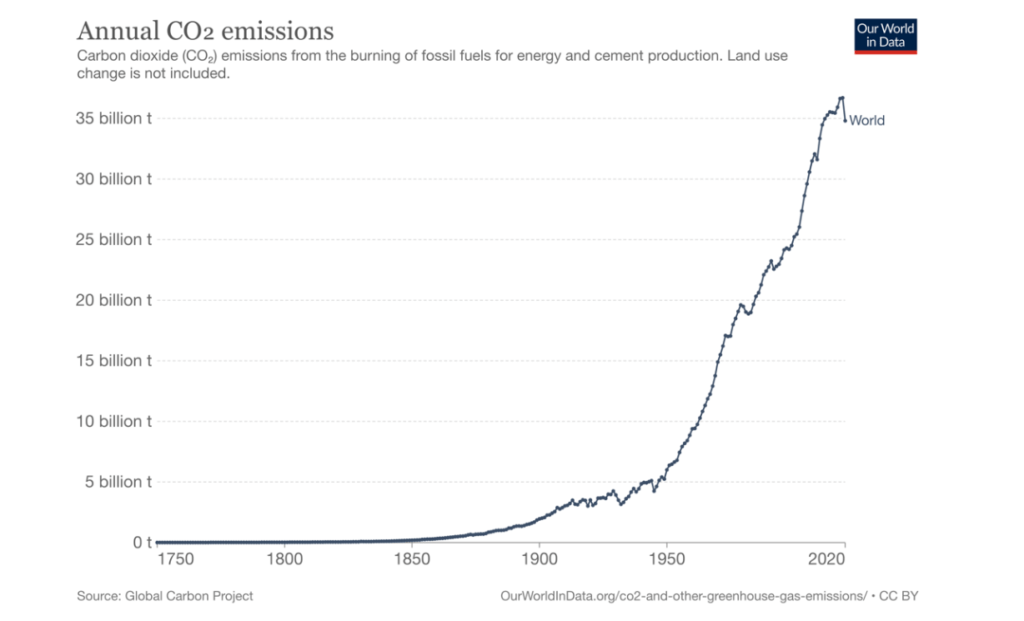
Next is the question of recession and lower industrial output. As we mentioned, some European industrial data is rolling over and as a result, the market anticipates lower emissions in that environment. How much lower? Well, maybe not that much lower. Even during the height of the pandemic, which reflected a hard stop in much of the global economy, we still saw emissions barely retrace to levels of two years prior. And the switch back to coal from the “greener” natural gas means that even with lower activity, emissions will be inflated against recent years. How much of this is priced in? European PMIs* and such are well understood and transparent and would suggest they are fully priced into futures prices today. That said, let’s consider how much the carbon markets have changed. Since the last brief recession in March 2020, we have had two years for the 24% MSR cuts in addition to the regular lowering of the cap via the linear reduction factor. We have seen the TNAC shrink to roughly 1.4bn tons. While demand is clearly always an important part of the demand/supply equation, we have seen continued tightening implementation, which increasingly puts the onus on supply. It is our view that the supply side policy should continue to put a buffer between the carbon markets and the economic cycle (demand). This not only supports prices during a recession, but it also maintains low correlations.
In summary, the EUA market remains the most committed to tightening and reaching its emission goals despite the geopolitical and recession risks. The EU economy is burning more coal and therefore increasing emissions, which even in reduced activity could balance demand. Lastly, we are hearing that Europe industrials view any weakness here as an opportunity to stockpile EUAs; we believe there will be strong support at €70, which gives us confidence in today’s prices.
United Kingdom
The United Kingdom Emission Trading System, added to KRBN in 2021 at around 5%, and technically the newest market launched in May of that year has been the steadiest. The UK is better insulated from energy politics with more independence than its European counterparts. At peak volatility, UKAs were “only” down 9% and closed H1 +10%, currently around +4.5% YTD.3 Remember these markets are volatile, but uncorrelated with other asset classes and each other. UK allowance (UKA) market was the most robust and proved itself in its post-Brexit form.
This is where it gets interesting. Not only did the UK hold up well, but it also has a unique opportunity to now supply mainland Europe with energy via the electrical interconnector with France that runs through the Channel Tunnel. This creates an interesting dynamic. UK power stations will now generate more power using coal and gas in the UK that can be sold profitably to Europe. This should drive up both demand for UKAs and the ability to pay higher prices for them.
Additionally, the UK just went through an extraordinary heat wave and lacks the infrastructure (AC and such) to manage it. This climate change induced problem should lead to more power-sucking technology being adopted in the UK, which risks driving up emissions and allowance demand in the longer term. This development will be devastating for climate change unless we develop more efficient and renewable alternatives. How do you create the economic environment for investment with these innovations? Robust carbon prices.
Put these together and a strongly bullish direction could develop, even from a high-level today. The balance to this thesis is that the TNAC may grow slightly, as is normal for newer programs, and absorb some of the extra demand. This raises a point I discuss constantly with clients. There is a strong thesis with investors that lower-priced programs, such as CCA at $28 or RGGI at $13, have more upside than higher-price schemes like the UK at $95 and EUA at $80. While I would agree the quantum of upside is higher in the low-priced schemes, the larger programs can still potentially put up modest to strong returns while we wait for the big moves in emerging schemes. We are highly constructive in allocating to CCAs; in fact, the KraneShares California Carbon Allowance Strategy ETF (Ticker: KCCA) has seen its shares outstanding (units of the fund) grow 95% this year, but don’t overlook the diversification** benefits of the balanced portfolio in KRBN. We’ll cover KCCA and California more in a moment. For investors, we really like the balanced portfolio inside KRBN with a California overweight using KCCA.
The performance data quoted represents past performance. Past performance does not guarantee future results. The investment return and principal value of an investment will fluctuate such that an investor’s shares, when sold or redeemed, may be worth more or less than their original cost, and current performance may be lower or higher than the performance quoted. For performance data current to the last month-end, please visit our website at www.kraneshares.com or call +1 (855) 8KRANE8.
RGGI
The RGGI program, roughly 5% of KRBN, has faced broad bearish macroeconomic developments with the added layer of uncertainty surrounding Pennsylvania’s entry into the program. With that said, RGGI held up well, trading close to $14, the current upside band, for most of the year.3 The maximum drawdown was just 11.7% at the height of volatility and only –7.55% from all-time highs.3 With greater clarity on Pennsylvania’s timeline for entry into the market, we could potentially see some upward price pressure in the coming months and after the new year when the upper and resets 7%.
In recent news, the RGGI program review was pushed from end-of-year 2022 to end-of-year 2023, which may temper prices but could then provide some upside with bullish potential changes to the market structure at the end of next year. Pennsylvania—which was to have sold 16 million allowances—will likely not participate in the Q3 auction as it stands as there is currently no stated timeline for the Supreme Court to hear the appeal and the GOP lawmakers and coal industries’ lawsuits in the Commonwealth Court are not to occur until the fall. Although RGGI Inc. said in a statement that it was operating under the premise that it would be able to participate in the upcoming auction being that there is still a chance that the state supreme court could issue an order that lifts the current injunction just prior to the auction. As for Virginia, Gov. Glenn Youngkin (R) has attempted to withdraw the state from RGGI but has been unable to overcome opposition from Senate Democrats and we do not see Virginia leaving the program anytime soon.
California
The California Carbon Allowance (CCA) program, which is 30% of KRBN and 100% of KCCA, is set for a shakeup that may drive CCA prices higher as tightening measures are proposed and implemented, keeping the state’s emissions targets on track. Currently, the Air Resource Board (ARB) is finalizing the 2022 Scoping Plan as part of California’s five-year required climate strategy update, which outlines ways for the state to reach its emission reduction target of 40% below 1990 levels by 2030, and carbon neutrality by 2045. In July, California Governor Gavin Newsom (D) urged the ARB to incorporate new, stricter measures into the 2022 Scoping Plan.6 Some of the new actions Newsom outlined include enhanced efforts to advance offshore wind, a more stringent Low Carbon Fuel Standard (LCFS), a new aviation clean fuels target, residential heat pumps target, new natural and engineered carbon removal goals, and addressing methane leaks.6 The infrastructure law passed in November 2021 and the climate policies in the recently announced Inflation Reduction Act also ramp up support for decarbonizing the US economy and reducing emissions.
So far this summer, CCAs have continued to decline but recent price moves appear to be macro-driven, particularly with higher gas prices and rising inflation weighing on the market. Looking ahead, analysts and market participants largely anticipate strong upside potential for CCA prices as buyers may take advantage of the weakness in price. Moreover, between Newsom’s comments, the Inflation Reduction Act, and the infrastructure bill there is a clear directional path and appetite for increased climate regulation, creating an environment that can be bullish for CCA.
Remember, the basic concept is that by reducing the supply of allowances, the regulator is reducing the number of possible future emissions without directly changing any industrial processes. This means existing industries may need to adjust their operations to account for the reduced supply of allowances for emissions. Investors have been increasingly positioning in California allowances, with KCCA shares outstanding increasing by 60% since May, 95% YTD3, as many speculate that the program offers improved risk-return relative to the larger, higher price schemes.
Summary
As the effects of climate change continue to become apparent and both economic and political forces align around climate action, we believe global carbon markets will continue to make new highs. Remember, the objective is to tighten markets to reduce carbon emissions. The transmission for this mechanism is higher prices as demand and supply become less balanced. Higher prices lead to fuel switches and greener processes and, most of all, lead to innovation in reducing industrial emissions. In fact, some of the worst historical polluters now favor higher carbon prices so that their greener technologies will become more economically viable. This is the power of capital markets in creating the right action. Being long carbon allowances is being long tightening climate regulation and climate action is in a structural bull market.
*Term Definitions:
- Purchasing Managers Index (PMI): is an indication of market conditions based on the prevailing direction of economic trends in the manufacturing and service sectors.
- Market Stability Reserve (MSR): started in 2019 and aims to provide stability for carbon pricing within the EU ETS by addressing a surplus of allowances. The MSR is designed to make the market more resilient to any major shocks by adjusting the supply of allowances to be auctioned
**Diversification does not ensure a profit or guarantee against a loss.
Citations:
- Data from Bloomberg as of 12/31/2021
- The Street, “Top Performing ETFs For 2021”, Jan 4, 20221, Top Performing ETFs For 2021
- Data from Bloomberg as of 8/2/2022
- Financial Times, “EU prepares to sell more carbon permits to pay for exit from Russian gas,” May 17, 2022
- Carbon Pulse, “REPowerEU, MSR sale plans face “significant” problems, challenges, EU’s financial watchdog warns,” July 27, 2022
- Carbon Pulse, “Governor Newsom requests aggressive action in California’s 2022 Scoping Plan”, July 25, 2022
Editor’s Note: The summary bullets for this article were chosen by Seeking Alpha editors.
Be the first to comment