

Canadian Dollar, USD/CAD, Crude Oil, WTI, Non-Farm Payrolls, Technical Analysis – Talking Points:
The Canadian Dollar was one of the best-performing G10 currencies against the US Dollar on Thursday. This was not too much of a surprise given that the energy-sensitive Loonie tracked a rise in WTI crude oil prices overnight. Oil closed at its highest since November 17th, surging 3.2% in the best daily performance in a month.
There did not appear to be a single catalyst for the push higher in WTI, but rather a few developing themes. Recently, colder-than-average temperatures throughout the northern United States and Canada have been threatening supply disruptions. This is as American oil stockpiles have been on the decline in recent weeks. Furthermore, there are concerns about OPEC+ output hike promises.
According to data from Bloomberg, the oil-producing cartel added only 90k barrels per day in December. Hikes by Saudi Arabia were offset by declines in Nigeria and Libya. Members are planning to raise output by 400k barrels per day in the coming months. As such, markets are likely pricing in some doubt as to whether or not OPEC+ could commit to its goals.
USD/CAD one-week implied volatility is at its highest in almost one month. This could be explained by incoming jobs data from the United States and Canada to wrap up this week. US non-farm payrolls will be particularly watched given the Federal Reserve’s recent hawkish pivot. Better-than-expected labor market data may underscore hawkish monetary policy bets, which may dent the sentiment-sensitive commodity. This could leave USD/CAD pointing higher in the near term.
Canadian Dollar Technical Analysis
From a technical standpoint, USD/CAD finds itself testing the floor of a bearish Rising Wedge chart formation. Confirming the push lower may open the door to resuming the near-term downtrend since late December. Such an outcome may place the focus on rising support from October, opening the door for the dominant uptrend to resume course.
USD/CAD 4-Hour Chart
Chart Created Using TradingView
Crude Oil Technical Analysis
WTI crude oil is attempting to confirm a breakout above the 78.24 – 79.15 inflection zone. That has exposed the November 16th high at 81.78. However, negative RSI divergence continues to persist as prices touch higher highs. This is a telltale sign of fading upside momentum, which can at times precede a turn lower. If prices turn lower, keep a close eye on the 50-period Simple Moving Average for potential support.
WTI 4-Hour Chart
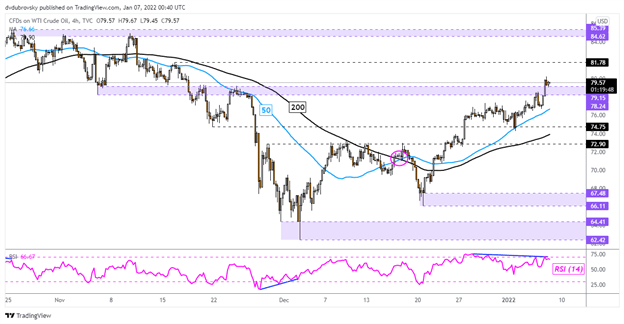
Chart Created Using TradingView
–— Written by Daniel Dubrovsky, Strategist for DailyFX.com
To contact Daniel, use the comments section below or @ddubrovskyFX on Twitter
Be the first to comment