

imagestock/E+ via Getty Images
According to The Bank of International Settlements, the global foreign currency exchange (FX) daily transactional turnover averages $6.6 trillion. At Technical Traders, we track a variety of markets, asset classes, and global money flow looking for clues that will help us in our quest for ETF returns. Interestingly, when foreign exchange is charted as a benchmark to the SPY (S&P 500), we can see that FX has also been in a risk-on environment for the past 2 years.
Recently, we looked at volatility utilizing the CBOE Volatility Index known as VIX. But there are alternative ways or tools that we can use to analyze asset prices.
Global Money Flow Has been Risk-On
As seen in energy, metals, food commodities, and real estate, the recent surge in inflation has also been taking place in foreign exchange. Commodity currencies typically refer to the Australian, New Zealand, and Canadian dollars. To a certain extent, the U.S. dollar as well due to its global ranking as one of the top producers of worldwide oil and gas.
Typically, a currency like the Australian dollar will experience global money in-flows in a risk-on environment. Whereas in a risk-off environment, the opposite occurs as money flows out of currencies like the Australian dollar and back into what are considered safe haven currencies like the Swiss franc, Japanese yen, and the U.S. dollar.
Recently, money has been re-allocating to different assets as global investors seek returns. The FX markets have also benefited from capital in-flows. Looking at the last 2 years, beginning from the Covid lows put in on March 2020, we see the SPY went from a -30% loss to early January, where the SPY touched +50%.
Interestingly, the AUDJPY (Australian dollar vs. Japanese yen) went from -15% to more than +20% or a total change of 35% during the same timeframe. But how do we utilize this information to determine where we are in the current market cycle? Let’s walk through this process together to see what clues the FX market may have to guide our ETF selection and trading.
AUDJPY Vs. SPY – Daily Chart
Technical Traders – TradingView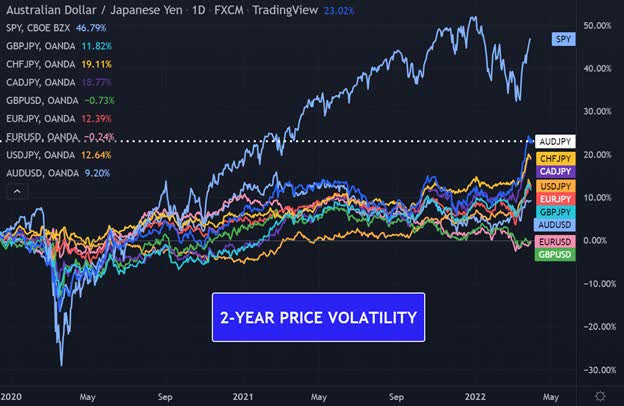
GBPJPY Reacts To 6-Year Upper Channel Resistance
Based on the historical analysis, the GBPJPY (British pound vs. Japanese yen) tends to track the SPY, and therefore we will do a quick breakdown of the GBPJPY.
Immediately, we can see on the following monthly chart that the GBPJPY reacts nicely to its 72-month or 6-year upper and lower channel. In 2011, the GBPJPY made a low and turned up at its 6-year lower channel.
During the 2015 to 2016 time frame, the GBPJPY then put in a head and shoulders top formation over a 12-month period at the 6-year upper channel. It’s important to note that the head of the top was at 166.6% of the GBPJPY all-time low in the GBPJPY, and the shoulders were made at the Fibonacci 161.8% of the GBPJPY all-time low.
The 2016 drop was 17 months down, and the 2017 reaction back up was 17 months up. The 2019-20 drop was 26 months down, and to date, the 2020-21 move back up has just completed 26 months up. Note: indicator includes or counts both the low-month and the high-month in its counts. The main point here is that the GBPJPY, in its recent past, has been mirroring its previous price wave.
Both 2016 and 2017 lows were made at 50% of the GBPJPY all-time high. But the 2020 low also turned at the 6-year lower channel.
Now we find the GBPJPY currently reacting to its 6-year upper channel after booking a 26-bar (month) rally.
It is important to note that this article is written to give us insights into some alternative research to challenge us to find clues in price. Time will provide confirmation of this research or not, but if the price continues to react at these levels, we may need to consider that market psychology or trend may be beginning to shift.
GBPJPY – British Pound Vs. Japanese Yen – Monthly Chart
Technical Traders – GBPJPY – Daily Chart – FXCM Trading Station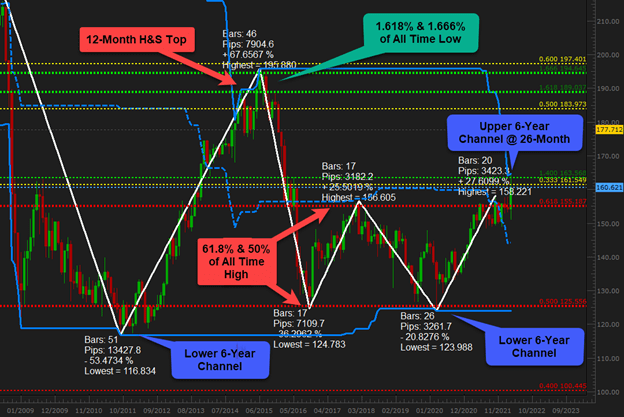
Learn How To Use Price To Determine Trend
As technical traders, we follow price only, and when a new trend has been confirmed, we will change our positions accordingly.
Editor’s Note: The summary bullets for this article were chosen by Seeking Alpha editors.
Be the first to comment