

genkur
Camtek Ltd. (NASDAQ:CAMT) has been trending lower for months, culminating in the stock setting a new 52-week low in early July. In doing so, CAMT lost roughly half of its value. However, the stock has recovered in recent days, and further gains are possible if charts are any indication. The stock seems to have found support at an important junction, but whether it will hold remains to be seen. Why will be covered next.
Why CAMT is at an important junction
CAMT is a supplier of semiconductor manufacturing equipment, specifically as it relates to metrology and inspection tools. Like many of its peers, CAMT has seen its stock drop in 2022. The stock has lost 47% of its value YTD. In comparison, the iShares PHLX Semiconductor ETF (SOXX) has lost 34% YTD. KLA Corp. (KLAC), which is generally considered the leading supplier of metrology and inspection tools, is down 26% YTD.
Not only has CAMT underperformed YTD, but there is reason to think further losses are likely if the current trend continues. The chart below shows the price action in 2022. If the recent lows and highs are connected to form trendlines, a channel appears that is sloping downwards. The stock has been unable to cross either the lower or the upper boundary of the channel for almost six months. As long as this channel remains intact, the stock is going lower.
Source: finviz.com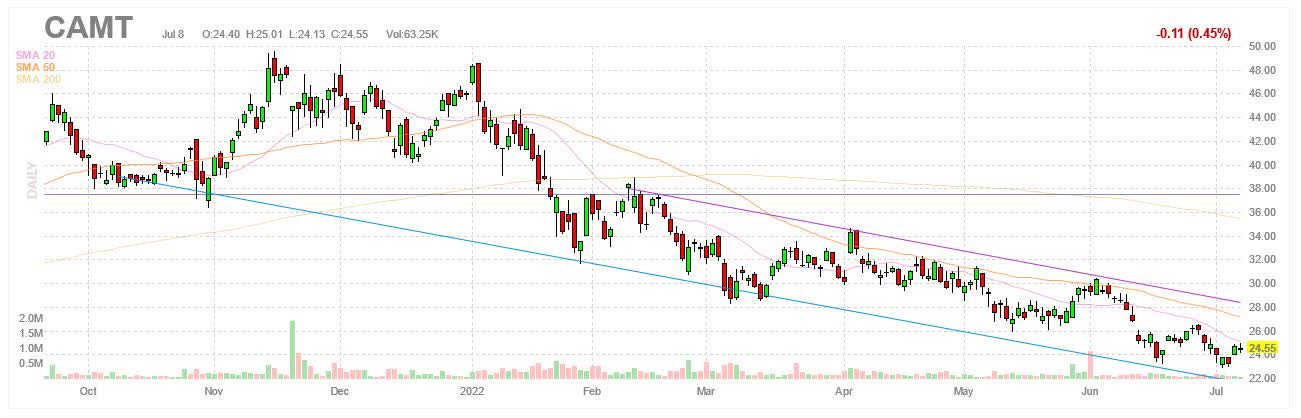
The stock has continued to set new 52-week lows as it goes through the channel, the latest one occurring on July 6 when it closed at $23.11 after hitting an intraday low of $22.89. However, the stock has rebounded, proceeding to move higher and appreciating by 6% in the last couple of days. It could be a coincidence, but it is interesting to see how all of this occurred after the stock hit the $23 price level.
The rebound in the stock coincided with the stock reaching an important price level. It’s worth mentioning that $22.50-23.00 is approximately equal to the 68.1% Fibonacci retracement level, going from the low in the middle of March 2020 to the high in the early part of January 2022. While there are a number of Fibonacci retracement levels, the 68.1% one is generally considered one of the more important ones, if not the most important one.
Fibonacci retracement levels are seen as potential areas of support. The magnitude of the moves in the last few days combined with the fact that the stock bounced at where the 68.1% Fibonacci retracement level is supposed to be suggests CAMT has found support, at least to some degree. At the very least, it’s an encouraging sign for those who are leaning long.
The question now is whether support will continue to hold or whether the stock reverses course for another attempt at breaking through the 68.1% Fibonacci level. The former could pave the way for a sustained move higher, especially with the stock having lost as much ground as it has in 2022. Alternatively, the stock could fall below support on a subsequent attempt, opening the door to new 52-week lows. Either scenario is a possibility at this point.
CAMT has gotten a lot cheaper
There is reason to believe the stock may be due for a change in direction after all that has happened thus far. In addition, valuations have also come down, especially compared to where they were at the start of the year. Multiples for CAMT have fallen below their 5-year average after the big drop in the price of the stock. For instance, CAMT now trades at 15 times forward earnings. In comparison, the 5-year average is 22 and the sector median is at 21. The table below shows the multiples for CAMT.
|
CAMT |
|
|
Market cap |
$1.08B |
|
Enterprise value |
$888.98M |
|
Revenue (“ttm”) |
$289.5M |
|
EBITDA |
$79.0M |
|
Trailing P/E |
17.14 |
|
Forward P/E |
15.44 |
|
PEG ratio |
0.20 |
|
P/S |
3.71 |
|
P/B |
3.42 |
|
EV/sales |
3.07 |
|
Trailing EV/EBITDA |
11.26 |
|
Forward EV/EBITDA |
9.38 |
Source: Seeking Alpha
CAMT is growing fast, but there may be trouble ahead
CAMT is currently in the midst of a growth spurt, with the company growing at a pace that far exceeds the average from prior years. For instance, annual sales grew at a CAGR of 11-12% in the last ten years, but CAMT managed to increase sales by 73% YoY to $269.7M in the last fiscal year, setting a new record high.
However, growth may be about to slow down if the numbers from the most recent earnings report are any indication. Q1 FY2022 revenue increased by 34.6% YoY to a record $77.2M. GAAP EPS increased by 30% YoY to $0.39 and non-GAAP EPS increased by 33.3% YoY to $0.44. Note that GAAP net income in Q4 FY2021 was negatively affected by a one-time tax provision of $5.3M due to historical exempt earnings, skewing the QoQ comparisons. The table below shows the numbers for Q1 FY2022.
|
(GAAP) |
Q1 FY2022 |
Q4 FY2021 |
Q1 FY2021 |
QoQ |
YoY |
|
Revenue |
$77.166M |
$74.171M |
$57.352M |
4.04% |
34.55% |
|
Gross margin |
51.6% |
50.7% |
50.5% |
90bps |
110bps |
|
Operating profit |
$19.526M |
$19.314M |
$14.399M |
1.10% |
35.61% |
|
Net income |
$18.378M |
$12.760M |
$13.360M |
44.03% |
37.56% |
|
EPS |
$0.39 |
$0.28 |
$0.30 |
39.29% |
30.00% |
|
(Non-GAAP) |
|||||
|
Revenue |
$77.166M |
$74.171M |
$57.352M |
4.04% |
34.55% |
|
Gross margin |
52.0% |
50.9% |
50.7% |
110bps |
130bps |
|
Operating profit |
$22.191M |
$20.936M |
$15.610M |
5.99% |
42.16% |
|
Net income |
$21.043M |
$19.687M |
$14.571M |
6.89% |
44.42% |
|
EPS |
$0.44 |
$0.43 |
$0.33 |
2.33% |
33.33% |
Source: CAMT
Guidance calls for Q2 FY2022 revenue of $77-80M, an increase of 16.3% YoY at the midpoint.
|
Q2 FY2022 (guidance) |
Q2 FY2021 |
YoY (midpoint) |
|
|
Revenue |
$77-80M |
$67.5M |
16.30% |
In addition, while CAMT is upbeat about demand with the company receiving $150M in new orders YTD, FY2022 revenue is only projected to grow in the mid-to-high teens YoY. In comparison, FY2021 revenue grew by 73% YoY to $270M as mentioned earlier. In fact, the Q2 guidance implies sales in the second half will be nearly flat compared to the first half, even if FY2022 sales growth ends up in the high teens. From the Q1 earnings call:
“I think, at this stage, with all the volatility in the market, it’s very hard to really say more, than we expect this year to be a growth year in the mid to high teens. I think, this is as much as we can say at this stage, but definitely, we’re encouraged by the level of the backlog in the pipeline for the second half in the first quarter of ’23.”
A transcript of the Q1 FY2022 earnings call can be found here.
Management seems to have become cautious in terms of its outlook, and a big reason for this seems to be supply chain disruptions, particularly as it relates to China due to lockdowns over there.
“The side effect of the COVID-19 continues to interrupt our business, as delivery times for material and parts, are still long. Prices of components and parts are more expensive. Border of some countries in Asia are still practically closed, and our field engineers cannot visit customers as often as they used to do in the past, or travel for advanced training in Israel. In China, the situation is more complicated. Most of the semiconductor industry in China is in the Shanghai area, thus lock down in Shanghai affect the whole industry. Parts are operating, but they do so at lower capacity than usual.
All in all, the entire semiconductor manufacturing chain is disrupted due to look down in Shanghai, including ports and airports in this area.”
Note that while CAMT did not give out an exact number in its most recent annual report, it did mention that the Asia-Pacific region contributed 83% of total revenue, with China accounting for most of it.
Investor takeaways
Suppliers of semiconductor manufacturing equipment are coming off a record-setting year in 2021. However, the equipment market tends to go through cycles, and there are indications the market is past the peak in the current cycle. For instance, a recent report from SEMI expects spending on fab equipment to grow by 20% YoY to a record $109B in 2022.
This represents a near doubling of spending compared to 2019, when spending reached $55B. On the other hand, while 20% is still a good number, it is down from the year before, when spending grew by 42% YoY to $91B in 2021. Furthermore, spending is expected to stay flat at $109B in 2023. In other words, the growth seen in the last several years is coming to an end.
Worse, there is even the possibility of a more severe downturn if companies wind up pulling back and investing much less than what they intended to do, possibly due to deteriorating economic conditions. For instance, Micron (MU) recently announced it would reduce production expansion in response to weakening consumer demand, which implies reduced demand for manufacturing equipment. If this is the start of a trend, fab spending could be much less than anticipated.
I am neutral on CAMT. CAMT is reasonably priced and the stock may be set to rally after hitting an important support level. On the other hand, it’s not impossible for the stock to resume its decline and breach support. The trend is still pointing down, as has been the case for the last six months. The charts leave open the possibility of a further decline.
CAMT is heavily exposed to the market in China, which means any lockdowns there due to COVID-19 could have a major impact. The lockdowns, for instance, prevent or delay customer acceptance of equipment, which will show up in the quarterly numbers. CAMT is prone to these types of supply disruptions as long as China sticks to its Zero COVID policy.
Bottom line, there are far more reasons to stay on hold than to go all-in on CAMT at this point. The stock still looks weak despite a short-term bounce, as does the stock market in general. The outlook does not look encouraging with the market for wafer fab equipment expected to slow down to a crawl and may even contract if more companies follow in the footsteps of MU. The potential risks seem to outweigh the possible rewards. If this is the case, then taking a wait-and-see approach to CAMT is best.
Be the first to comment